 Duplex
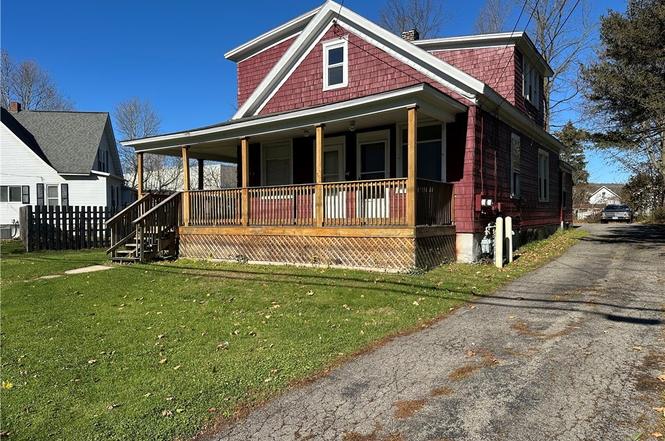
132 Central Ave · Cortland, NY
Flood risk 6/10 · Moderate
- FEMA flood zone
- X (unshaded)
- Chance of flooding over 30 yrs
- 0.71%
- Est. flood insurance / yr
- $473 – $860
Fire risk 3/10 · Minor
- Est. fire insurance / yr
- $691 – $1,283
Heat risk 3/10 · Minor
- Hot days now (above 92°F)
- 8 days/yr
- Hot days in 30 yrs
- 18 days/yr
Wind risk 2/10 · Minimal
- Chance of severe wind over 30 yrs
- 1.0%
Air-quality risk 2/10 · Minimal
- Unhealthy air days now
- 0 days/yr
- Unhealthy air days in 30 yrs
- 1 days/yr
Risk factors via First Street. Map © Google.
Why this score? — see what drove the B grade
The composite is a weighted blend of 9 inputs, each scored 0–100. Each bar is that input's sub-score; the figure is the points it added to the 100-point composite (weight × sub-score).
- Cash flow +30.0/30.0
- 1% rule +10.0/10.0
- DSCR +10.0/10.0
- ARV discount +9.2/15.0
- Rent growth +4.6/5.0
- Schools +4.3/10.0
- Livability +3.9/5.0
- Condition / age +2.5/5.0
- Appreciation +0.0/10.0
$159,900
🖨 Deal sheet 📄 Offer letter ✓ Due diligence
Multi-family units
County records classify this as Multi-Family (2-4 Unit). Listing-text estimate: 2 units. confirmed
Listing remarks MLS
This is a well kept income property. The new wrap-around covered porch is treated wood. The appliances are newer. The large back yard is fenced on 3 sides and contains 4 parking spaces. The property would make a good owner occupied property. Call for your own tour today!
Key facts
- Quiet street
- Large covered porch
- Access to basement
Tags
Neighborhood map
What this means for you Summary
Snapshot
- This is a 2 × 2-bed/1.5-bath units multifamily listed at $160k.
Deal economics
- At list price, monthly cash flow is $636 ($8k/yr) — positive. Per door: $318/mo.
- The deal already cash-flows at list — no discount required.
- Meets the 1% rule at list price ($2k rent vs $160k).
- Recommended offer: $141k (12.0% below list) — sets the bar for market timing.
- Cap rate 11.1% vs local median 6.2% in Cortland — top-decile yield for the area; either an underpriced asset or a hidden risk that comps aren't pricing in. Stress-test before assuming the spread holds.
Location & tenants
- Location reads 77/100 on livability (#201 in NY, #3,105 nationally) — a middle-class / working-renter tenant base. Strengths: cost of living A+, housing A+, health & safety A+; Watch: crime C-, schools D+, employment D.
- Cortland City School District (town): math 49% / reading 54% proficiency, ranked #368 of 590 in NY (top 62%) — acceptable for families but not a draw, mixed tenant base, ~2y average lease.
- Market conditions: Rents rising fast (+8.4%/yr); 141 active listings in the ZIP; 45 units permitted in Cortland County in 2024 (12 in 5+ unit buildings).
- This rent runs 42% of the median local income ($70k/yr) — at the standard rent-burdened threshold; future hikes will face affordability resistance.
Forward outlook
- Local home prices are declining (-3.0%/yr); year-one equity from $1k of loan paydown is wiped out by about $5k of value loss. Plan a longer hold.
- Cortland County population projected at -15% by 2050 — secular population decline; favor cash flow + early exit over multi-decade hold.
- At projected returns (-3.0% appreciation + 8.0% rent growth), your $45k cash investment doubles in ~6 years — after that, you're playing with house money.
Negotiation context
- It's been on market 139 days — a 12% lower offer ($141k) is reasonable based on typical stale-listing flexibility.
- 4 sale attempts since 6y ago with the ask held roughly flat each time — persistent listings suggest the price (not the market) is what's stuck; bring a comps-based counter.
- Current owner paid $95k; list at $160k implies a 68% gain — meaningful room to come down on a strong offer.
Risks & watch-outs
- Watch-outs: property tax is 2.9% of price; built in 1914 — expect roof / HVAC / electrical / plumbing capex.
- Climate carrying-cost: major flood risk — expect insurance premiums to compound above CPI over the hold.
Questions for the listing agent
- It's been on market 139 days. Have you received any prior offers? Is the seller open to a 12% concession, seller financing, or rate buy-down credit?
- Can we see the unit-by-unit rent roll, current vacancy, and any below-market leases? What's the average tenancy length?
- What capital expenditures (roof, boiler, parking lot, exteriors) have been made in the last 5 years, and what's planned in the next 2?
- Built in 1914 — when were the roof, HVAC, electrical panel, plumbing, and water heater last replaced?
- Property tax is high relative to price — has the assessment been appealed recently, and will the sale trigger a re-assessment?
- Why hasn't it sold? Are there any deal-killer items the seller is aware of (foundation, flood, title, zoning, code violations)?
- Is there a deadline driving the sale (1031 exchange, divorce, estate, relocation)? That informs how much negotiation room exists.
- Schools are D-rated, which usually means shorter tenancies and higher turnover. Who's the typical renter profile here, and what's been the actual vacancy rate?
- What's the average days-on-market for RENTAL listings here right now (not sales)? A rising rental-DOM trend means longer vacancies and softer asking-rent achievability than the comps imply.
- What's the recent tenant-quality profile in this submarket — average credit score on applications, eviction rate, late-payment / NSF rate, and stable-employment percentage? A property-management company in the area should have these aggregated.
- How much new apartment / multifamily construction is in the pipeline within 1–3 miles? Heavy new supply (>2% of stock underway) typically softens rents 12–24 months out; light construction supports rent growth.
Investment metrics
- 1% rule
- 1.53% ✓
- Cap rate
- 11.06%
- Cash-on-cash
- 17.04%
- DSCR
- 1.76
- GRM
- 5.5
CMA / ARV
- ARV (on-the-fly)
- $166,152
- Comps found
- 8
Show comp detail 8 sales within ~0.75 mi
| Address | Dist | Beds/Ba | Sqft | Sold | Price | $/sf | Match |
|---|---|---|---|---|---|---|---|
| 132 Central Ave | 0.00mi | 5/3.0 | 1,932 (0%) | 0mo | $146,000 | $76 | 100 |
| 57 Hubbard St | 0.03mi | 4/3.0 (-1) | 1,868 (-3%) | 10mo | $188,200 | $101 | 80 |
| 10 Washington St | 0.40mi | 5/2.0 | 1,932 (0%) | 7mo | $177,000 | $92 | 71 |
| 64 Elm St | 0.18mi | 4/2.0 (-1) | 1,750 (-9%) | 10mo | $179,000 | $102 | 59 |
| 24 Washington St | 0.48mi | 5/3.0 | 2,086 (+8%) | 11mo | $170,000 | $81 | 55 |
| 15 Hubbard St | 0.26mi | 4/3.0 (-1) | 2,154 (+12%) | 15mo | $100,000 | $46 | 51 |
| 243 Port Watson St | 0.51mi | 4/2.0 (-1) | 1,788 (-8%) | 12mo | $125,000 | $70 | 45 |
| 39 E Court St | 0.30mi | 4/2.0 (-1) | 1,680 (-13%) | 20mo | $144,000 | $86 | 39 |
Match score weights: distance 35% · size 25% · config 20% · recency 20%. Top-matched comps best support the ARV.
Projected returns pro-forma
-3.0% appreciation · 8.0% rent growth · sell at horizon
- IRR
- 14.4%
- Equity multiple
- 1.62×
- Total profit
- $27,639
- Equity at exit
- $23,842
- IRR
- 27.0%
- Equity multiple
- 4.03×
- Total profit
- $135,603
- Equity at exit
- $13,825
Cash invested: $44,772 (down + closing). Projections, not guarantees.
Landlord ↔ Tenant lean methodology
- Overall (STATE)
- 15 Strongly Tenant-Friendly
- State New York
- 15 Strongly Tenant-Friendly · D+10
- County
- — inherits STATE
- City
- — inherits STATE
ZIP-level market 13045
- Home prices YoY
- -9.3%
- Rents YoY
- 8.4%
- Active inventory
- 141
- Price-to-rent
- 10.9×
Monthly cashflow live
- Estimated rent
- $2,444 high interval (Pro) →
- Mortgage (P&I)
- −$839
- Tax from tax record
- −$390 /mo · $4,680/yr
- Insurance
- −$67
- HOA
- −$0
- Vacancy / Maint / Mgmt
- −$513
- Net cashflow
- $636
Break-even live
2-unit breakdown (identical units grouped — click to expand)
| Units | Beds | Baths | Est. rent |
|---|---|---|---|
| 2× units | 2 | 1.5 | $2,444 |
| #1 | 2 | 1.5 | $1,222 |
| #2 | 2 | 1.5 | $1,222 |
| Total (2 units) | $2,444 | ||
UW: 25.0% down · 7.5% · 30yr · 1.5% tax · 5.0% vac · 8.0% maint · 8.0% mgmt
Financing live
Cash to close
- Down payment
- $39,975
- Closing costs
- $4,797
- Reserves months
- —
- Total cash needed
- —
Loan-product check · same deal, 3 products live
Conventional
25% down · 7.5% · 30yr
- Down + closing
- —
- Monthly P&I
- —
- Monthly cashflow
- —
- DSCR
- —
- Eligible?
- —
Personal DTI + credit; lowest rate.
DSCR
20% down · 8.5% · 30yr
- Down + closing
- —
- Monthly P&I
- —
- Monthly cashflow
- —
- DSCR
- —
- Eligible?
- —
No personal income docs; deal must DSCR.
Hard money
10% down · 12.0% · 12mo
- Down + closing
- —
- Monthly P&I
- —
- Monthly cashflow
- —
- DSCR
- —
- Eligible?
- —
Short-term bridge; refi at stabilization.
Listing history 11 events
-
2026-03-30status Pending
-
2026-03-18historical Active Under Contract
-
2026-02-02status Active
-
2026-01-27historical Active Under Contract
-
2025-11-09$159,900 Active
-
2020-12-18soldstatus $95,000 271-char remark
Show marketing remark (271 chars)
This is a well kept income property. The new wrap-around covered porch is treated wood. The appliances are newer. The large back yard is fenced on 3 sides and contains 4 parking spaces. The property would make a good owner occupied property. Call for your own tour today!
-
2020-12-18soldstatus $95,000
Show marketing remark (271 chars)
This is a well kept income property. The new wrap-around covered porch is treated wood. The appliances are newer. The large back yard is fenced on 3 sides and contains 4 parking spaces. The property would make a good owner occupied property. Call for your own tour today!
-
2020-12-17soldstatus $95,000
-
2020-09-14$110,000
-
2020-09-10$110,000 271-char remark
Show marketing remark (271 chars)
This is a well kept income property. The new wrap-around covered porch is treated wood. The appliances are newer. The large back yard is fenced on 3 sides and contains 4 parking spaces. The property would make a good owner occupied property. Call for your own tour today!
-
2007-11-14soldstatus $73,130
ⓘ Source: listings_history table (triggers on properties + properties_extension) + one-shot
backfill from property_details.listing_events for pre-trigger history.
Tax reassessment forecast NY · Partial reset (capped growth)
- Current annual tax
- $4,680 · $390/mo
- Projected year-2 tax
- $4,680 · $390/mo
- Expected delta
- $0/yr ($0/mo · 0.0%)
ⓘ Screening estimate from a state-policy table — verify with the county assessor before closing.
Climate risk First Street
- Flood 6/10 Major FEMA zone X (unshaded) · 71% chance over 30 yrs
- Wildfire 3/10 Moderate
- Heat 3/10 Moderate 8 d/yr ≥92°F today · 18 d/yr by 30 yrs out
- Wind 2/10 Low 100% chance of damaging wind over 30 yrs
- Air quality 2/10 Low 0 unhealthy d/yr today · 1 by 30 yrs out
Nearby sold comps map
Loading sold comps map…
Walkable amenities ~0.75 mi
Loading nearby amenities…
Taxation est. · year 1
- Rental income
- $29,328
- − Mortgage interest
- −$8,957
- − Property taxes
- −$4,680
- − Insurance
- −$800
- − Repairs & maintenance
- −$2,346
- − Management
- −$2,346
- − Depreciation
- −$4,652
- Taxable income
- $5,547
- Est. tax owed @ 24.0%
- −$1,331
- After-tax cash flow
- $6,296/yr
For passive investors: Depreciation is non-cash, so a rental often shows a tax loss while cash-flowing — sheltering income. Rental losses are passive: they offset passive income freely, and up to $25,000/yr can offset ordinary (W-2) income if you actively participate and your MAGI is under $100k (phasing out to $0 by $150k); unused losses carry forward. On sale, claimed depreciation is recaptured at up to 25%, and gains may owe capital-gains tax (a 1031 exchange can defer both). Figures are a year-1 estimate at your 24.0% rate — not tax advice; consult a CPA.
Schools (NCES district)
- District
- Cortland City School District
- NCES district ID
- 3608460
- Math proficiency
- 49% ▲ 6.00%
- Reading proficiency
- 54% ▲ 17.00%
- Median HH income
- $42,413
- Composite
- 43.29/100
- National rank
- #3041
- State rank
- #368 of 590 in NY
Livability — Cortland
- Score
- 77/100
- State rank
- #201
- US rank
- #3105
Category grades
Schools grade is shown separately in the Schools card above.
Census & demographics
- Census place
- Cortland, NY
- County
- Cortland County · 28,361 people
- City population
- 28,361
- Metro
- Cortland, NY
- Population (ZIP)
- 28,361
- Household income
- $69,961
- Rent vs Own
- Severe rent burden
- 1488.0
Population outlook (Cortland County) Hauer SSP2
- Today (2025)
- 47,543 people
- By 2030
- 46,107 · -3.0%
- By 2040
- 43,122 · -9.3%
- By 2050
- 40,216 · -15.4%
- By 2075
- 34,717 · -27.0%
- By 2100
- 28,953 · -39.1%
Race, ethnicity, and origin ACS 2023
- Neighborhood character
- Predominantly White (87%)
- Race & ethnicity
- White 87% Two or more races 5% Hispanic / Latino 5% Black 3% Asian 2%
- Common ancestry
- Romanian 4% Lithuanian 2% Italian 2%
- Foreign-born
- 3% · Canada, China
- Languages at home
- 94% English-only · Spanish 2% Russian/Polish/Slavic 2% Other Indo-European 1%
Political lean MEDSL · Cortland
- 2024 margin
- Lean R (+6.4) · D 46.8% · R 53.2%
- 2008→2024 swing
- -16.4pp toward R · 2008: 10.0pp · 2024: -6.4pp
- All cycles
- 2024: R+6.4 2020: R+1.9 2016: R+6.7 2012: D+8.8 2008: D+10.0
Not yet ingested
- Civics
- —
Market trends
- HPI YoY
- ▼ -29.78%
- Current HPI
- 289.515
- Rent YoY
- ▲ 8.37%
- Metro
- Cortland, NY
- State GDP YoY
- ▲ 2.60%
- F500 in state
- 92
Industry mix (Fortune 500 HQ in NY)
| Industry | F500 HQs | Revenue |
|---|---|---|
| Financial Services | 10 | $950B |
|
||
| Consumer Goods | 9 | $162B |
|
||
| Insurance | 4 | $225B |
|
||
| Telecommunications | 2 | $144B |
|
||
| Pharmaceuticals | 2 | $112B |
|
||
| Media / Entertainment | 2 | $69B |
|
||
Price history
+118.7% since first listed11 events — show timeline
- 2026-03-30 Pending — CNYIS
- 2026-03-18 Contingent — CNYIS
- 2026-02-02 Relisted — CNYIS
- 2026-01-27 Contingent — CNYIS
- 2025-11-09 Listed $159,900 CNYIS
- 2020-12-18 Sold (Public Records) $95,000 Public Records
- 2020-12-18 Sold (MLS) $95,000 GBAOR
- 2020-12-17 Sold (MLS) $95,000 CNYIS
- 2020-09-14 Listed $110,000 CNYIS
- 2020-09-10 Listed $110,000 GBAOR
- 2007-11-14 Sold (Public Records) $73,130 Public Records
Property tax history
+2.3%/yrLatest (2025): $4,680 · +3.8% YoY. Source: county tax records.
Cash-flow waterfall
monthlySold comps — $/sqft
last 12 mo · ≤1 miLoading sold comps…