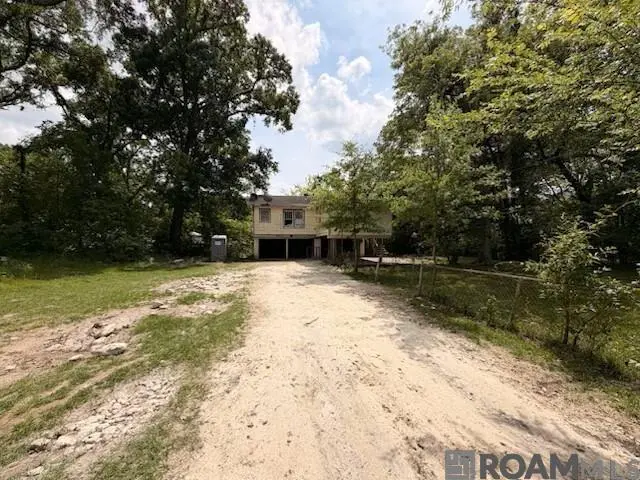
4444 Clayton Dr · Baton Rouge, LA
Flood risk 6/10 · Moderate
- FEMA flood zone
- AE
- Chance of flooding over 30 yrs
- 0.74%
- Est. flood insurance / yr
- $1,737 – $8,500
Fire risk 1/10 · Minimal
- Est. fire insurance / yr
- $1,269 – $2,357
Heat risk 8/10 · Major
- Hot days now (above 108°F)
- 7 days/yr
- Hot days in 30 yrs
- 19 days/yr
Wind risk 9/10 · Severe
- Chance of severe wind over 30 yrs
- 99.0%
Air-quality risk 3/10 · Minor
- Unhealthy air days now
- 3 days/yr
- Unhealthy air days in 30 yrs
- 4 days/yr
Risk factors via First Street. Map © Google.
Why this score? — see what drove the D grade
The composite is a weighted blend of 9 inputs, each scored 0–100. Each bar is that input's sub-score; the figure is the points it added to the 100-point composite (weight × sub-score).
- Cash flow +15.0/30.0
- ARV discount +7.5/15.0
- 1% rule +5.0/10.0
- DSCR +5.0/10.0
- Livability +3.7/5.0
- Condition / age +2.5/5.0
- Schools +2.4/10.0
- Rent growth +2.2/5.0
- Appreciation +0.0/10.0
$19,900
🖨 Deal sheet (PDF) 📄 Offer letter ✓ Due diligence
Listing remarks MLS
INVESTORS WELCOME , NO WAITING PERIODS , SOLD AS IS WHERE IS , NO UTLIITES WILL BE TURNED ON BUYER TO ACCEPT THE HOME IN ITS AS IS CONDITION SELLER WILL NOT PAY CC AND OR NO ALLOWANCES . LOTS OF POTENTIAL AND INVESTORS ARE WELCOME .LOOKING FOR A 4 BEDROOM INVESTMENT THIS ONE MAY BE THE HOME YOU ARE LOOKING FOR . ENJOY THE OPEN KITCHEN WITH LOTS OF CABINET SPACE AND A SPACIOUS BATHROOM . LOW MAINTENCE FLOORING THIS ONE IS A INVESTOR SPECIAL .
Key facts
- 8,712 sq ft lot
- Built 1975
- Listed 11 days
Neighborhood map
What this means for you Summary
Snapshot
- This is a 4-bed/1.0-bath single-family listed at $20k.
Deal economics
- At list price, monthly cash flow is $387 ($5k/yr) — positive.
- The deal already cash-flows at list — no discount required.
- Meets the 1% rule at list price ($1k rent vs $20k).
- Cap rate 55.4% vs local median 4.3% in Baton Rouge — top-decile yield for the area; either an underpriced asset or a hidden risk that comps aren't pricing in. Stress-test before assuming the spread holds.
Location & tenants
- Location reads 74/100 on livability (#24 in LA, #4,535 nationally) — a middle-class / working-renter tenant base. Strengths: commute A+, cost of living A+, health & safety A+; Watch: amenities D, crime F, employment D-.
- East Baton Rouge Parish (urban): math 22% / reading 34% proficiency, ranked #47 of 98 in LA (top 48%) — low school quality limits family demand, transient renter base, plan for 1-2y turnover; 77% free/reduced lunch — lower-income household profile, screen leases tightly.
- Market conditions: Rents soft (-1.2%/yr); 155 active listings in the ZIP; 11 comparable units currently listed for rent nearby; rentals at typical pace (median 24d on market — plan ~3-4 weeks tenant-placement turnaround); lower-income renter base — watch delinquency; 2,252 units permitted in East Baton Rouge Parish in 2024 (440 in 5+ unit buildings).
- At $1,187/mo this rent would consume 56% of the median local household income ($25k/yr) (locally 1980% of renters already pay >50% of income on rent) — very limited rent-growth headroom before tenants either downsize or default.
Forward outlook
- Local home prices are declining (-3.0%/yr); year-one equity from $138 of loan paydown is wiped out by about $597 of value loss. Plan a longer hold.
- East Baton Rouge County population projected at +4% by 2050 — modest demand growth; plan on rents tracking national, not racing it.
- At projected returns (-3.0% appreciation + 0.0% rent growth), your $6k cash investment doubles in ~2 years — after that, you're playing with house money.
Negotiation context
- Only 11 days on market — expect competitive offers; lowballing is unlikely to land.
- 4 sale attempts since 3y ago with the ask held roughly flat each time — persistent listings suggest the price (not the market) is what's stuck; bring a comps-based counter.
Risks & watch-outs
- Watch-outs: flood insurance adds $427/mo.
- Climate carrying-cost: in FEMA flood zone AE (mandatory federal flood insurance); severe wind risk, 99% chance of damaging wind over 30y; extreme-heat days projected 7→19/yr by 2055 (HVAC capex compounding) — expect insurance premiums to compound above CPI over the hold.
Questions for the listing agent
- Built in 1975 — when were the roof, HVAC, electrical panel, plumbing, and water heater last replaced?
- What's the actual annual flood-insurance premium (NFIP or private), and is the property in a SFHA with mandatory coverage?
- Is there a deadline driving the sale (1031 exchange, divorce, estate, relocation)? That informs how much negotiation room exists.
- Crime grade is F in this area — have there been break-ins, vandalism, or insurance claims at this property in the last 3 years? What carrier currently insures it and at what premium?
- The area grade is low — what's the realistic commute time and amenity access for the typical tenant pool here? Any planned neighborhood developments (good or bad) we should know about?
- What's the average days-on-market for RENTAL listings here right now (not sales)? A rising rental-DOM trend means longer vacancies and softer asking-rent achievability than the comps imply.
- What's the recent tenant-quality profile in this submarket — average credit score on applications, eviction rate, late-payment / NSF rate, and stable-employment percentage? A property-management company in the area should have these aggregated.
- How much new for-sale + rental construction is in the pipeline within 1–3 miles? Heavy new supply typically softens prices + rents 12–24 months out; constrained supply supports both.
Investment metrics
- 1% rule
- 5.97% ✓
- Cap rate
- 55.38%
- Cash-on-cash
- 175.31%
- DSCR
- 8.80
- GRM
- 1.4
CMA / ARV
- ARV (on-the-fly)
- $98,000
- Comps found
- 4
Show comp detail 4 sales within ~0.75 mi
| Address | Dist | Beds/Ba | Sqft | Sold | Price | $/sf | Match |
|---|---|---|---|---|---|---|---|
| 4723 Sherwood St | 0.15mi | 3/1.0 (-1) | 950 (-5%) | 2mo | $59,900 | $63 | 77 |
| 4743 Shelley St | 0.20mi | 3/1.5 (-1) | 1,020 (+2%) | 17mo | $75,000 | $74 | 66 |
| 4721 Hollywood St | 0.64mi | 3/1.0 (-1) | 1,138 (+14%) | 2mo | $129,900 | $114 | 41 |
| 3535 Mission Dr | 0.68mi | 3/2.0 (-1) | 1,120 (+12%) | 21mo | $109,900 | $98 | 22 |
Match score weights: distance 35% · size 25% · config 20% · recency 20%. Top-matched comps best support the ARV.
Projected returns pro-forma
-3.0% appreciation · 0.0% rent growth · sell at horizon
- IRR
- 78.0%
- Equity multiple
- 4.27×
- Total profit
- $18,246
- Equity at exit
- $2,967
- IRR
- 80.2%
- Equity multiple
- 7.34×
- Total profit
- $35,323
- Equity at exit
- $1,721
Cash invested: $5,572 (down + closing). Projections, not guarantees.
Landlord ↔ Tenant lean methodology
- Overall (STATE)
- 90 Strongly Landlord-Friendly
- State Louisiana
- 90 Strongly Landlord-Friendly · R+12
- County
- — inherits STATE
- City
- — inherits STATE
ZIP-level market 70805
- Rents YoY
- -1.2%
- Active inventory
- 155
- Price-to-rent
- 1.4×
Monthly cashflow live
- Estimated rent
- $1,187 high interval (Pro) →
- Mortgage (P&I)
- −$104
- Tax from tax record
- −$11 /mo · $136/yr
- Insurance
- −$8
- Flood insurance flood zone
- −$427 /mo · $5,118/yr
- HOA
- −$0
- Vacancy / Maint / Mgmt
- −$249
- Net cashflow
- $387
Break-even live
Sensitivity live
| Price | -10% $399 | -5% $393 | +0% $387 | +5% $382 | +10% $376 |
|---|---|---|---|---|---|
| Rent | -10% $294 | -5% $341 | +0% $387 | +5% $434 | +10% $481 |
| Rate | -1.0pp $398 | -0.5pp $393 | base $387 | +0.5pp $382 | +1.0pp $377 |
UW: 25.0% down · 7.5% · 30yr · 1.5% tax · 5.0% vac · 8.0% maint · 8.0% mgmt
Financing live
Cash to close
- Down payment
- $4,975
- Closing costs
- $597
- Reserves months
- —
- Total cash needed
- —
Loan-product check · same deal, 3 products live
Conventional
25% down · 7.5% · 30yr
- Down + closing
- —
- Monthly P&I
- —
- Monthly cashflow
- —
- DSCR
- —
- Eligible?
- —
Personal DTI + credit; lowest rate.
DSCR
20% down · 8.5% · 30yr
- Down + closing
- —
- Monthly P&I
- —
- Monthly cashflow
- —
- DSCR
- —
- Eligible?
- —
No personal income docs; deal must DSCR.
Hard money
10% down · 12.0% · 12mo
- Down + closing
- —
- Monthly P&I
- —
- Monthly cashflow
- —
- DSCR
- —
- Eligible?
- —
Short-term bridge; refi at stabilization.
Rent comps 11 comps
| Address | Beds | Baths | Sqft | Rent | $/sqft | DOM | Units | Dist |
|---|---|---|---|---|---|---|---|---|
| 5350 Clayton Dr Baton Rouge, LA | 3.0 | 1.0 | 1050 | $850 | $0.81 | 44d | 1 | 0.50mi |
| 3647 Mission Dr Baton Rouge, LA | 3.0 | 1.0 | 900 | $895 | $0.99 | 24d | 1 | 0.61mi |
| 5540 Clayton Ct Baton Rouge, LA | 4.0 | 2.0 | 1500 | $1,350 | $0.90 | 19d | 1 | 0.64mi |
| 5423 Banyan Trace Dr Baton Rouge, LA | 4.0 | 2.0 | 1469 | $1,300 | $0.88 | 24d | 1 | 0.70mi |
| 5553 Banyan Ct Baton Rouge, LA | 4.0 | 2.0 | 1459 | $1,350 | $0.93 | 24d | 1 | 0.74mi |
| 5315 McClelland Dr Baton Rouge, LA | 3.0 | 2.0 | 1369 | $1,000 | $0.73 | 24d | 1 | 0.75mi |
| 4963 Greenwell St Baton Rouge, LA | 3.0 | 2.0 | 1400 | $1,500 | $1.07 | 24d | 1 | 0.80mi |
| 3567 Charles St Baton Rouge, LA | 3.0 | 1.0 | 1400 | $1,250 | $0.89 | 44d | 1 | 0.84mi |
| 5665 McClelland Dr Apt 220 Baton Rouge, LA | 3.0 | 1.5 | 870 | $950 | $1.09 | 14d | 1 | 0.89mi |
| 5665 McClelland Dr Apt 201 Baton Rouge, LA | 3.0 | 1.5 | 870 | $1,050 | $1.21 | 44d | 1 | 0.89mi |
| 4378 Dawson Dr Baton Rouge, LA | 4.0 | 2.0 | 1400 | $1,600 | $1.14 | 44d | 1 | 1.08mi |
Listing history 8 events
-
2026-04-27status Pending 445-char remark
Show marketing remark (445 chars)
INVESTORS WELCOME , NO WAITING PERIODS , SOLD AS IS WHERE IS , NO UTLIITES WILL BE TURNED ON BUYER TO ACCEPT THE HOME IN ITS AS IS CONDITION SELLER WILL NOT PAY CC AND OR NO ALLOWANCES . LOTS OF POTENTIAL AND INVESTORS ARE WELCOME .LOOKING FOR A 4 BEDROOM INVESTMENT THIS ONE MAY BE THE HOME YOU ARE LOOKING FOR . ENJOY THE OPEN KITCHEN WITH LOTS OF CABINET SPACE AND A SPACIOUS BATHROOM . LOW MAINTENCE FLOORING THIS ONE IS A INVESTOR SPECIAL .
-
2026-04-27status Pending
Show marketing remark (445 chars)
INVESTORS WELCOME , NO WAITING PERIODS , SOLD AS IS WHERE IS , NO UTLIITES WILL BE TURNED ON BUYER TO ACCEPT THE HOME IN ITS AS IS CONDITION SELLER WILL NOT PAY CC AND OR NO ALLOWANCES . LOTS OF POTENTIAL AND INVESTORS ARE WELCOME .LOOKING FOR A 4 BEDROOM INVESTMENT THIS ONE MAY BE THE HOME YOU ARE LOOKING FOR . ENJOY THE OPEN KITCHEN WITH LOTS OF CABINET SPACE AND A SPACIOUS BATHROOM . LOW MAINTENCE FLOORING THIS ONE IS A INVESTOR SPECIAL .
-
2026-04-16$19,900 Active
Show marketing remark (445 chars)
INVESTORS WELCOME , NO WAITING PERIODS , SOLD AS IS WHERE IS , NO UTLIITES WILL BE TURNED ON BUYER TO ACCEPT THE HOME IN ITS AS IS CONDITION SELLER WILL NOT PAY CC AND OR NO ALLOWANCES . LOTS OF POTENTIAL AND INVESTORS ARE WELCOME .LOOKING FOR A 4 BEDROOM INVESTMENT THIS ONE MAY BE THE HOME YOU ARE LOOKING FOR . ENJOY THE OPEN KITCHEN WITH LOTS OF CABINET SPACE AND A SPACIOUS BATHROOM . LOW MAINTENCE FLOORING THIS ONE IS A INVESTOR SPECIAL .
-
2026-04-16$19,900 Active 445-char remark
Show marketing remark (445 chars)
INVESTORS WELCOME , NO WAITING PERIODS , SOLD AS IS WHERE IS , NO UTLIITES WILL BE TURNED ON BUYER TO ACCEPT THE HOME IN ITS AS IS CONDITION SELLER WILL NOT PAY CC AND OR NO ALLOWANCES . LOTS OF POTENTIAL AND INVESTORS ARE WELCOME .LOOKING FOR A 4 BEDROOM INVESTMENT THIS ONE MAY BE THE HOME YOU ARE LOOKING FOR . ENJOY THE OPEN KITCHEN WITH LOTS OF CABINET SPACE AND A SPACIOUS BATHROOM . LOW MAINTENCE FLOORING THIS ONE IS A INVESTOR SPECIAL .
-
2024-02-07historical
-
2023-11-07status Pending
-
2023-10-21$55,000 Active
-
2023-10-21$55,000
ⓘ Source: listings_history table (triggers on properties + properties_extension) + one-shot
backfill from property_details.listing_events for pre-trigger history.
Tax reassessment forecast LA · Resets to sale price
- Current annual tax
- $136 · $11/mo
- Projected year-2 tax
- $136 · $11/mo
- Expected delta
- $0/yr ($0/mo · 0.0%)
ⓘ Screening estimate from a state-policy table — verify with the county assessor before closing.
Climate risk First Street
- Flood 6/10 Major FEMA zone AE · 74% chance over 30 yrs
- Wildfire 1/10 Low
- Heat 8/10 Severe 7 d/yr ≥108°F today · 19 d/yr by 30 yrs out
- Wind 9/10 Extreme 99% chance of damaging wind over 30 yrs
- Air quality 3/10 Moderate 3 unhealthy d/yr today · 4 by 30 yrs out
Nearby sold comps map
Loading sold comps map…
Walkable amenities ~0.75 mi
Loading nearby amenities…
Taxation est. · year 1
- Rental income
- $14,248
- − Mortgage interest
- −$1,115
- − Property taxes
- −$136
- − Insurance
- −$5,218
- − Repairs & maintenance
- −$1,140
- − Management
- −$1,140
- − Depreciation
- −$579
- Taxable income
- $4,921
- Est. tax owed @ 24.0%
- −$1,181
- After-tax cash flow
- $3,469/yr
For passive investors: Depreciation is non-cash, so a rental often shows a tax loss while cash-flowing — sheltering income. Rental losses are passive: they offset passive income freely, and up to $25,000/yr can offset ordinary (W-2) income if you actively participate and your MAGI is under $100k (phasing out to $0 by $150k); unused losses carry forward. On sale, claimed depreciation is recaptured at up to 25%, and gains may owe capital-gains tax (a 1031 exchange can defer both). Figures are a year-1 estimate at your 24.0% rate — not tax advice; consult a CPA.
Schools (NCES district)
- District
- East Baton Rouge Parish
- NCES district ID
- 2200540
- Math proficiency
- 22% ▼ -36.00%
- Reading proficiency
- 34% ▼ -31.00%
- Median HH income
- $46,263
- Composite
- 24.14/100
- National rank
- #7745
- State rank
- #47 of 98 in LA
Livability — Baton Rouge
- Score
- 74/100
- State rank
- #24
- US rank
- #4535
Category grades
Schools grade is shown separately in the Schools card above.
Census & demographics
- Census place
- Baton Rouge, LA
- County
- East Baton Rouge Parish · 399,686 people
- City population
- 351,868
- Metro
- Baton Rouge, LA
- Population (ZIP)
- 23,288
- Household income
- $25,397
- Rent vs Own
- Severe rent burden
- 1980.0
Population outlook (East Baton Rouge County) Hauer SSP2
- Today (2025)
- 464,810 people
- By 2030
- 472,137 · +1.6%
- By 2040
- 480,243 · +3.3%
- By 2050
- 484,422 · +4.2%
- By 2075
- 492,069 · +5.9%
- By 2100
- 476,347 · +2.5%
Race, ethnicity, and origin ACS 2023
- Neighborhood character
- Predominantly Black (95%)
- Race & ethnicity
- Black 95% Hispanic / Latino 2% White 2% Two or more races 1%
- Common ancestry
- Lithuanian 1%
- Foreign-born
- 1% · Canada
- Languages at home
- 98% English-only · Spanish 1%
Political lean MEDSL · East Baton Rouge
- 2024 margin
- D (+11.1) · D 54.5% · R 43.4% · Other 2.1%
- 2008→2024 swing
- +8.9pp toward D · 2008: 2.2pp · 2024: 11.1pp
- All cycles
- 2024: D+11.1 2020: D+13.1 2016: D+9.2 2012: D+5.2 2008: D+2.2
Not yet ingested
- Civics
- —
Market trends
- HPI YoY
- ▼ -110.79%
- Current HPI
- 75.7121
- Rent YoY
- ▼ -1.21%
- Metro
- Baton Rouge, LA
- State GDP YoY
- ▲ 3.29%
- F500 in state
- 10
Industry mix (Fortune 500 HQ in LA)
| Industry | F500 HQs | Revenue |
|---|---|---|
| Telecommunications | 2 | $23B |
|
||
| Utilities | 1 | $12B |
|
||
| Wholesale / Distribution | 1 | $5B |
|
||
| Advertising | 1 | $2B |
|
||
Price history
-63.8% since first listed8 events — show timeline
- 2026-04-27 Pending — AcadianaMLS
- 2026-04-27 Pending — GBRMLS
- 2026-04-16 Listed $19,900 GBRMLS
- 2026-04-16 Listed $19,900 AcadianaMLS
- 2024-02-07 Delisted — GBRMLS
- 2023-11-07 Pending — GBRMLS
- 2023-10-21 Listed $55,000 AcadianaMLS
- 2023-10-21 Listed $55,000 GBRMLS
Property tax history
+2.2%/yrLatest (2025): $136 · +4.6% YoY. Source: county tax records.
Cash-flow waterfall
monthlySold comps — $/sqft
last 12 mo · ≤1 miLoading sold comps…