3324 W 19th Ave Unit 101 Ave #101 · Kennewick, WA
Flood risk 1/10 · Minimal
- FEMA flood zone
- —
- Chance of flooding over 30 yrs
- 0.0%
- Est. flood insurance / yr
- —
Fire risk 4/10 · Minor
- Est. fire insurance / yr
- $604 – $1,122
Heat risk 4/10 · Minor
- Hot days now (above 99°F)
- 6 days/yr
- Hot days in 30 yrs
- 13 days/yr
Wind risk 1/10 · Minimal
- Chance of severe wind over 30 yrs
- —
Air-quality risk 8/10 · Major
- Unhealthy air days now
- 14 days/yr
- Unhealthy air days in 30 yrs
- 15 days/yr
Risk factors via First Street. Map © Google.
Why this score? — see what drove the B grade
The composite is a weighted blend of 9 inputs, each scored 0–100. Each bar is that input's sub-score; the figure is the points it added to the 100-point composite (weight × sub-score).
- Cash flow +30.0/30.0
- 1% rule +10.0/10.0
- DSCR +10.0/10.0
- ARV discount +7.5/15.0
- Schools +4.6/10.0
- Livability +3.9/5.0
- Rent growth +2.5/5.0
- Condition / age +2.5/5.0
- Appreciation +0.0/10.0
$125,000
🖨 Deal sheet 📄 Offer letter ✓ Due diligence
Listing remarks
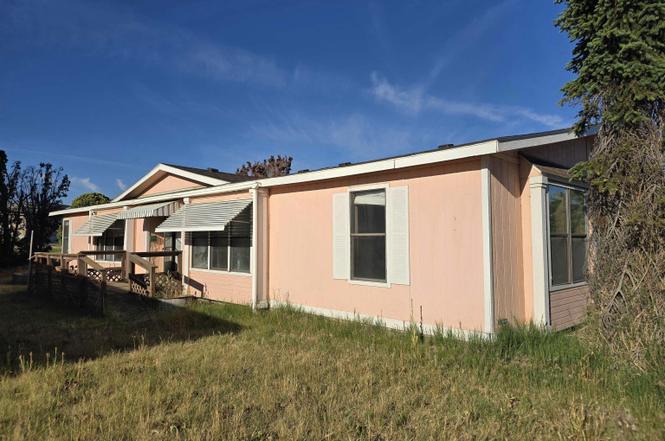
Welcome to this spacious 1,848 sq. ft. manufactured home (1990 Nashua Castlewood, 28x66) situated in the desirable Sun Meadows Manufactured Home Park! This single-story home offers generous living space with excellent potential for personalization and comfortable family living. Step inside to find a functional layout ideal for everyday living and entertaining. The home features heat pump heating and cooling for year-round comfort. Enjoy the benefits of single-level living with ample room for bedrooms, baths, and living areas.
Key facts
- Community pool
- Built 1990
Property features AI
Exterior
- Parking: Carport
- Utilities: Public water; Electric on property; Electricity connected; Sewer connected
- Home design: Manufactured home (double wide); One-level single-story; New construction; Manufactured on a rented lot
- Construction: Composition roof; Block and concrete perimeter foundation; Built as a Nashua Castlewood 28 x 66 double wide
- Exterior features: Community pool; Shed(s); Paved road access
Interior
- Kitchen: Dishwasher; Range; Oven
- Bedrooms: Primary suite located on the main level
- Flooring: Carpet; Vinyl
- Bathrooms: 2 full bathrooms
- Heating & cooling: Central air conditioning (electric); Electric forced-air heating
- Interior features: Walk-in closets; Laminate countertops; Vaulted ceilings; Primary bedroom on main level; Window coverings
- Laundry & utility: Dedicated laundry room
Neighborhood map
What this means for you Summary
Snapshot
- This is a 3-bed/2.0-bath manufactured listed at $125k.
Deal economics
- At list price, monthly cash flow is $1k ($12k/yr) — positive.
- The deal already cash-flows at list — no discount required.
- Meets the 1% rule at list price ($2k rent vs $125k).
- Cap rate 16.2% vs local median 3.3% in Kennewick — top-decile yield for the area; either an underpriced asset or a hidden risk that comps aren't pricing in. Stress-test before assuming the spread holds.
Location & tenants
- Location reads 78/100 on livability (#131 in WA, #2,599 nationally) — a middle-class / working-renter tenant base. Strengths: commute A+, housing A+, health & safety A; Watch: schools D+, amenities D+, crime F.
- Kennewick School District (urban): math 43% / reading 58% proficiency, ranked #141 of 291 in WA (top 48%) — acceptable for families but not a draw, mixed tenant base, ~2y average lease.
- Market conditions: 309 active listings in the ZIP; 16 comparable units currently listed for rent nearby; rentals lingering (median 44d on market — plan ~5-8 weeks vacancy on turnover, expect pricing pressure); 62% of comp listings sitting > 30 days — soft ceiling on asking rent; high-income renter base; 1,532 units permitted in Benton County in 2024 (389 in 5+ unit buildings).
Forward outlook
- Local home prices are declining (-3.0%/yr); year-one equity from $864 of loan paydown is wiped out by about $4k of value loss. Plan a longer hold.
- Benton County population projected at +32% by 2050 — long-run rental-demand tailwind backs the buy-and-hold thesis.
- At projected returns (-3.0% appreciation + 3.0% rent growth), your $35k cash investment doubles in ~4 years — after that, you're playing with house money.
Negotiation context
- Only 1 days on market — expect competitive offers; lowballing is unlikely to land.
Questions for the listing agent
- Is there a deadline driving the sale (1031 exchange, divorce, estate, relocation)? That informs how much negotiation room exists.
- Schools are D-rated, which usually means shorter tenancies and higher turnover. Who's the typical renter profile here, and what's been the actual vacancy rate?
- Crime grade is F in this area — have there been break-ins, vandalism, or insurance claims at this property in the last 3 years? What carrier currently insures it and at what premium?
- What's the average days-on-market for RENTAL listings here right now (not sales)? A rising rental-DOM trend means longer vacancies and softer asking-rent achievability than the comps imply.
- What's the recent tenant-quality profile in this submarket — average credit score on applications, eviction rate, late-payment / NSF rate, and stable-employment percentage? A property-management company in the area should have these aggregated.
- How much new for-sale + rental construction is in the pipeline within 1–3 miles? Heavy new supply typically softens prices + rents 12–24 months out; constrained supply supports both.
Investment metrics
- 1% rule
- 1.80% ✓
- Cap rate
- 16.15%
- Cash-on-cash
- 35.21%
- DSCR
- 2.57
- GRM
- 4.6
CMA / ARV
- ARV (on-the-fly)
- $347,424
- Comps found
- 12
Show comp detail 12 sales within ~0.75 mi
| Address | Dist | Beds/Ba | Sqft | Sold | Price | $/sf | Match |
|---|---|---|---|---|---|---|---|
| 3324 W 19th Ave | 0.06mi | 3/2.0 | 1,608 (-13%) | 2mo | $125,000 | $78 | 74 |
| 1622 S Dennis Pl | 0.39mi | 3/2.0 | 1,885 (+2%) | 6mo | $355,000 | $188 | 74 |
| 3324 W 19th Ave #14 | 0.17mi | 3/2.0 | 2,040 (+10%) | 2mo | $140,000 | $69 | 73 |
| 2210 S Ledbetter St | 0.36mi | 3/2.0 | 1,782 (-4%) | 10mo | $220,000 | $123 | 69 |
| 3201 W 21st Ave | 0.36mi | 3/2.0 | 1,776 (-4%) | 14mo | $303,500 | $171 | 66 |
| 1716 S Huntington Pl | 0.12mi | 3/2.5 | 1,586 (-14%) | 6mo | $333,000 | $210 | 64 |
| 2701 W 15th Pl | 0.35mi | 3/2.0 | 1,782 (-4%) | 18mo | $350,000 | $196 | 62 |
| 3324 W 19th Ave #87 | 0.10mi | 3/2.0 | 1,620 (-12%) | 16mo | $129,500 | $80 | 62 |
| 2407 S Dennis St | 0.70mi | 3/2.0 | 1,840 (-0%) | 12mo | $357,000 | $194 | 57 |
| 3922 W 12th Ave | 0.47mi | 3/2.0 | 1,602 (-13%) | 3mo | $352,000 | $220 | 53 |
| 1703 S. Dennis St | 0.44mi | 4/2.0 (+1) | 1,782 (-4%) | 20mo | $330,000 | $185 | 52 |
| 2402 S Conway St | 0.70mi | 3/2.0 | 1,716 (-7%) | 10mo | $340,000 | $198 | 47 |
Match score weights: distance 35% · size 25% · config 20% · recency 20%. Top-matched comps best support the ARV.
Projected returns pro-forma
-3.0% appreciation · 3.0% rent growth · sell at horizon
- IRR
- 30.8%
- Equity multiple
- 2.29×
- Total profit
- $45,107
- Equity at exit
- $18,638
- IRR
- 38.0%
- Equity multiple
- 4.52×
- Total profit
- $123,338
- Equity at exit
- $10,808
Cash invested: $35,000 (down + closing). Projections, not guarantees.
Landlord ↔ Tenant lean methodology
- Overall (STATE)
- 28 Tenant-Leaning
- State Washington
- 28 Tenant-Leaning · D+8
- County
- — inherits STATE
- City
- — inherits STATE
ZIP-level market 99338
- Active inventory
- 309
- Price-to-rent
- 4.6×
Monthly cashflow live
- Estimated rent
- $2,246 high interval (Pro) →
- Mortgage (P&I)
- −$656
- Tax from tax record
- −$40 /mo · $478/yr
- Insurance
- −$52
- HOA
- −$0
- Vacancy / Maint / Mgmt
- −$472
- Net cashflow
- $1,027
Break-even live
UW: 25.0% down · 7.5% · 30yr · 1.5% tax · 5.0% vac · 8.0% maint · 8.0% mgmt
Financing live
Cash to close
- Down payment
- $31,250
- Closing costs
- $3,750
- Reserves months
- —
- Total cash needed
- —
Loan-product check · same deal, 3 products live
Conventional
25% down · 7.5% · 30yr
- Down + closing
- —
- Monthly P&I
- —
- Monthly cashflow
- —
- DSCR
- —
- Eligible?
- —
Personal DTI + credit; lowest rate.
DSCR
20% down · 8.5% · 30yr
- Down + closing
- —
- Monthly P&I
- —
- Monthly cashflow
- —
- DSCR
- —
- Eligible?
- —
No personal income docs; deal must DSCR.
Hard money
10% down · 12.0% · 12mo
- Down + closing
- —
- Monthly P&I
- —
- Monthly cashflow
- —
- DSCR
- —
- Eligible?
- —
Short-term bridge; refi at stabilization.
Rent comps 16 comps
| Address | Beds | Baths | Sqft | Rent | $/sqft | DOM | Units | Dist |
|---|---|---|---|---|---|---|---|---|
| 1915 S Neel St Kennewick, WA | 3.0 | 2.0 | 1401 | $3,000 | $2.14 | 13d | 1 | 0.41mi |
| 3119 W 7th Ave Unit C120 Kennewick, WA | 3.0 | 2.5 | 1500 | $2,050 | $1.37 | 21d | 1 | 0.56mi |
| 3119 W 7th Ave Kennewick, WA | 3.0 | 2.5 | 1500 | $2,050 | $1.37 | 13d | 1 | 0.56mi |
| 3426 W 7th Ave Unit D Kennewick, WA | 3.0 | 2.0 | 1517 | $2,000 | $1.32 | 44d | 1 | 0.63mi |
| 3887 W 7th Ave Unit B-230 Kennewick, WA | 3.0 | 2.0 | 1262 | $1,850 | $1.47 | 21d | 1 | 0.68mi |
| 1601 S Yelm St Kennewick, WA | 4.0 | 2.0 | 1550 | $2,495 | $1.61 | 21d | 1 | 0.72mi |
| 1163 S Underwood Pl #110 Kennewick, WA | 3.0 | 2.5 | 1478 | $2,395 | $1.62 | 43d | 1 | 0.91mi |
| 717 S Union St Kennewick, WA | 3.0 | 1.0 | 1340 | $1,895 | $1.41 | 43d | 1 | 0.92mi |
| 722 S Union St Kennewick, WA | 4.0 | 2.0 | 2181 | $2,295 | $1.05 | 43d | 1 | 0.93mi |
| 1913 S Rainier St Unit 110 Kennewick, WA | 3.0 | 2.5 | 1800 | $2,000 | $1.11 | 43d | 1 | 1.08mi |
| 4215 W 2nd Ave Kennewick, WA | 3.0 | 2.0 | 1348 | $2,595 | $1.93 | 43d | 1 | 1.16mi |
| 3910 W Kennewick Ave Unit 3910 Kennewick, WA | 3.0 | 1.5 | 1645 | $1,800 | $1.09 | 43d | 1 | 1.19mi |
| 108 S Tweedt Pl Kennewick, WA | 2.0 | 2.0 | 1258 | $1,795 | $1.43 | 43d | 1 | 1.23mi |
| 1707 W 6th Ave Unit A101 Kennewick, WA | 4.0 | 2.0 | 2244 | $2,150 | $0.96 | 43d | 1 | 1.26mi |
| 1701 W 30th Ave Kennewick, WA | 3.0 | 2.0 | 1500 | $2,195 | $1.46 | 13d | 1 | 1.43mi |
| 3064 S Dawes Pl Kennewick, WA | 4.0 | 2.5 | 2088 | $2,595 | $1.24 | 43d | 1 | 1.47mi |
Listing history 2 events
-
2026-06-18remarks 531-char remark
-
2026-06-18$125,000 Active 1 DOM
ⓘ Source: listings_history table (triggers on properties + properties_extension) + one-shot
backfill from property_details.listing_events for pre-trigger history.
Tax reassessment forecast WA · Resets to sale price
- Current annual tax
- $478 · $40/mo
- Projected year-2 tax
- $1,225 · $102/mo
- Expected delta
- +$747/yr (+$62/mo · 156.1%)
ⓘ Screening estimate from a state-policy table — verify with the county assessor before closing.
Climate risk First Street
- Flood 1/10 Low 0% chance over 30 yrs
- Wildfire 4/10 Moderate
- Heat 4/10 Moderate 6 d/yr ≥99°F today · 13 d/yr by 30 yrs out
- Wind 1/10 Low
- Air quality 8/10 Severe 14 unhealthy d/yr today · 15 by 30 yrs out
Nearby sold comps map
Loading sold comps map…
Walkable amenities ~0.75 mi
Loading nearby amenities…
Taxation est. · year 1
- Rental income
- $26,951
- − Mortgage interest
- −$7,002
- − Property taxes
- −$478
- − Insurance
- −$625
- − Repairs & maintenance
- −$2,156
- − Management
- −$2,156
- − Depreciation
- −$3,636
- Taxable income
- $10,897
- Est. tax owed @ 24.0%
- −$2,615
- After-tax cash flow
- $9,707/yr
For passive investors: Depreciation is non-cash, so a rental often shows a tax loss while cash-flowing — sheltering income. Rental losses are passive: they offset passive income freely, and up to $25,000/yr can offset ordinary (W-2) income if you actively participate and your MAGI is under $100k (phasing out to $0 by $150k); unused losses carry forward. On sale, claimed depreciation is recaptured at up to 25%, and gains may owe capital-gains tax (a 1031 exchange can defer both). Figures are a year-1 estimate at your 24.0% rate — not tax advice; consult a CPA.
Schools (NCES district)
- District
- Kennewick School District
- NCES district ID
- 5303930
- Math proficiency
- 43% ▼ -1.00%
- Reading proficiency
- 58% ▬ 0.00%
- Median HH income
- $54,191
- Composite
- 45.56/100
- National rank
- #5667
- State rank
- #141 of 291 in WA
Livability — Kennewick
- Score
- 78/100
- State rank
- #131
- US rank
- #2599
Category grades
Schools grade is shown separately in the Schools card above.
Census & demographics
- Census place
- Kennewick, WA
- County
- Benton County · 186,895 people
- City population
- 104,655
- Metro
- Kennewick-Richland, WA
- Population (ZIP)
- 20,633
- Household income
- $111,042
- Rent vs Own
- Severe rent burden
- 281.0
Population outlook (Benton County) Hauer SSP2
- Today (2025)
- 219,421 people
- By 2030
- 233,813 · +6.6%
- By 2040
- 262,134 · +19.5%
- By 2050
- 290,100 · +32.2%
- By 2075
- 363,525 · +65.7%
- By 2100
- 418,667 · +90.8%
Race, ethnicity, and origin ACS 2023
- Neighborhood character
- Predominantly White (74%)
- Race & ethnicity
- White 74% Hispanic / Latino 16% Two or more races 10% Black 2% Asian 2%
- Hispanic origin (detail)
- Mexican 15%
- Common ancestry
- Portuguese 3% Slovak 3% Iranian 2%
- Foreign-born
- 9% · Canada
- Languages at home
- 83% English-only · Spanish 10% Arabic 2% Other Indo-European 1%
Political lean MEDSL · Benton
- 2024 margin
- Strong R (+21.9) · D 37.7% · R 59.6% · Other 2.7%
- 2008→2024 swing
- +4.2pp toward D · 2008: -26.1pp · 2024: -21.9pp
- All cycles
- 2024: R+21.9 2020: R+21.0 2016: R+26.6 2012: R+27.0 2008: R+26.1
Not yet ingested
- Civics
- —
Market trends
- HPI YoY
- ▼ -167.63%
- Current HPI
- 229.7474
- Rent YoY
- —
- Metro
- Kennewick-Richland, WA
- State GDP YoY
- ▲ 4.65%
- F500 in state
- 22
Industry mix (Fortune 500 HQ in WA)
| Industry | F500 HQs | Revenue |
|---|---|---|
| Retail | 2 | $269B |
|
||
| Technology / Retail | 1 | $638B |
|
||
| Technology | 1 | $245B |
|
||
| Telecommunications | 1 | $38B |
|
||
| Food / Beverage | 1 | $36B |
|
||
| Automotive / Trucks | 1 | $34B |
|
||
Price history
1 event — show timeline
- 2026-06-18 Listed $125,000 PACMLS
Property tax history
-0.7%/yrLatest (2026): $478 · -5.7% YoY. Source: county tax records.
Cash-flow waterfall
monthlySold comps — $/sqft
last 12 mo · ≤1 miLoading sold comps…