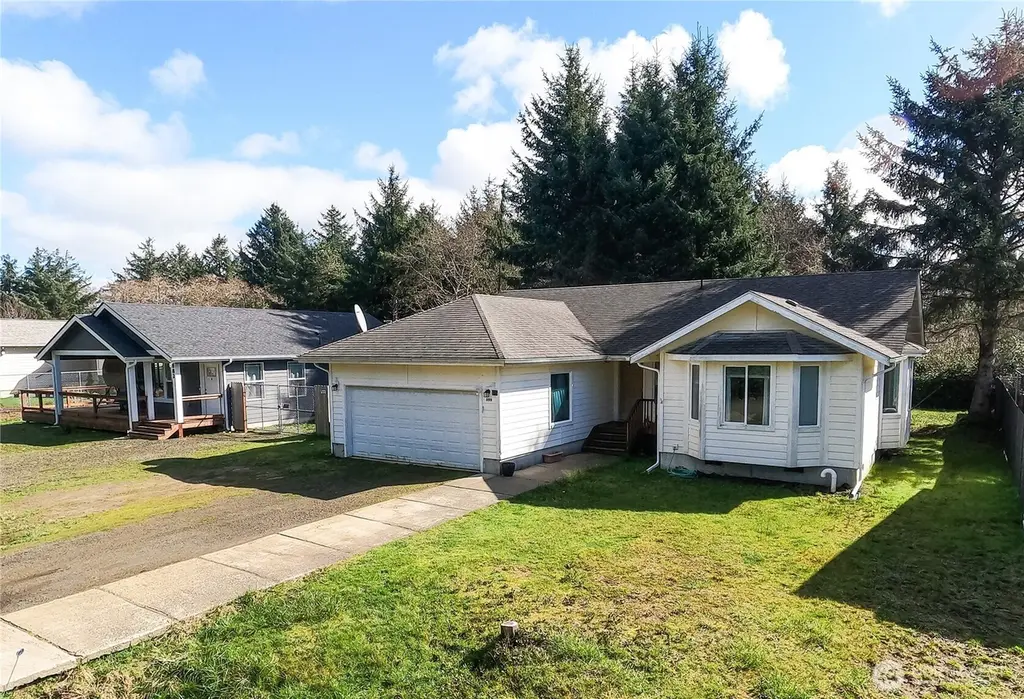
890 Vagabond Ave SW · Ocean Shores, WA
Flood risk 1/10 · Minimal
- FEMA flood zone
- X (unshaded)
- Chance of flooding over 30 yrs
- 0.0%
- Est. flood insurance / yr
- $507 – $1,088
Fire risk 1/10 · Minimal
- Est. fire insurance / yr
- $604 – $1,122
Heat risk 1/10 · Minimal
- Hot days now (above 72°F)
- 7 days/yr
- Hot days in 30 yrs
- 17 days/yr
Wind risk 1/10 · Minimal
- Chance of severe wind over 30 yrs
- —
Air-quality risk 5/10 · Moderate
- Unhealthy air days now
- 6 days/yr
- Unhealthy air days in 30 yrs
- 6 days/yr
Risk factors via First Street. Map © Google.
Why this score? — see what drove the D+ grade
The composite is a weighted blend of 9 inputs, each scored 0–100. Each bar is that input's sub-score; the figure is the points it added to the 100-point composite (weight × sub-score).
- ARV discount +15.0/15.0
- Cash flow +14.6/30.0
- DSCR +4.4/10.0
- 1% rule +3.5/10.0
- Schools +3.4/10.0
- Livability +3.1/5.0
- Rent growth +2.5/5.0
- Condition / age +2.5/5.0
- Appreciation +0.0/10.0
$250,000
🖨 Deal sheet 📄 Offer letter ✓ Due diligence
Listing remarks
A beautiful home in a pristine Ocean Shores neighborhood for a great price! Built in 2009, the house features modern building materials and design, with the major systems in good shape. The home features three bedrooms, two full bathrooms, and an open living area. Additional highlights include vaulted ceilings, bay windows, and a two-car garage. The house is priced below its tax-assessed value due to some deferred cosmetic maintenance. This is a great opportunity to earn some easy equity in your dream beach house.
Key facts
- 7,150 sq ft lot
- Garage
- Built 2009
Neighborhood map
What this means for you Summary
Snapshot
- This is a 3-bed/2.0-bath single-family listed at $250k.
Deal economics
- At list price, monthly cash flow is $58 ($691/yr) — positive.
- The deal already cash-flows at list — no discount required.
- To meet the 1% rule (rent ≥ 1% of price), the offer needs to be $211k (15.4% below list).
- Recommended offer: $211k (15.4% below list) — sets the bar for 1% rule.
- Cap rate 6.6% vs local median 3.1% in Ocean Shores — top-decile yield for the area; either an underpriced asset or a hidden risk that comps aren't pricing in. Stress-test before assuming the spread holds.
Location & tenants
- Location reads 62/100 on livability (#424 in WA) — a middle-class / working-renter tenant base. Strengths: housing A; Watch: schools C-, crime C-, health & safety C-.
- North Beach School District (rural): math 32% / reading 44% proficiency, ranked #236 of 291 in WA (top 81%) — families likely to look elsewhere, expect single-tenant / working-renter base with shorter leases; 63% free/reduced lunch — lower-income household profile, screen leases tightly.
- Market conditions: 653 active listings in the ZIP; 1 comparable units currently listed for rent nearby; 297 units permitted in Grays Harbor County in 2024 (17 in 5+ unit buildings).
- This rent runs 43% of the median local income ($58k/yr) — at the standard rent-burdened threshold; future hikes will face affordability resistance.
Forward outlook
- Local home prices are declining (-3.0%/yr); year-one equity from $2k of loan paydown is wiped out by about $8k of value loss. Plan a longer hold.
- Grays Harbor County population projected at -24% by 2050 — secular population decline; favor cash flow + early exit over multi-decade hold.
Negotiation context
- It's been on market 90 days — a 6% lower offer ($235k) is reasonable based on typical stale-listing flexibility.
- Current owner paid $22k; list at $250k implies a 1039% gain — meaningful room to come down on a strong offer.
Questions for the listing agent
- It's been on market 90 days. Have you received any prior offers? Is the seller open to a 15% concession, seller financing, or rate buy-down credit?
- Why hasn't it sold? Are there any deal-killer items the seller is aware of (foundation, flood, title, zoning, code violations)?
- Is there a deadline driving the sale (1031 exchange, divorce, estate, relocation)? That informs how much negotiation room exists.
- The area grade is low — what's the realistic commute time and amenity access for the typical tenant pool here? Any planned neighborhood developments (good or bad) we should know about?
- What's the average days-on-market for RENTAL listings here right now (not sales)? A rising rental-DOM trend means longer vacancies and softer asking-rent achievability than the comps imply.
- What's the recent tenant-quality profile in this submarket — average credit score on applications, eviction rate, late-payment / NSF rate, and stable-employment percentage? A property-management company in the area should have these aggregated.
- How much new for-sale + rental construction is in the pipeline within 1–3 miles? Heavy new supply typically softens prices + rents 12–24 months out; constrained supply supports both.
Investment metrics
- 1% rule
- 0.85% ✗
- Cap rate
- 6.57%
- Cash-on-cash
- 0.99%
- DSCR
- 1.04
- GRM
- 9.9
CMA / ARV
- ARV (median comp)
- $442,103
- List price
- $250,000
- Delta
- -43.45%
- Verdict
- UNDERPRICED
- Comps
- 20 within 1.0 mi
Show comp detail 12 sales within ~0.75 mi
| Address | Dist | Beds/Ba | Sqft | Sold | Price | $/sf | Match |
|---|---|---|---|---|---|---|---|
| 634 Island Cir SE | 0.30mi | 3/2.0 | 1,495 (+9%) | 0mo | $410,000 | $274 | 71 |
| 265 Oyhut Bay Blvd SW | 0.42mi | 3/0.5 | 1,415 (+3%) | 1mo | $690,000 | $488 | 69 |
| 441 Laurel Ct SW | 0.42mi | 3/2.5 | 1,453 (+6%) | 7mo | $775,581 | $534 | 63 |
| 789 Island Cir SE | 0.29mi | 2/2.0 (-1) | 1,228 (-11%) | 1mo | $405,000 | $330 | 63 |
| 286 Seashore St SW | 0.55mi | 2/2.0 (-1) | 1,335 (-3%) | 2mo | $393,000 | $294 | 63 |
| 646 Island Cir SE | 0.27mi | 2/3.0 (-1) | 1,514 (+10%) | 0mo | $589,000 | $389 | 62 |
| 420 Elderberry Ln SW | 0.43mi | 2/2.5 (-1) | 1,260 (-8%) | 0mo | $527,775 | $419 | 58 |
| 998 Cascade Ave SW | 0.48mi | 3/2.5 | 1,475 (+7%) | 7mo | $465,000 | $315 | 58 |
| 311 Otsego St SW | 0.53mi | 2/2.0 (-1) | 1,464 (+6%) | 5mo | $410,000 | $280 | 55 |
| 1045 Tonquin Ave SW | 0.32mi | 2/2.0 (-1) | 1,200 (-13%) | 4mo | $368,000 | $307 | 55 |
| 193 Marine View Dr SE | 0.62mi | 2/2.0 (-1) | 1,320 (-4%) | 7mo | $641,800 | $486 | 53 |
| 810 Discovery Ave SE | 0.58mi | 3/2.0 | 1,558 (+13%) | 3mo | $285,000 | $183 | 49 |
Match score weights: distance 35% · size 25% · config 20% · recency 20%. Top-matched comps best support the ARV.
Projected returns pro-forma
-3.0% appreciation · 3.0% rent growth · sell at horizon
- IRR
- -14.7%
- Equity multiple
- 0.47×
- Total profit
- $-36,880
- Equity at exit
- $37,276
- IRR
- -6.1%
- Equity multiple
- 0.61×
- Total profit
- $-27,548
- Equity at exit
- $21,615
Cash invested: $70,000 (down + closing). Projections, not guarantees.
Landlord ↔ Tenant lean methodology
- Overall (STATE)
- 28 Tenant-Leaning
- State Washington
- 28 Tenant-Leaning · D+8
- County
- — inherits STATE
- City
- — inherits STATE
ZIP-level market 98569
- Home prices YoY
- -3.4%
- Active inventory
- 653
- Price-to-rent
- 9.9×
Monthly cashflow live
- Estimated rent
- $2,114 medium interval (Pro) →
- Mortgage (P&I)
- −$1,311
- Tax from tax record
- −$197 /mo · $2,368/yr
- Insurance
- −$104
- HOA
- −$0
- Vacancy / Maint / Mgmt
- −$444
- Net cashflow
- $58
Break-even live
UW: 25.0% down · 7.5% · 30yr · 1.5% tax · 5.0% vac · 8.0% maint · 8.0% mgmt
Financing live
Cash to close
- Down payment
- $62,500
- Closing costs
- $7,500
- Reserves months
- —
- Total cash needed
- —
Loan-product check · same deal, 3 products live
Conventional
25% down · 7.5% · 30yr
- Down + closing
- —
- Monthly P&I
- —
- Monthly cashflow
- —
- DSCR
- —
- Eligible?
- —
Personal DTI + credit; lowest rate.
DSCR
20% down · 8.5% · 30yr
- Down + closing
- —
- Monthly P&I
- —
- Monthly cashflow
- —
- DSCR
- —
- Eligible?
- —
No personal income docs; deal must DSCR.
Hard money
10% down · 12.0% · 12mo
- Down + closing
- —
- Monthly P&I
- —
- Monthly cashflow
- —
- DSCR
- —
- Eligible?
- —
Short-term bridge; refi at stabilization.
Rent comps 1 comps
| Address | Beds | Baths | Sqft | Rent | $/sqft | DOM | Units | Dist |
|---|---|---|---|---|---|---|---|---|
| 677 Lake Island Ave SE Ocean Shores, WA | 3.0 | 2.0 | 1352 | $2,600 | $1.92 | 43d | 1 | 0.81mi |
Listing history 19 events
-
2026-06-19days on market $250,000 Active 90 DOM
-
2026-06-18days on market $250,000 Active 89 DOM
-
2026-06-17days on market $250,000 Active 88 DOM
-
2026-06-16days on market $250,000 Active 87 DOM
-
2026-06-15days on market $250,000 Active 86 DOM
-
2026-06-14days on market $250,000 Active 84 DOM
-
2026-06-12pricedays on market $250,000 Active 83 DOM
-
2026-06-09days on market $285,000 Active 80 DOM
-
2026-06-08days on market $285,000 Active 79 DOM
-
2026-06-07days on market $285,000 Active 78 DOM
-
2026-06-05days on market $285,000 Active 75 DOM
-
2026-06-03days on market $285,000 Active 74 DOM
-
2026-06-02days on market $285,000 Active 73 DOM
-
2026-06-01days on market $285,000 Active 72 DOM
-
2026-05-31days on market $285,000 Active 71 DOM
-
2026-05-30days on market $285,000 Active 70 DOM
-
2026-03-21$299,000 Active
-
2007-04-04soldstatus $21,941
-
2005-07-26soldstatus $19,500
ⓘ Source: listings_history table (triggers on properties + properties_extension) + one-shot
backfill from property_details.listing_events for pre-trigger history.
Tax reassessment forecast WA · Resets to sale price
- Current annual tax
- $2,368 · $197/mo
- Projected year-2 tax
- $2,450 · $204/mo
- Expected delta
- +$82/yr (+$7/mo · 3.5%)
ⓘ Screening estimate from a state-policy table — verify with the county assessor before closing.
Climate risk First Street
- Flood 1/10 Low FEMA zone X (unshaded) · 0% chance over 30 yrs
- Wildfire 1/10 Low
- Heat 1/10 Low 7 d/yr ≥72°F today · 17 d/yr by 30 yrs out
- Wind 1/10 Low
- Air quality 5/10 Major 6 unhealthy d/yr today · 6 by 30 yrs out
Nearby sold comps map
Loading sold comps map…
Walkable amenities ~0.75 mi
Loading nearby amenities…
Taxation est. · year 1
- Rental income
- $25,369
- − Mortgage interest
- −$14,004
- − Property taxes
- −$2,368
- − Insurance
- −$1,250
- − Repairs & maintenance
- −$2,030
- − Management
- −$2,030
- − Depreciation
- −$7,273
- Taxable loss
- −$3,584
- Est. tax savings @ 24.0%
- +$860
- After-tax cash flow
- $1,552/yr
For passive investors: Depreciation is non-cash, so a rental often shows a tax loss while cash-flowing — sheltering income. Rental losses are passive: they offset passive income freely, and up to $25,000/yr can offset ordinary (W-2) income if you actively participate and your MAGI is under $100k (phasing out to $0 by $150k); unused losses carry forward. On sale, claimed depreciation is recaptured at up to 25%, and gains may owe capital-gains tax (a 1031 exchange can defer both). Figures are a year-1 estimate at your 24.0% rate — not tax advice; consult a CPA.
Schools (NCES district)
- District
- North Beach School District
- NCES district ID
- 5305700
- Math proficiency
- 32% ▼ -4.00%
- Reading proficiency
- 44% ▬ 0.00%
- Median HH income
- $40,966
- Composite
- 34.46/100
- National rank
- #10153
- State rank
- #236 of 291 in WA
Livability — Ocean Shores
- Score
- 62/100
- State rank
- #424
- US rank
- #16852
Category grades
Schools grade is shown separately in the Schools card above.
Census & demographics
- Census place
- Ocean Shores, WA
- County
- Grays Harbor County · 44,693 people
- City population
- 7,187
- Metro
- Aberdeen, WA
- Population (ZIP)
- 7,489
- Household income
- $58,378
- Rent vs Own
- Severe rent burden
- 172.0
Population outlook (Grays Harbor County) Hauer SSP2
- Today (2025)
- 66,443 people
- By 2030
- 63,255 · -4.8%
- By 2040
- 56,466 · -15.0%
- By 2050
- 50,516 · -24.0%
- By 2075
- 39,296 · -40.9%
- By 2100
- 31,142 · -53.1%
Race, ethnicity, and origin ACS 2023
- Neighborhood character
- Predominantly White (86%)
- Race & ethnicity
- White 86% Two or more races 5% Hispanic / Latino 4% Asian 3% Native American 3%
- Common ancestry
- Portuguese 8% Iranian 5% Lithuanian 4%
- Foreign-born
- 5% · Canada
- Languages at home
- 92% English-only · Spanish 3% Tagalog/Filipino 2% German/W. Germanic 2%
Political lean MEDSL · Grays Harbor
- 2024 margin
- Lean R (+6.0) · D 45.6% · R 51.6% · Other 2.8%
- 2008→2024 swing
- -20.6pp toward R · 2008: 14.6pp · 2024: -6.0pp
- All cycles
- 2024: R+6.0 2020: R+6.6 2016: R+7.1 2012: D+14.0 2008: D+14.6
Not yet ingested
- Civics
- —
Market trends
- HPI YoY
- ▼ -13.33%
- Current HPI
- 380.05
- Rent YoY
- —
- Metro
- Aberdeen, WA
- State GDP YoY
- ▲ 4.65%
- F500 in state
- 22
Industry mix (Fortune 500 HQ in WA)
| Industry | F500 HQs | Revenue |
|---|---|---|
| Retail | 2 | $269B |
|
||
| Technology / Retail | 1 | $638B |
|
||
| Technology | 1 | $245B |
|
||
| Telecommunications | 1 | $38B |
|
||
| Food / Beverage | 1 | $36B |
|
||
| Automotive / Trucks | 1 | $34B |
|
||
Price history
+1433.3% since first listed3 events — show timeline
- 2026-03-21 Listed $299,000 NWMLS as Distributed by MLS Grid
- 2007-04-04 Sold (Public Records) $21,941 Public Records
- 2005-07-26 Sold (Public Records) $19,500 Public Records
Property tax history
+14.7%/yrLatest (2026): $2,368 · -0.8% YoY. Source: county tax records.
Cash-flow waterfall
monthlySold comps — $/sqft
last 12 mo · ≤1 miLoading sold comps…