 🏗️ New Construction
3539 Allison Way · Richland, WA
Flood risk 1/10 · Minimal
- FEMA flood zone
- X
- Chance of flooding over 30 yrs
- 0.0%
- Est. flood insurance / yr
- $507 – $1,088
Fire risk 5/10 · Moderate
- Est. fire insurance / yr
- $604 – $1,122
Heat risk 5/10 · Moderate
- Hot days now (above 98°F)
- 7 days/yr
- Hot days in 30 yrs
- 15 days/yr
Wind risk 1/10 · Minimal
- Chance of severe wind over 30 yrs
- —
Air-quality risk 9/10 · Severe
- Unhealthy air days now
- 13 days/yr
- Unhealthy air days in 30 yrs
- 14 days/yr
Risk factors via First Street. Map © Google.
Why this score? — see what drove the F grade
The composite is a weighted blend of 9 inputs, each scored 0–100. Each bar is that input's sub-score; the figure is the points it added to the 100-point composite (weight × sub-score).
- ARV discount +7.5/15.0
- Appreciation +5.0/10.0
- Schools +4.6/10.0
- Livability +4.0/5.0
- Rent growth +2.5/5.0
- Condition / age +2.5/5.0
- Cash flow +2.3/30.0
- 1% rule +0.0/10.0
- DSCR +0.0/10.0
$565,000
🖨 Deal sheet (PDF) 📄 Offer letter ✓ Due diligence
Listing remarks
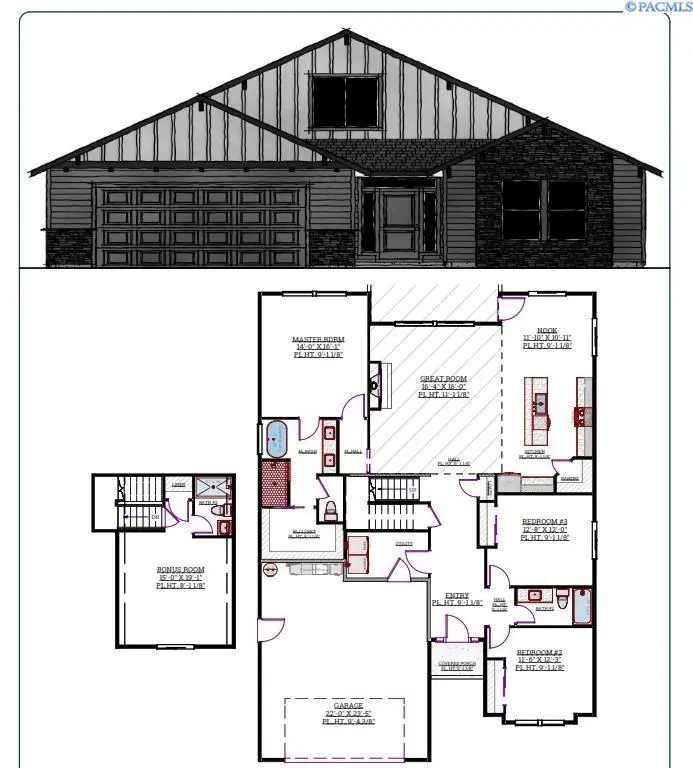
MLS# 292315 Discover this new construction home by Landmark Homes, offering 2,301 sq ft of versatile living space. Designed with flexibility in mind, this home includes 3 bedrooms plus an upstairs bonus room with its own private bathroom—ideal for a guest retreat, second living area, or private workspace. The main level features a well-planned layout that balances openness with defined living spaces, creating a comfortable environment for both daily living and hosting. Thoughtful design and quality finishes carry throughout the home, delivering a clean, modern look. With completion just around the corner, you can enjoy the benefits of a brand-new home without the long wait. Full lands
Key facts
- Well-planned layout
- Upstairs bonus room
- Private bathroom
Tags
Property features AI
Finance
- HOA & community: Homeowners association with $40 monthly fee
Exterior
- Parking: Attached 2-car garage; 2 covered parking spaces (2 total)
- Utilities: Public water; Electric on property / electricity connected; Sewer connected; UGS timed irrigation
- Home design: Single-family residence; Site built on owned lot; Under construction; One story
- Construction: Built by Landmark Homes of Washington; Lap siding and concrete exterior; Composition roof; Concrete perimeter foundation; New construction
- Exterior features: Covered patio/porch; Solar panels; Curbs, sidewalks, and street lights in community
Interior
- Kitchen: Dishwasher; Microwave; Range; Oven
- Bedrooms: Master bedroom located downstairs
- Flooring: Carpet; Vinyl
- Bathrooms: 2 full bathrooms; 1 three-quarter bathroom
- Heating & cooling: Heat pump; Electric cooling; Has heating and cooling
- Interior features: Walk-in closets; Kitchen island; Pantry; Ceiling fans; Master suite on main level; Double-pane windows; Gas fireplace (1)
Neighborhood map
What this means for you Summary
Snapshot
- This is a 4-bed/3.0-bath single-family listed at $565k.
Deal economics
- At list price, monthly cash flow is $-2k ($-30k/yr) — negative.
- To cash-flow at today's rent, offer at most $343k (39.4% below list).
- To meet the 1% rule (rent ≥ 1% of price), the offer needs to be $305k (46.0% below list).
- Recommended offer: $305k (46.0% below list) — sets the bar for 1% rule.
- Cap rate 2.1% vs local median 2.8% in Richland — below-typical yield; the buyer is paying a premium for something (appreciation thesis, condition, location) that the cap rate doesn't capture.
Location & tenants
- Location reads 79/100 on livability (#112 in WA, #2,258 nationally) — a middle-class / working-renter tenant base. Strengths: commute A+, housing A+, health & safety A+; Watch: cost of living C-, amenities F.
- Kennewick School District (urban): math 43% / reading 58% proficiency, ranked #141 of 291 in WA (top 48%) — acceptable for families but not a draw, mixed tenant base, ~2y average lease.
- Zoned schools: Cottonwood Elementary (455 students, 23% FRL); Desert Hills Middle School (889 students, 29% FRL); Kamiakin High School (1,884 students, 43% FRL) — zoned schools average 32% FRL vs 48% district-wide (16 pts lower); this property's tenant base skews higher-income than the district average.
- Market conditions: 1 active listings in the ZIP; 2 comparable units currently listed for rent nearby; 1,532 units permitted in Benton County in 2024 (389 in 5+ unit buildings).
Forward outlook
- In year one you build about $26k of equity ($5k loan paydown + $21k appreciation (3.0% local appreciation)).
- Benton County population projected at +32% by 2050 — long-run rental-demand tailwind backs the buy-and-hold thesis.
- By year 2, paydown + projected appreciation supports a ~$42k cash-out refi (75% LTV) — recoverable capital for the next deal without selling this one.
Negotiation context
- It's been on market 61 days — a 6% lower offer ($531k) is reasonable based on typical stale-listing flexibility.
Risks & watch-outs
- Climate carrying-cost: moderate wildfire risk; extreme-heat days projected 7→15/yr by 2055 (HVAC capex compounding) — expect insurance premiums to compound above CPI over the hold.
Questions for the listing agent
- What do current leases actually rent for vs. the listed asking? Can we see a recent rent roll and the last 12 months of T-12 income?
- It's been on market 61 days. Have you received any prior offers? Is the seller open to a 46% concession, seller financing, or rate buy-down credit?
- What does the HOA fee cover, when was the last increase, and are there any pending special assessments or reserve-fund shortfalls?
- Why hasn't it sold? Are there any deal-killer items the seller is aware of (foundation, flood, title, zoning, code violations)?
- Is there a deadline driving the sale (1031 exchange, divorce, estate, relocation)? That informs how much negotiation room exists.
- Schools are A-rated — typically a magnet for longer-tenancy family renters. What's the average tenant stay here, and is there a school-zone premium baked into asking?
- The area grade is low — what's the realistic commute time and amenity access for the typical tenant pool here? Any planned neighborhood developments (good or bad) we should know about?
- What's the average days-on-market for RENTAL listings here right now (not sales)? A rising rental-DOM trend means longer vacancies and softer asking-rent achievability than the comps imply.
- What's the recent tenant-quality profile in this submarket — average credit score on applications, eviction rate, late-payment / NSF rate, and stable-employment percentage? A property-management company in the area should have these aggregated.
- How much new for-sale + rental construction is in the pipeline within 1–3 miles? Heavy new supply typically softens prices + rents 12–24 months out; constrained supply supports both.
Investment metrics
- 1% rule
- 0.43% ✗
- Cap rate
- 2.05%
- Cash-on-cash
- -15.14%
- DSCR
- 0.33
- GRM
- 19.2
CMA / ARV
- ARV (median comp)
- $701,201
- List price
- $565,000
- Delta
- -19.42%
- Verdict
- UNDERPRICED
- Comps
- 20 within 1.0 mi
Show comp detail 12 sales within ~0.75 mi
| Address | Dist | Beds/Ba | Sqft | Sold | Price | $/sf | Match |
|---|---|---|---|---|---|---|---|
| 3413 Allison Way | 0.00mi | 3/2.0 (-1) | 2,000 (-13%) | 1mo | $730,000 | $365 | 68 |
| 5904 S Toro Rd | 0.56mi | 4/2.5 | 2,328 (+1%) | 4mo | $550,000 | $236 | 67 |
| 2871 Savanna Ave | 0.48mi | 4/2.5 | 2,499 (+9%) | 1mo | $809,000 | $324 | 60 |
| 3610 Morningside Pkwy | 0.72mi | 4/3.0 | 2,228 (-3%) | 2mo | $564,900 | $254 | 60 |
| 7505 S Toro Pl | 0.70mi | 3/3.0 (-1) | 2,304 (+0%) | 6mo | $525,000 | $228 | 57 |
| 10419 Summit View Ct | 0.46mi | 4/3.5 | 2,610 (+13%) | 9mo | $785,000 | $301 | 47 |
| 2883 Savanna Ave | 0.50mi | 4/3.5 | 2,615 (+14%) | 6mo | $875,000 | $335 | 47 |
| 3587 Morningside Pkwy | 0.70mi | 3/2.5 (-1) | 2,463 (+7%) | 4mo | $634,000 | $257 | 46 |
| 11504 S Bermuda Rd | 0.66mi | 3/2.0 (-1) | 2,500 (+9%) | 1mo | $705,000 | $282 | 45 |
| 10414 S 952 Pr Pr SE | 0.67mi | 3/3.0 (-1) | 2,592 (+13%) | 8mo | $730,000 | $282 | 36 |
| 3628 Morningside Pkwy | 0.74mi | 3/2.5 (-1) | 2,083 (-10%) | 8mo | $558,343 | $268 | 36 |
| 84205 E Sagebrush Rd | 0.68mi | 4/2.5 | 2,640 (+15%) | 12mo | $830,000 | $314 | 32 |
Match score weights: distance 35% · size 25% · config 20% · recency 20%. Top-matched comps best support the ARV.
Projected returns pro-forma
3.0% appreciation · 3.0% rent growth · sell at horizon
- IRR
- -6.4%
- Equity multiple
- 0.63×
- Total profit
- $-73,267
- Equity at exit
- $315,290
- IRR
- -1.3%
- Equity multiple
- 0.80×
- Total profit
- $-39,455
- Equity at exit
- $485,900
Cash invested: $196,336 (down + closing). Projections, not guarantees.
Landlord ↔ Tenant lean methodology
- Overall (STATE)
- 28 Tenant-Leaning
- State Washington
- 28 Tenant-Leaning · D+8
- County
- — inherits STATE
- City
- — inherits STATE
ZIP-level market 99532
- Active inventory
- 1
- Price-to-rent
- 15.4×
Monthly cashflow live
- Estimated rent
- $3,048 medium interval (Pro) →
- Mortgage (P&I)
- −$3,677
- Tax est. 1.5%
- −$877 /mo · $10,518/yr
- Insurance
- −$292
- HOA
- −$40
- Vacancy / Maint / Mgmt
- −$640
- Net cashflow
- $-2,478
Break-even live
Sensitivity live
| Price | -10% $-1,993 | -5% $-2,235 | +0% $-2,478 | +5% $-2,720 | +10% $-2,962 |
|---|---|---|---|---|---|
| Rent | -10% $-2,719 | -5% $-2,598 | +0% $-2,478 | +5% $-2,357 | +10% $-2,237 |
| Rate | -1.0pp $-2,125 | -0.5pp $-2,299 | base $-2,478 | +0.5pp $-2,659 | +1.0pp $-2,844 |
UW: 25.0% down · 7.5% · 30yr · 1.5% tax · 5.0% vac · 8.0% maint · 8.0% mgmt
Financing live
Cash to close
- Down payment
- $175,300
- Closing costs
- $21,036
- Reserves months
- —
- Total cash needed
- —
Loan-product check · same deal, 3 products live
Conventional
25% down · 7.5% · 30yr
- Down + closing
- —
- Monthly P&I
- —
- Monthly cashflow
- —
- DSCR
- —
- Eligible?
- —
Personal DTI + credit; lowest rate.
DSCR
20% down · 8.5% · 30yr
- Down + closing
- —
- Monthly P&I
- —
- Monthly cashflow
- —
- DSCR
- —
- Eligible?
- —
No personal income docs; deal must DSCR.
Hard money
10% down · 12.0% · 12mo
- Down + closing
- —
- Monthly P&I
- —
- Monthly cashflow
- —
- DSCR
- —
- Eligible?
- —
Short-term bridge; refi at stabilization.
Rent comps 2 comps
| Address | Beds | Baths | Sqft | Rent | $/sqft | DOM | Units | Dist |
|---|---|---|---|---|---|---|---|---|
| 2940 Tarragon Ave Richland, WA | 3.0 | 2.0 | 1800 | $2,999 | $1.67 | 15d | 1 | 0.76mi |
| 2932 Tarragon Ave Richland, WA | 3.0 | 2.0 | 1900 | $3,095 | $1.63 | 15d | 1 | 0.76mi |
HOA detail
- Monthly dues
- $40 · $480/yr
Listing history 18 events
-
2026-06-21days on market $565,000 Active 61 DOM
-
2026-06-18days on market $565,000 Active 58 DOM
-
2026-06-17days on market $565,000 Active 57 DOM
-
2026-06-16days on market $565,000 Active 56 DOM
-
2026-06-15days on market $565,000 Active 55 DOM
-
2026-06-14days on market $565,000 Active 53 DOM
-
2026-06-13days on market $565,000 Active 52 DOM
-
2026-06-10days on market $565,000 Active 50 DOM
-
2026-06-09days on market $565,000 Active 49 DOM
-
2026-06-08days on market $565,000 Active 48 DOM
-
2026-06-07days on market $565,000 Active 47 DOM
-
2026-06-05days on market $565,000 Active 44 DOM
-
2026-06-03days on market $565,000 Active 43 DOM
-
2026-06-02days on market $565,000 Active 42 DOM
-
2026-06-01days on market $565,000 Active 41 DOM
-
2026-05-31days on market $565,000 Active 40 DOM
-
2026-05-30days on market $565,000 Active 39 DOM
-
2026-04-21$565,000 Active 874-char remark
ⓘ Source: listings_history table (triggers on properties + properties_extension) + one-shot
backfill from property_details.listing_events for pre-trigger history.
Climate risk First Street
- Flood 1/10 Low FEMA zone X · 0% chance over 30 yrs
- Wildfire 5/10 Major
- Heat 5/10 Major 7 d/yr ≥98°F today · 15 d/yr by 30 yrs out
- Wind 1/10 Low
- Air quality 9/10 Extreme 13 unhealthy d/yr today · 14 by 30 yrs out
Nearby sold comps map
Loading sold comps map…
Walkable amenities ~0.75 mi
Loading nearby amenities…
Taxation est. · year 1
- Rental income
- $36,579
- − Mortgage interest
- −$39,278
- − Property taxes
- −$10,518
- − Insurance
- −$3,506
- − Repairs & maintenance
- −$2,926
- − Management
- −$2,926
- − HOA
- −$480
- − Depreciation
- −$20,399
- Taxable loss
- −$43,454
- Est. tax savings @ 24.0%
- +$10,429
- After-tax cash flow
- $-19,304/yr
For passive investors: Depreciation is non-cash, so a rental often shows a tax loss while cash-flowing — sheltering income. Rental losses are passive: they offset passive income freely, and up to $25,000/yr can offset ordinary (W-2) income if you actively participate and your MAGI is under $100k (phasing out to $0 by $150k); unused losses carry forward. On sale, claimed depreciation is recaptured at up to 25%, and gains may owe capital-gains tax (a 1031 exchange can defer both). Figures are a year-1 estimate at your 24.0% rate — not tax advice; consult a CPA.
Schools (NCES district)
- District
- Kennewick School District
- NCES district ID
- 5303930
- Math proficiency
- 43% ▼ -1.00%
- Reading proficiency
- 58% ▬ 0.00%
- Median HH income
- $54,191
- Composite
- 45.56/100
- National rank
- #5667
- State rank
- #141 of 291 in WA
Livability — Richland
- Score
- 79/100
- State rank
- #112
- US rank
- #2258
Category grades
Schools grade is shown separately in the Schools card above.
Census & demographics
- Census place
- Richland, WA
Population outlook (Benton County) Hauer SSP2
- Today (2025)
- 219,421 people
- By 2030
- 233,813 · +6.6%
- By 2040
- 262,134 · +19.5%
- By 2050
- 290,100 · +32.2%
- By 2075
- 363,525 · +65.7%
- By 2100
- 418,667 · +90.8%
Not yet ingested
- Political lean
- —
- Race & ethnicity
- —
- Common origin
- —
- Civics
- —
Market trends
- HPI YoY
- —
- Current HPI
- —
- Rent YoY
- —
- Metro
- —
- State GDP YoY
- ▲ 4.65%
- F500 in state
- 22
Industry mix (Fortune 500 HQ in WA)
| Industry | F500 HQs | Revenue |
|---|---|---|
| Retail | 2 | $269B |
|
||
| Technology / Retail | 1 | $638B |
|
||
| Technology | 1 | $245B |
|
||
| Telecommunications | 1 | $38B |
|
||
| Food / Beverage | 1 | $36B |
|
||
| Automotive / Trucks | 1 | $34B |
|
||
Price history
1 event — show timeline
- 2026-04-21 Listed $565,000 PACMLS
Cash-flow waterfall
monthlySold comps — $/sqft
last 12 mo · ≤1 miLoading sold comps…