 Multi-family
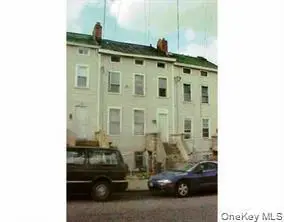
204 Ann St · Newburgh, NY
Flood risk 1/10 · Minimal
- FEMA flood zone
- X (unshaded)
- Chance of flooding over 30 yrs
- 0.0%
- Est. flood insurance / yr
- $473 – $860
Fire risk 3/10 · Minor
- Est. fire insurance / yr
- $691 – $1,283
Heat risk 5/10 · Moderate
- Hot days now (above 100°F)
- 7 days/yr
- Hot days in 30 yrs
- 16 days/yr
Wind risk 4/10 · Minor
- Chance of severe wind over 30 yrs
- 12.0%
Air-quality risk 3/10 · Minor
- Unhealthy air days now
- 2 days/yr
- Unhealthy air days in 30 yrs
- 3 days/yr
Risk factors via First Street. Map © Google.
Why this score? — see what drove the C- grade
The composite is a weighted blend of 9 inputs, each scored 0–100. Each bar is that input's sub-score; the figure is the points it added to the 100-point composite (weight × sub-score).
- Cash flow +18.1/30.0
- ARV discount +13.6/15.0
- DSCR +5.7/10.0
- 1% rule +4.7/10.0
- Schools +3.5/10.0
- Livability +3.1/5.0
- Rent growth +2.7/5.0
- Condition / age +2.5/5.0
- Appreciation +0.0/10.0
$450,000
🖨 Deal sheet (PDF) 📄 Offer letter ✓ Due diligence
Multi-family units
County records classify this as Multi-Family (2-4 Unit). Listing-text estimate: 1 unit. estimate disagrees with records
Listing remarks MLS
Great investment property Fully rented. Close to the stores, Restaurants, Highways and schools. The Gross income is around $32,400.00 but could be more. . Could be sold as a package with the 2 other multi families in the city of Newburgh " MLS #S 965501 AND 961292 located at 202 Ann Street and 86 William St. Newburgh NY and they are all in very good condition with tenants leases month to month.
Key facts
- Close to restaurants
- Close to schools
- Investment property
Tags
Neighborhood map
What this means for you Summary
Snapshot
- This is a 4-bed/2.0-bath multifamily listed at $450k.
Deal economics
- At list price, monthly cash flow is $394 ($5k/yr) — positive.
- The deal already cash-flows at list — no discount required.
- To meet the 1% rule (rent ≥ 1% of price), the offer needs to be $437k (2.8% below list).
- Recommended offer: $410k (9.0% below list) — sets the bar for market timing.
- Cap rate 7.3% vs local median 4.4% in Newburgh — top-decile yield for the area; either an underpriced asset or a hidden risk that comps aren't pricing in. Stress-test before assuming the spread holds.
Location & tenants
- Location reads 62/100 on livability (#878 in NY) — a middle-class / working-renter tenant base. Strengths: health & safety A+, housing B+, cost of living B; Watch: employment D+, schools D, crime F.
- Newburgh City School District (suburban): math 33% / reading 48% proficiency, ranked #500 of 590 in NY (top 85%) — families likely to look elsewhere, expect single-tenant / working-renter base with shorter leases; 61% free/reduced lunch — lower-income household profile, screen leases tightly.
- Market conditions: Rents flat; 384 active listings in the ZIP; 12 comparable units currently listed for rent nearby; rentals lingering (median 45d on market — plan ~5-8 weeks vacancy on turnover, expect pricing pressure); 58% of comp listings sitting > 30 days — soft ceiling on asking rent; solid renter incomes; 1,746 units permitted in Orange County in 2024 (1,265 in 5+ unit buildings).
- At $4,373/mo this rent would consume 61% of the median local household income ($86k/yr) (locally 2412% of renters already pay >50% of income on rent) — very limited rent-growth headroom before tenants either downsize or default.
Forward outlook
- Local home prices are declining (-3.0%/yr); year-one equity from $3k of loan paydown is wiped out by about $14k of value loss. Plan a longer hold.
Negotiation context
- It's been on market 111 days — a 9% lower offer ($410k) is reasonable based on typical stale-listing flexibility.
- 3 sale attempts since 25y ago with the ask held roughly flat each time — persistent listings suggest the price (not the market) is what's stuck; bring a comps-based counter.
- Current owner paid $34k; list at $450k implies a 1224% gain — meaningful room to come down on a strong offer.
Risks & watch-outs
- Watch-outs: built in 1950 — expect roof / HVAC / electrical / plumbing capex.
- Climate carrying-cost: extreme-heat days projected 7→16/yr by 2055 (HVAC capex compounding) — expect insurance premiums to compound above CPI over the hold.
Questions for the listing agent
- It's been on market 111 days. Have you received any prior offers? Is the seller open to a 9% concession, seller financing, or rate buy-down credit?
- Built in 1950 — when were the roof, HVAC, electrical panel, plumbing, and water heater last replaced?
- Why hasn't it sold? Are there any deal-killer items the seller is aware of (foundation, flood, title, zoning, code violations)?
- Is there a deadline driving the sale (1031 exchange, divorce, estate, relocation)? That informs how much negotiation room exists.
- Schools are D-rated, which usually means shorter tenancies and higher turnover. Who's the typical renter profile here, and what's been the actual vacancy rate?
- Crime grade is F in this area — have there been break-ins, vandalism, or insurance claims at this property in the last 3 years? What carrier currently insures it and at what premium?
- What's the average days-on-market for RENTAL listings here right now (not sales)? A rising rental-DOM trend means longer vacancies and softer asking-rent achievability than the comps imply.
- What's the recent tenant-quality profile in this submarket — average credit score on applications, eviction rate, late-payment / NSF rate, and stable-employment percentage? A property-management company in the area should have these aggregated.
- How much new apartment / multifamily construction is in the pipeline within 1–3 miles? Heavy new supply (>2% of stock underway) typically softens rents 12–24 months out; light construction supports rent growth.
Investment metrics
- 1% rule
- 0.97% ✗
- Cap rate
- 7.34%
- Cash-on-cash
- 3.76%
- DSCR
- 1.17
- GRM
- 8.6
CMA / ARV
- ARV (median comp)
- $520,187
- List price
- $450,000
- Delta
- -13.49%
- Verdict
- UNDERPRICED
- Comps
- 20 within 1.0 mi
Show comp detail 3 sales within ~0.75 mi
| Address | Dist | Beds/Ba | Sqft | Sold | Price | $/sf | Match |
|---|---|---|---|---|---|---|---|
| 42 Hasbrouck St | 0.17mi | 4/3.0 | 1,008 (-3%) | 3mo | $305,000 | $303 | 80 |
| 73 S Robinson Ave | 0.31mi | 4/2.0 | 1,000 (-4%) | 10mo | $345,000 | $345 | 71 |
| 28 Hasbrouck St | 0.16mi | 4/3.0 | 1,188 (+14%) | 3mo | $305,000 | $257 | 62 |
Match score weights: distance 35% · size 25% · config 20% · recency 20%. Top-matched comps best support the ARV.
Projected returns pro-forma
-3.0% appreciation · 0.63% rent growth · sell at horizon
- IRR
- -13.1%
- Equity multiple
- 0.54×
- Total profit
- $-57,950
- Equity at exit
- $67,096
- IRR
- -8.2%
- Equity multiple
- 0.54×
- Total profit
- $-57,832
- Equity at exit
- $38,908
Cash invested: $126,000 (down + closing). Projections, not guarantees.
Landlord ↔ Tenant lean methodology
- Overall (STATE)
- 15 Strongly Tenant-Friendly
- State New York
- 15 Strongly Tenant-Friendly · D+10
- County
- — inherits STATE
- City
- — inherits STATE
ZIP-level market 12550
- Home prices YoY
- -33.3%
- Rents YoY
- 0.6%
- Active inventory
- 384
- Price-to-rent
- 25.7×
Monthly cashflow live
- Estimated rent
- $4,373 medium interval (Pro) →
- Mortgage (P&I)
- −$2,360
- Tax from tax record
- −$513 /mo · $6,155/yr
- Insurance
- −$188
- HOA
- −$0
- Vacancy / Maint / Mgmt
- −$918
- Net cashflow
- $394
Break-even live
Sensitivity live
| Price | -10% $649 | -5% $522 | +0% $394 | +5% $267 | +10% $140 |
|---|---|---|---|---|---|
| Rent | -10% $49 | -5% $222 | +0% $394 | +5% $567 | +10% $740 |
| Rate | -1.0pp $621 | -0.5pp $509 | base $394 | +0.5pp $278 | +1.0pp $159 |
3-unit breakdown (identical units grouped — click to expand)
| Units | Beds | Baths | Est. rent |
|---|---|---|---|
| 3× units | 1 | 1 | $4,374 |
| #1 | 1 | 1 | $1,458 |
| #2 | 1 | 1 | $1,458 |
| #3 | 1 | 1 | $1,458 |
| Total (3 units) | $4,373 | ||
UW: 25.0% down · 7.5% · 30yr · 1.5% tax · 5.0% vac · 8.0% maint · 8.0% mgmt
Financing live
Cash to close
- Down payment
- $112,500
- Closing costs
- $13,500
- Reserves months
- —
- Total cash needed
- —
Loan-product check · same deal, 3 products live
Conventional
25% down · 7.5% · 30yr
- Down + closing
- —
- Monthly P&I
- —
- Monthly cashflow
- —
- DSCR
- —
- Eligible?
- —
Personal DTI + credit; lowest rate.
DSCR
20% down · 8.5% · 30yr
- Down + closing
- —
- Monthly P&I
- —
- Monthly cashflow
- —
- DSCR
- —
- Eligible?
- —
No personal income docs; deal must DSCR.
Hard money
10% down · 12.0% · 12mo
- Down + closing
- —
- Monthly P&I
- —
- Monthly cashflow
- —
- DSCR
- —
- Eligible?
- —
Short-term bridge; refi at stabilization.
Rent comps 12 comps
| Address | Beds | Baths | Sqft | Rent | $/sqft | DOM | Units | Dist |
|---|---|---|---|---|---|---|---|---|
| 27 Clark St Newburgh, NY | 3.0 | 1.0 | 785 | $1,950 | $2.48 | 45d | 1 | 0.13mi |
| 28 Hasbrouck St Newburgh, NY | 3.0 | 1.5 | 1188 | $2,700 | $2.27 | 45d | 1 | 0.17mi |
| 42 Hasbrouck St Newburgh, NY | 3.0 | 1.5 | 1008 | $2,550 | $2.53 | 45d | 1 | 0.18mi |
| 259 1st St Newburgh, NY | 3.0 | 2.0 | 883 | $2,000 | $2.27 | 45d | 1 | 0.18mi |
| 52 S Miller St Newburgh, NY | 3.0 | 1.0 | 889 | $1,900 | $2.14 | 45d | 1 | 0.21mi |
| 22 Benkard Ave Unit 1 Newburgh, NY | 3.0 | 1.0 | 1075 | $1,750 | $1.63 | 45d | 1 | 0.40mi |
| 193 South St Unit 2 Newburgh, NY | 3.0 | 1.5 | 1200 | $2,415 | $2.01 | 15d | 1 | 0.50mi |
| 81 Liberty Street Washington Hts Unit 2 Newburgh, NY | 3.0 | 1.0 | 1362 | $2,950 | $2.17 | 45d | 1 | 0.66mi |
| 268 Carpenter Ave Unit 1 Newburgh, NY | 3.0 | 2.0 | 950 | $2,600 | $2.74 | 24d | 1 | 0.73mi |
| 9 Arlington Pl Newburgh, NY | 3.0 | 1.0 | 950 | $2,300 | $2.42 | 15d | 1 | 0.73mi |
| 171 West St Newburgh, NY | 3.0 | 1.5 | 1299 | $2,800 | $2.16 | 24d | 1 | 0.87mi |
| 62 Poplar St Newburgh, NY | 3.0 | 1.5 | 1272 | $3,000 | $2.36 | 24d | 1 | 1.46mi |
Listing history 25 events
-
2026-06-21days on market $450,000 Active 111 DOM
-
2026-06-18days on market $450,000 Active 108 DOM
-
2026-06-17days on market $450,000 Active 107 DOM
-
2026-06-16days on market $450,000 Active 106 DOM
-
2026-06-15days on market $450,000 Active 105 DOM
-
2026-06-14days on market $450,000 Active 103 DOM
-
2026-06-13days on market $450,000 Active 102 DOM
-
2026-06-10days on market $450,000 Active 100 DOM
-
2026-06-09days on market $450,000 Active 99 DOM
-
2026-06-08days on market $450,000 Active 98 DOM
-
2026-06-07days on market $450,000 Active 97 DOM
-
2026-06-03days on market $450,000 Active 93 DOM
-
2026-06-02days on market $450,000 Active 92 DOM
-
2026-06-01days on market $450,000 Active 91 DOM
-
2026-05-31days on market $450,000 Active 90 DOM
-
2026-05-30days on market $450,000 Active 89 DOM
-
2026-03-02$450,000 Active 402-char remark
Show marketing remark (402 chars)
Great investment property Fully rented. Close to the stores, Restaurants, Highways and schools. The Gross income is around $32,400.00 but could be more. . Could be sold as a package with the 2 other multi families in the city of Newburgh " MLS #S 965501 AND 961292 located at 202 Ann Street and 86 William St. Newburgh NY and they are all in very good condition with tenants leases month to month.
-
2017-04-13historical
-
2017-04-05$80,000 Active
-
2002-03-13soldstatus $34,000
-
2002-02-22soldstatus $33,900
-
2002-02-15historical
-
2001-06-06$33,900
-
1996-12-09soldstatus $50,000
-
1996-10-21soldstatus $20,000
ⓘ Source: listings_history table (triggers on properties + properties_extension) + one-shot
backfill from property_details.listing_events for pre-trigger history.
Tax reassessment forecast NY · Partial reset (capped growth)
- Current annual tax
- $6,155 · $513/mo
- Projected year-2 tax
- $6,880 · $573/mo
- Expected delta
- +$725/yr (+$60/mo · 11.8%)
ⓘ Screening estimate from a state-policy table — verify with the county assessor before closing.
Climate risk First Street
- Flood 1/10 Low FEMA zone X (unshaded) · 0% chance over 30 yrs
- Wildfire 3/10 Moderate
- Heat 5/10 Major 7 d/yr ≥100°F today · 16 d/yr by 30 yrs out
- Wind 4/10 Moderate 12% chance of damaging wind over 30 yrs
- Air quality 3/10 Moderate 2 unhealthy d/yr today · 3 by 30 yrs out
Nearby sold comps map
Loading sold comps map…
Walkable amenities ~0.75 mi
Loading nearby amenities…
Taxation est. · year 1
- Rental income
- $52,476
- − Mortgage interest
- −$25,207
- − Property taxes
- −$6,155
- − Insurance
- −$2,250
- − Repairs & maintenance
- −$4,198
- − Management
- −$4,198
- − Depreciation
- −$13,091
- Taxable loss
- −$2,623
- Est. tax savings @ 24.0%
- +$629
- After-tax cash flow
- $5,363/yr
For passive investors: Depreciation is non-cash, so a rental often shows a tax loss while cash-flowing — sheltering income. Rental losses are passive: they offset passive income freely, and up to $25,000/yr can offset ordinary (W-2) income if you actively participate and your MAGI is under $100k (phasing out to $0 by $150k); unused losses carry forward. On sale, claimed depreciation is recaptured at up to 25%, and gains may owe capital-gains tax (a 1031 exchange can defer both). Figures are a year-1 estimate at your 24.0% rate — not tax advice; consult a CPA.
Schools (NCES district)
- District
- Newburgh City School District
- NCES district ID
- 3620700
- Math proficiency
- 33% ▼ -8.00%
- Reading proficiency
- 48% ▲ 10.00%
- Median HH income
- $56,387
- Composite
- 35.46/100
- National rank
- #4927
- State rank
- #500 of 590 in NY
Livability — Newburgh
- Score
- 62/100
- State rank
- #878
- US rank
- #17021
Category grades
Schools grade is shown separately in the Schools card above.
Census & demographics
- Census place
- Newburgh, NY
- County
- Orange County · 267,004 people
- City population
- 55,152
- Metro
- Poughkeepsie-Newburgh-Middletown, NY
- Population (ZIP)
- 55,152
- Household income
- $85,697
- Rent vs Own
- Severe rent burden
- 2412.0
Population outlook (Orange County) Hauer SSP2
- Today (2025)
- 379,830 people
- By 2030
- 378,955 · -0.2%
- By 2040
- 375,444 · -1.2%
- By 2050
- 369,311 · -2.8%
- By 2075
- 354,233 · -6.7%
- By 2100
- 318,150 · -16.2%
Race, ethnicity, and origin ACS 2023
- Neighborhood character
- Diverse neighborhood (Simpson 0.68)
- Race & ethnicity
- Hispanic / Latino 39% White 36% Black 20% Two or more races 12% Asian 2%
- Hispanic origin (detail)
- Mexican 14% Puerto Rican 10% Dominican 2%
- Common ancestry
- Romanian 2% Hispanic 1% Lithuanian 1%
- Foreign-born
- 18% · Canada, Dominican Republic
- Languages at home
- 64% English-only · Spanish 30% French/Haitian/Cajun 1% Other Indo-European 1%
Political lean MEDSL · Orange
- 2024 margin
- Lean R (+8.4) · D 45.8% · R 54.2%
- 2008→2024 swing
- -12.5pp toward R · 2008: 4.1pp · 2024: -8.4pp
- All cycles
- 2024: R+8.4 2020: R+0.2 2016: R+6.5 2012: D+5.2 2008: D+4.1
Not yet ingested
- Civics
- —
Market trends
- HPI YoY
- ▼ -151.93%
- Current HPI
- 304.1046
- Rent YoY
- ▲ 0.63%
- Metro
- Poughkeepsie-Newburgh-Middletown, NY
- State GDP YoY
- ▲ 2.60%
- F500 in state
- 92
Industry mix (Fortune 500 HQ in NY)
| Industry | F500 HQs | Revenue |
|---|---|---|
| Financial Services | 10 | $950B |
|
||
| Consumer Goods | 9 | $162B |
|
||
| Insurance | 4 | $225B |
|
||
| Telecommunications | 2 | $144B |
|
||
| Pharmaceuticals | 2 | $112B |
|
||
| Media / Entertainment | 2 | $69B |
|
||
Price history
+2150.0% since first listed9 events — show timeline
- 2026-03-02 Listed $450,000 OneKey® MLS as Distributed by MLS Grid
- 2017-04-13 Listing Removed — OneKey® MLS as Distributed by MLS Grid
- 2017-04-05 Listed $80,000 OneKey® MLS as Distributed by MLS Grid
- 2002-03-13 Sold (Public Records) $34,000 Public Records
- 2002-02-22 Sold (MLS) $33,900 HGMLS
- 2002-02-15 Delisted — HGMLS
- 2001-06-06 Listed $33,900 HGMLS
- 1996-12-09 Sold (Public Records) $50,000 Public Records
- 1996-10-21 Sold (Public Records) $20,000 Public Records
Property tax history
+2.8%/yrLatest (2025): $6,155 · -1.9% YoY. Source: county tax records.
Cash-flow waterfall
monthlySold comps — $/sqft
last 12 mo · ≤1 miLoading sold comps…