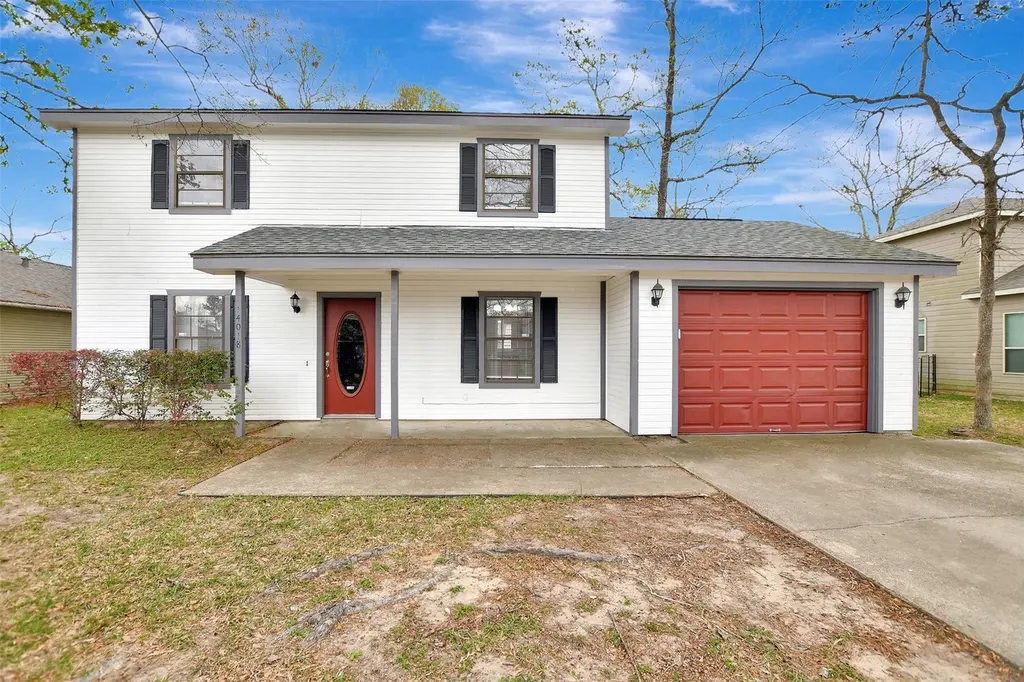
14018 Broken Arrow Dr · Willis, TX
Flood risk 1/10 · Minimal
- FEMA flood zone
- X (unshaded)
- Chance of flooding over 30 yrs
- 0.0%
- Est. flood insurance / yr
- $507 – $1,088
Fire risk 5/10 · Moderate
- Est. fire insurance / yr
- $1,222 – $2,270
Heat risk 8/10 · Major
- Hot days now (above 111°F)
- 7 days/yr
- Hot days in 30 yrs
- 25 days/yr
Wind risk 8/10 · Major
- Chance of severe wind over 30 yrs
- 99.0%
Air-quality risk 2/10 · Minimal
- Unhealthy air days now
- 1 days/yr
- Unhealthy air days in 30 yrs
- 1 days/yr
Risk factors via First Street. Map © Google.
Why this score? — see what drove the C- grade
The composite is a weighted blend of 9 inputs, each scored 0–100. Each bar is that input's sub-score; the figure is the points it added to the 100-point composite (weight × sub-score).
- Cash flow +18.6/30.0
- ARV discount +12.7/15.0
- DSCR +5.8/10.0
- 1% rule +5.1/10.0
- Schools +3.2/10.0
- Livability +3.1/5.0
- Rent growth +2.7/5.0
- Condition / age +2.5/5.0
- Appreciation +0.9/10.0
$185,500
🖨 Deal sheet 📄 Offer letter ✓ Due diligence
Listing remarks MLS
Fannie Mae Homepath property - 2 story home in Indian Forest. 3 bedroom, 2.5 baths, fenced back yard. Good sized living room with fireplace, formal dining area. Just a few minutes from downtown Willis and I45. Shopping and schools nearby.
Key facts
- Stainless appliances
- Storage shed
- Flex room
Tags
Property features AI
Finance
- HOA & community: Association managed by IMC Property Management; Annual association fee of $300
Exterior
- Parking: Attached garage (1 car)
- Utilities: Public water; Public sewer
- Home design: Residential property; Built in 1985; Slab foundation
- Construction: Composition roof; Unknown construction materials
- Exterior features: Back yard fence; Storage; Shed(s)
Interior
- Kitchen: Dishwasher; Electric oven; Electric range; Disposal; Microwave
- Bedrooms: Primary bedroom on second floor (14x11); Bedroom on second floor (14x10); Bedroom on second floor (10x9)
- Flooring: Carpet; Laminate
- Bathrooms: 2 full bathrooms; 1 half bathroom
- Heating & cooling: Central heating (electric); Central air conditioning (electric)
- Interior features: Granite counters; Primary bedroom with private bath; Tub with shower
- Laundry & utility: Washer hookup; Electric dryer hookup
Neighborhood map
What this means for you Summary
Snapshot
- This is a 3-bed/2.5-bath single-family listed at $186k.
Deal economics
- At list price, monthly cash flow is $179 ($2k/yr) — positive.
- The deal already cash-flows at list — no discount required.
- Meets the 1% rule at list price ($2k rent vs $186k).
- Recommended offer: $180k (3.0% below list) — sets the bar for market timing.
- Cap rate 7.5% vs local median 4.7% in Willis — top-decile yield for the area; either an underpriced asset or a hidden risk that comps aren't pricing in. Stress-test before assuming the spread holds.
Location & tenants
- Location reads 62/100 on livability (#933 in TX) — a middle-class / working-renter tenant base. Strengths: cost of living A+, housing A+; Watch: crime C-, employment D+, amenities F.
- Willis ISD (rural): math 33% / reading 40% proficiency, ranked #458 of 826 in TX (top 55%) — families likely to look elsewhere, expect single-tenant / working-renter base with shorter leases.
- Zoned schools: Lynn Lucas Middle (math 23% / reading 32%, grade F, #1,156 of 1,662 statewide, top 71%, 971 students, 74% FRL); Willis H S (math 19% / reading 46%, grade F, #1,029 of 1,632 statewide, top 64%, 2,521 students, 57% FRL).
- Market conditions: Rents flat; 710 active listings in the ZIP; 1 comparable units currently listed for rent nearby; 13,259 units permitted in Montgomery County in 2024 (1,402 in 5+ unit buildings).
- This rent runs 32% of the median local income ($71k/yr) — at the standard rent-burdened threshold; future hikes will face affordability resistance.
Forward outlook
- Local home prices are declining (-3.0%/yr); year-one equity from $1k of loan paydown is wiped out by about $6k of value loss. Plan a longer hold.
- Montgomery County population projected at +65% by 2050 — long-run rental-demand tailwind backs the buy-and-hold thesis.
Negotiation context
- It's been on market 54 days — a 3% lower offer ($180k) is reasonable based on typical stale-listing flexibility.
- 3 sale attempts since 14y ago; this cycle's ask has dropped $14k (7%) from the opening price — seller is motivated, your offer sets the floor, not the list.
- Current owner paid $77k; list at $186k implies a 140% gain — meaningful room to come down on a strong offer.
Risks & watch-outs
- Climate carrying-cost: severe wind risk, 99% chance of damaging wind over 30y; moderate wildfire risk; extreme-heat days projected 7→25/yr by 2055 (HVAC capex compounding) — expect insurance premiums to compound above CPI over the hold.
Questions for the listing agent
- It's been on market 54 days. Have you received any prior offers? Is the seller open to a 3% concession, seller financing, or rate buy-down credit?
- What does the HOA fee cover, when was the last increase, and are there any pending special assessments or reserve-fund shortfalls?
- Is there a deadline driving the sale (1031 exchange, divorce, estate, relocation)? That informs how much negotiation room exists.
- Schools are D-rated, which usually means shorter tenancies and higher turnover. Who's the typical renter profile here, and what's been the actual vacancy rate?
- What's the average days-on-market for RENTAL listings here right now (not sales)? A rising rental-DOM trend means longer vacancies and softer asking-rent achievability than the comps imply.
- What's the recent tenant-quality profile in this submarket — average credit score on applications, eviction rate, late-payment / NSF rate, and stable-employment percentage? A property-management company in the area should have these aggregated.
- How much new for-sale + rental construction is in the pipeline within 1–3 miles? Heavy new supply typically softens prices + rents 12–24 months out; constrained supply supports both.
Investment metrics
- 1% rule
- 1.01% ✓
- Cap rate
- 7.45%
- Cash-on-cash
- 4.15%
- DSCR
- 1.18
- GRM
- 8.2
CMA / ARV
- ARV (on-the-fly)
- $209,484
- Comps found
- 12
Show comp detail 12 sales within ~0.75 mi
| Address | Dist | Beds/Ba | Sqft | Sold | Price | $/sf | Match |
|---|---|---|---|---|---|---|---|
| 14018 Broken Arrow Dr | 0.00mi | 3/2.5 | 1,518 (0%) | 1mo | $185,500 | $122 | 100 |
| 14088 Running Bear Dr | 0.05mi | 3/2.5 | 1,498 (-1%) | 5mo | $209,000 | $140 | 91 |
| 13730 Running Bear Dr | 0.14mi | 3/2.0 | 1,507 (-1%) | 1mo | $225,000 | $149 | 90 |
| 13744 Bighorn Trl | 0.12mi | 3/2.5 | 1,498 (-1%) | 4mo | $200,000 | $134 | 89 |
| 5453 N Buffalo Cir | 0.28mi | 3/2.5 | 1,498 (-1%) | 3mo | $239,000 | $160 | 83 |
| 14105 Broken Arrow Dr | 0.12mi | 3/2.0 | 1,576 (+4%) | 6mo | $169,000 | $107 | 81 |
| 13653 Bighorn Trl | 0.25mi | 3/2.0 | 1,507 (-1%) | 6mo | $210,000 | $139 | 80 |
| 8853 E Buffalo Cir | 0.16mi | 3/2.0 | 1,290 (-15%) | 1mo | $154,000 | $119 | 64 |
| 8962 W Buffalo Cir | 0.26mi | 3/2.0 | 1,330 (-12%) | 6mo | $215,000 | $162 | 60 |
| 5445 N Buffalo Cir | 0.29mi | 4/2.5 (+1) | 1,738 (+14%) | 0mo | $177,500 | $102 | 57 |
| 13604 Bighorn Trl | 0.32mi | 4/2.5 (+1) | 1,738 (+14%) | 1mo | $239,000 | $138 | 55 |
| 13669 Running Bear Dr | 0.28mi | 4/2.5 (+1) | 1,738 (+14%) | 5mo | $225,000 | $129 | 54 |
Match score weights: distance 35% · size 25% · config 20% · recency 20%. Top-matched comps best support the ARV.
Projected returns pro-forma
-3.0% appreciation · 0.98% rent growth · sell at horizon
- IRR
- -12.1%
- Equity multiple
- 0.57×
- Total profit
- $-22,332
- Equity at exit
- $27,659
- IRR
- -6.4%
- Equity multiple
- 0.63×
- Total profit
- $-19,314
- Equity at exit
- $16,039
Cash invested: $51,940 (down + closing). Projections, not guarantees.
Landlord ↔ Tenant lean methodology
- Overall (STATE)
- 87 Strongly Landlord-Friendly
- State Texas
- 87 Strongly Landlord-Friendly · R+5
- County
- — inherits STATE
- City
- — inherits STATE
ZIP-level market 77378
- Home prices YoY
- -3.0%
- Rents YoY
- 1.0%
- Active inventory
- 710
- Price-to-rent
- 8.2×
Monthly cashflow live
- Estimated rent
- $1,880 medium interval (Pro) →
- Mortgage (P&I)
- −$973
- Tax from tax record
- −$231 /mo · $2,771/yr
- Insurance
- −$77
- HOA
- −$25
- Vacancy / Maint / Mgmt
- −$395
- Net cashflow
- $179
Break-even live
UW: 25.0% down · 7.5% · 30yr · 1.5% tax · 5.0% vac · 8.0% maint · 8.0% mgmt
Financing live
Cash to close
- Down payment
- $46,375
- Closing costs
- $5,565
- Reserves months
- —
- Total cash needed
- —
Loan-product check · same deal, 3 products live
Conventional
25% down · 7.5% · 30yr
- Down + closing
- —
- Monthly P&I
- —
- Monthly cashflow
- —
- DSCR
- —
- Eligible?
- —
Personal DTI + credit; lowest rate.
DSCR
20% down · 8.5% · 30yr
- Down + closing
- —
- Monthly P&I
- —
- Monthly cashflow
- —
- DSCR
- —
- Eligible?
- —
No personal income docs; deal must DSCR.
Hard money
10% down · 12.0% · 12mo
- Down + closing
- —
- Monthly P&I
- —
- Monthly cashflow
- —
- DSCR
- —
- Eligible?
- —
Short-term bridge; refi at stabilization.
Rent comps 1 comps
| Address | Beds | Baths | Sqft | Rent | $/sqft | DOM | Units | Dist |
|---|---|---|---|---|---|---|---|---|
| 14107 Running Bear Dr Willis, TX | 4.0 | 2.0 | 1328 | $1,800 | $1.36 | 24d | 1 | 0.12mi |
HOA detail
- Monthly dues
- $25 · $300/yr
Listing history 11 events
-
2026-05-10status Pending
-
2026-05-01status Pending
-
2026-04-14price $185,500
-
2026-03-16$199,900 Active
-
2024-10-16historical $1,495
-
2024-10-07$1,495
-
2012-05-02soldstatus 238-char remark
Show marketing remark (238 chars)
Fannie Mae Homepath property - 2 story home in Indian Forest. 3 bedroom, 2.5 baths, fenced back yard. Good sized living room with fireplace, formal dining area. Just a few minutes from downtown Willis and I45. Shopping and schools nearby.
-
2012-04-20historical 238-char remark
Show marketing remark (238 chars)
Fannie Mae Homepath property - 2 story home in Indian Forest. 3 bedroom, 2.5 baths, fenced back yard. Good sized living room with fireplace, formal dining area. Just a few minutes from downtown Willis and I45. Shopping and schools nearby.
-
2012-02-08$63,900 238-char remark
Show marketing remark (238 chars)
Fannie Mae Homepath property - 2 story home in Indian Forest. 3 bedroom, 2.5 baths, fenced back yard. Good sized living room with fireplace, formal dining area. Just a few minutes from downtown Willis and I45. Shopping and schools nearby.
-
2012-01-10soldstatus $77,353
-
1994-07-22soldstatus $75,810
ⓘ Source: listings_history table (triggers on properties + properties_extension) + one-shot
backfill from property_details.listing_events for pre-trigger history.
Tax reassessment forecast TX · Resets to sale price
- Current annual tax
- $2,771 · $231/mo
- Projected year-2 tax
- $3,395 · $283/mo
- Expected delta
- +$624/yr (+$52/mo · 22.5%)
ⓘ Screening estimate from a state-policy table — verify with the county assessor before closing.
Climate risk First Street
- Flood 1/10 Low FEMA zone X (unshaded) · 0% chance over 30 yrs
- Wildfire 5/10 Major
- Heat 8/10 Severe 7 d/yr ≥111°F today · 25 d/yr by 30 yrs out
- Wind 8/10 Severe 99% chance of damaging wind over 30 yrs
- Air quality 2/10 Low 1 unhealthy d/yr today · 1 by 30 yrs out
Nearby sold comps map
Loading sold comps map…
Walkable amenities ~0.75 mi
Loading nearby amenities…
Taxation est. · year 1
- Rental income
- $22,564
- − Mortgage interest
- −$10,391
- − Property taxes
- −$2,771
- − Insurance
- −$928
- − Repairs & maintenance
- −$1,805
- − Management
- −$1,805
- − HOA
- −$300
- − Depreciation
- −$5,396
- Taxable loss
- −$832
- Est. tax savings @ 24.0%
- +$200
- After-tax cash flow
- $2,353/yr
For passive investors: Depreciation is non-cash, so a rental often shows a tax loss while cash-flowing — sheltering income. Rental losses are passive: they offset passive income freely, and up to $25,000/yr can offset ordinary (W-2) income if you actively participate and your MAGI is under $100k (phasing out to $0 by $150k); unused losses carry forward. On sale, claimed depreciation is recaptured at up to 25%, and gains may owe capital-gains tax (a 1031 exchange can defer both). Figures are a year-1 estimate at your 24.0% rate — not tax advice; consult a CPA.
Schools (NCES district)
- District
- Willis ISD
- NCES district ID
- 4845900
- Math proficiency
- 33% ▼ -15.00%
- Reading proficiency
- 40% ▼ -2.00%
- Median HH income
- $57,828
- Composite
- 32.32/100
- National rank
- #5746
- State rank
- #458 of 826 in TX
Livability — Willis
- Score
- 62/100
- State rank
- #933
- US rank
- #16579
Category grades
Schools grade is shown separately in the Schools card above.
Census & demographics
- County
- Montgomery County · 663,713 people
- City population
- 38,421
- Metro
- Houston-The Woodlands-Sugar Land, TX
- Population (ZIP)
- 17,629
- Household income
- $71,143
- Rent vs Own
- Severe rent burden
- 402.0
Population outlook (Montgomery County) Hauer SSP2
- Today (2025)
- 713,896 people
- By 2030
- 805,263 · +12.8%
- By 2040
- 992,708 · +39.1%
- By 2050
- 1,179,590 · +65.2%
- By 2075
- 1,628,084 · +128.1%
- By 2100
- 1,937,880 · +171.5%
Race, ethnicity, and origin ACS 2023
- Neighborhood character
- Diverse neighborhood (Simpson 0.55)
- Race & ethnicity
- White 58% Hispanic / Latino 32% Two or more races 14% Black 7% Native American 1%
- Hispanic origin (detail)
- Mexican 27%
- Common ancestry
- Romanian 2% Slovak 2% Serbian 1%
- Foreign-born
- 12% · Canada
- Languages at home
- 80% English-only · Spanish 19%
Political lean MEDSL · Montgomery
- 2024 margin
- Solid R (+45.5) · D 26.8% · R 72.3%
- 2008→2024 swing
- +7.2pp toward D · 2008: -52.7pp · 2024: -45.5pp
- All cycles
- 2024: R+45.5 2020: R+43.8 2016: R+51.4 2012: R+60.7 2008: R+52.7
Not yet ingested
- Civics
- —
Market trends
- HPI YoY
- ▼ -8.25%
- Current HPI
- 261.9673
- Rent YoY
- ▲ 0.98%
- Metro
- Houston-The Woodlands-Sugar Land, TX
- State GDP YoY
- ▲ 3.95%
- F500 in state
- 110
Industry mix (Fortune 500 HQ in TX)
| Industry | F500 HQs | Revenue |
|---|---|---|
| Energy | 16 | $1,198B |
|
||
| Technology | 5 | $198B |
|
||
| Engineering / Construction | 4 | $72B |
|
||
| Energy Services | 3 | $60B |
|
||
| Utilities | 3 | $41B |
|
||
| Healthcare | 2 | $330B |
|
||
Price history
+144.7% since first listed11 events — show timeline
- 2026-05-10 Pending — HARMLS
- 2026-05-01 Pending — HARMLS
- 2026-04-14 Price Changed $185,500 HARMLS
- 2026-03-16 Listed $199,900 HARMLS
- 2024-10-16 Rental Removed $1,495 HARMLS
- 2024-10-07 Listed for Rent $1,495 HARMLS
- 2012-05-02 Sold (MLS) — HARMLS
- 2012-04-20 Listing Removed — HARMLS
- 2012-02-08 Listed $63,900 HARMLS
- 2012-01-10 Sold (Public Records) $77,353 Public Records
- 1994-07-22 Sold (Public Records) $75,810 Public Records
Property tax history
+5.0%/yrLatest (2025): $2,771 · -1.5% YoY. Source: county tax records.
Cash-flow waterfall
monthlySold comps — $/sqft
last 12 mo · ≤1 miLoading sold comps…