 🌊 Lakefront
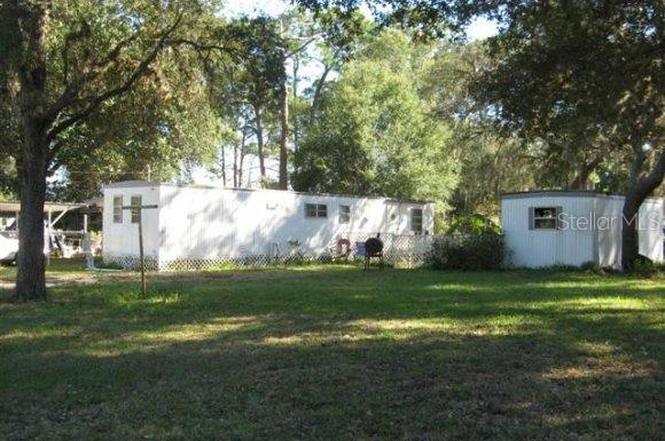
18664 SE 21st Pl · Silver Springs Shores East, FL
Flood risk 1/10 · Minimal
- FEMA flood zone
- X (unshaded)
- Chance of flooding over 30 yrs
- 0.0%
- Est. flood insurance / yr
- $507 – $1,088
Fire risk 7/10 · Major
- Est. fire insurance / yr
- $947 – $1,759
Heat risk 8/10 · Major
- Hot days now (above 108°F)
- 7 days/yr
- Hot days in 30 yrs
- 21 days/yr
Wind risk 9/10 · Severe
- Chance of severe wind over 30 yrs
- 99.0%
Air-quality risk 3/10 · Minor
- Unhealthy air days now
- 2 days/yr
- Unhealthy air days in 30 yrs
- 2 days/yr
Risk factors via First Street. Map © Google.
Why this score? — see what drove the C grade
The composite is a weighted blend of 9 inputs, each scored 0–100. Each bar is that input's sub-score; the figure is the points it added to the 100-point composite (weight × sub-score).
- Cash flow +28.5/30.0
- DSCR +10.0/10.0
- 1% rule +7.6/10.0
- Schools +3.6/10.0
- Rent growth +2.5/5.0
- Livability +2.5/5.0
- Condition / age +2.5/5.0
- ARV discount +0.0/15.0
- Appreciation +0.0/10.0
$99,900
🖨 Deal sheet 📄 Offer letter ✓ Due diligence
Listing remarks MLS
Cheap handyman special with room to roam!Come see this furnished 3/1.5 1967 12x46 Skyline mobile home with a 14x30 frame addition featuring pine wood floor. New drainfield & system in 2011.Also features a 10x20 laundry building and 11x20 carport. All sits on two paved road lots being . 43 acres +/-. Needs a roof, floor coverings, shower wall worn out and ceiling tiles. Make the repairs or pull it out and bring in a replacement home. Has community water $14/month. A great winter retreat!!
Key facts
- Integrated rv hookup
- Indoor laundry room
- Finished shed
Tags
Property features AI
Finance
- Other: Unfurnished; Homestead exemption indicated; Lot is paved and roughly 0.53 acres (approx. 105 x 157 ft)
Exterior
- Parking: Carport (1 space)
- Utilities: Public water; Septic tank sewer; Electricity connected; Water connected
- Home design: Mobile home (single wide); One story; Faces north; Residential property
- Construction: Metal siding; Membrane and metal roof; Pillar/post/pier foundation; Building area reported as 1,392 sq ft
- Exterior features: Private mailbox; Storage
Interior
- Kitchen: Range; Range hood; Microwave; Refrigerator; Electric water heater
- Bedrooms: 2 bedrooms
- Flooring: Laminate flooring
- Bathrooms: 2 full bathrooms
- Heating & cooling: Ductless heating; Wall/window air conditioning units
- Interior features: Open floorplan; Living room and dining room combined
- Laundry & utility: Washer; Dryer; Laundry closet
Neighborhood map
What this means for you Summary
Snapshot
- This is a 2-bed/1.0-bath manufactured listed at $100k.
Deal economics
- At list price, monthly cash flow is $325 ($4k/yr) — positive.
- The deal already cash-flows at list — no discount required.
- Meets the 1% rule at list price ($1k rent vs $100k).
- Recommended offer: $94k (6.0% below list) — sets the bar for market timing.
- Cap rate 10.2% vs local median 5.2% in Silver Springs Shores East — top-decile yield for the area; either an underpriced asset or a hidden risk that comps aren't pricing in. Stress-test before assuming the spread holds.
Location & tenants
- Location reads: area grade C — affects rentability + tenant quality, not the cash-flow math above.
- Marion (rural): math 42% / reading 43% proficiency, ranked #61 of 73 in FL (top 84%) — families likely to look elsewhere, expect single-tenant / working-renter base with shorter leases; 61% free/reduced lunch — lower-income household profile, screen leases tightly.
- Market conditions: 201 active listings in the ZIP; 7,071 units permitted in Marion County in 2024 (534 in 5+ unit buildings).
Forward outlook
- Local home prices are declining (-3.0%/yr); year-one equity from $691 of loan paydown is wiped out by about $3k of value loss. Plan a longer hold.
- Marion County population projected at +13% by 2050 — modest demand growth; plan on rents tracking national, not racing it.
- At projected returns (-3.0% appreciation + 3.0% rent growth), your $28k cash investment doubles in ~9 years — after that, you're playing with house money.
Negotiation context
- It's been on market 80 days — a 6% lower offer ($94k) is reasonable based on typical stale-listing flexibility.
- 2 sale attempts since 14y ago; this cycle's ask has dropped $15k (13%) from the opening price — seller is motivated, your offer sets the floor, not the list.
- Current owner paid $21k; list at $100k implies a 376% gain — meaningful room to come down on a strong offer.
Risks & watch-outs
- Climate carrying-cost: severe wind risk, 99% chance of damaging wind over 30y; major wildfire risk; extreme-heat days projected 7→21/yr by 2055 (HVAC capex compounding) — expect insurance premiums to compound above CPI over the hold.
Questions for the listing agent
- It's been on market 80 days. Have you received any prior offers? Is the seller open to a 6% concession, seller financing, or rate buy-down credit?
- Built in 1967 — when were the roof, HVAC, electrical panel, plumbing, and water heater last replaced?
- Why hasn't it sold? Are there any deal-killer items the seller is aware of (foundation, flood, title, zoning, code violations)?
- Is there a deadline driving the sale (1031 exchange, divorce, estate, relocation)? That informs how much negotiation room exists.
- This sits on a lake — are riparian / water-frontage rights deeded with the parcel? Any dock permits, shoreline easements, or HOA water-use restrictions?
- What's the documented flood / surge / shoreline-erosion history here (FEMA AND non-FEMA — e.g., storm surge, creek backup, septic-field saturation)?
- Any water-quality or seasonal algae-bloom issues that affect tenant satisfaction or short-term-rental demand?
- What's the average days-on-market for RENTAL listings here right now (not sales)? A rising rental-DOM trend means longer vacancies and softer asking-rent achievability than the comps imply.
- What's the recent tenant-quality profile in this submarket — average credit score on applications, eviction rate, late-payment / NSF rate, and stable-employment percentage? A property-management company in the area should have these aggregated.
- How much new for-sale + rental construction is in the pipeline within 1–3 miles? Heavy new supply typically softens prices + rents 12–24 months out; constrained supply supports both.
Investment metrics
- 1% rule
- 1.26% ✓
- Cap rate
- 10.20%
- Cash-on-cash
- 13.94%
- DSCR
- 1.62
- GRM
- 6.6
CMA / ARV
- ARV (on-the-fly)
- $80,676
- Comps found
- 2
Show comp detail 2 sales within ~0.75 mi
| Address | Dist | Beds/Ba | Sqft | Sold | Price | $/sf | Match |
|---|---|---|---|---|---|---|---|
| 18569 SE 22nd Ln | 0.13mi | 3/1.0 (+1) | 984 (+1%) | 2mo | $29,000 | $29 | 85 |
| 18640 SE 22nd Ln | 0.11mi | 2/2.0 | 840 (-14%) | 3mo | $70,000 | $83 | 66 |
Match score weights: distance 35% · size 25% · config 20% · recency 20%. Top-matched comps best support the ARV.
Projected returns pro-forma
-3.0% appreciation · 3.0% rent growth · sell at horizon
- IRR
- 4.2%
- Equity multiple
- 1.16×
- Total profit
- $4,520
- Equity at exit
- $14,895
- IRR
- 13.7%
- Equity multiple
- 2.09×
- Total profit
- $30,624
- Equity at exit
- $8,638
Cash invested: $27,972 (down + closing). Projections, not guarantees.
Landlord ↔ Tenant lean methodology
- Overall (STATE)
- 87 Strongly Landlord-Friendly
- State Florida
- 87 Strongly Landlord-Friendly · R+3
- County
- — inherits STATE
- City
- — inherits STATE
ZIP-level market 34488
- Home prices YoY
- -26.1%
- Active inventory
- 201
- Price-to-rent
- 6.6×
Monthly cashflow live
- Estimated rent
- $1,263 medium interval (Pro) →
- Mortgage (P&I)
- −$524
- Tax from tax record
- −$107 /mo · $1,288/yr
- Insurance
- −$42
- HOA
- −$0
- Vacancy / Maint / Mgmt
- −$265
- Net cashflow
- $325
Break-even live
UW: 25.0% down · 7.5% · 30yr · 1.5% tax · 5.0% vac · 8.0% maint · 8.0% mgmt
Financing live
Cash to close
- Down payment
- $24,975
- Closing costs
- $2,997
- Reserves months
- —
- Total cash needed
- —
Loan-product check · same deal, 3 products live
Conventional
25% down · 7.5% · 30yr
- Down + closing
- —
- Monthly P&I
- —
- Monthly cashflow
- —
- DSCR
- —
- Eligible?
- —
Personal DTI + credit; lowest rate.
DSCR
20% down · 8.5% · 30yr
- Down + closing
- —
- Monthly P&I
- —
- Monthly cashflow
- —
- DSCR
- —
- Eligible?
- —
No personal income docs; deal must DSCR.
Hard money
10% down · 12.0% · 12mo
- Down + closing
- —
- Monthly P&I
- —
- Monthly cashflow
- —
- DSCR
- —
- Eligible?
- —
Short-term bridge; refi at stabilization.
Listing history 13 events
-
2026-06-10days on market $99,900 Active 80 DOM
-
2026-06-09days on market $99,900 Active 79 DOM
-
2026-06-08days on market $99,900 Active 78 DOM
-
2026-06-07statusdays on market $99,900 Active 77 DOM
-
2026-04-30status Pending
-
2026-03-19price $99,900
-
2026-02-27price $109,000
-
2026-02-13$115,000 Active
-
2023-08-22soldstatus $21,000
-
2013-04-19soldstatus $12,000 498-char remark
Show marketing remark (498 chars)
Cheap handyman special with room to roam!Come see this furnished 3/1.5 1967 12x46 Skyline mobile home with a 14x30 frame addition featuring pine wood floor. New drainfield & system in 2011.Also features a 10x20 laundry building and 11x20 carport. All sits on two paved road lots being . 43 acres +/-. Needs a roof, floor coverings, shower wall worn out and ceiling tiles. Make the repairs or pull it out and bring in a replacement home. Has community water $14/month. A great winter retreat!!
-
2012-12-07$14,900 498-char remark
Show marketing remark (498 chars)
Cheap handyman special with room to roam!Come see this furnished 3/1.5 1967 12x46 Skyline mobile home with a 14x30 frame addition featuring pine wood floor. New drainfield & system in 2011.Also features a 10x20 laundry building and 11x20 carport. All sits on two paved road lots being . 43 acres +/-. Needs a roof, floor coverings, shower wall worn out and ceiling tiles. Make the repairs or pull it out and bring in a replacement home. Has community water $14/month. A great winter retreat!!
-
1990-06-01soldstatus $25,000
-
1986-06-01soldstatus $22,300
ⓘ Source: listings_history table (triggers on properties + properties_extension) + one-shot
backfill from property_details.listing_events for pre-trigger history.
Tax reassessment forecast FL · Resets to sale price
- Current annual tax
- $1,288 · $107/mo
- Projected year-2 tax
- $1,288 · $107/mo
- Expected delta
- $0/yr ($0/mo · 0.0%)
ⓘ Screening estimate from a state-policy table — verify with the county assessor before closing.
Climate risk First Street
- Flood 1/10 Low FEMA zone X (unshaded) · 0% chance over 30 yrs
- Wildfire 7/10 Severe
- Heat 8/10 Severe 7 d/yr ≥108°F today · 21 d/yr by 30 yrs out
- Wind 9/10 Extreme 99% chance of damaging wind over 30 yrs
- Air quality 3/10 Moderate 2 unhealthy d/yr today · 2 by 30 yrs out
Nearby sold comps map
Loading sold comps map…
Walkable amenities ~0.75 mi
Loading nearby amenities…
Taxation est. · year 1
- Rental income
- $15,157
- − Mortgage interest
- −$5,596
- − Property taxes
- −$1,288
- − Insurance
- −$500
- − Repairs & maintenance
- −$1,213
- − Management
- −$1,213
- − Depreciation
- −$2,906
- Taxable income
- $2,442
- Est. tax owed @ 24.0%
- −$586
- After-tax cash flow
- $3,314/yr
For passive investors: Depreciation is non-cash, so a rental often shows a tax loss while cash-flowing — sheltering income. Rental losses are passive: they offset passive income freely, and up to $25,000/yr can offset ordinary (W-2) income if you actively participate and your MAGI is under $100k (phasing out to $0 by $150k); unused losses carry forward. On sale, claimed depreciation is recaptured at up to 25%, and gains may owe capital-gains tax (a 1031 exchange can defer both). Figures are a year-1 estimate at your 24.0% rate — not tax advice; consult a CPA.
Schools (NCES district)
- District
- Marion
- NCES district ID
- 1201260
- Math proficiency
- 42% ▼ -7.00%
- Reading proficiency
- 43% ▼ -4.00%
- Median HH income
- $40,015
- Composite
- 35.61/100
- National rank
- #4890
- State rank
- #61 of 73 in FL
Livability — Silver Springs Shores East
No livability data for this city. (Only ~50 U.S. cities are tracked.)
Census & demographics
- Population (ZIP)
- 11,525
Population outlook (Marion County) Hauer SSP2
- Today (2025)
- 365,905 people
- By 2030
- 376,768 · +3.0%
- By 2040
- 396,555 · +8.4%
- By 2050
- 412,723 · +12.8%
- By 2075
- 446,090 · +21.9%
- By 2100
- 436,193 · +19.2%
Race, ethnicity, and origin ACS 2023
- Neighborhood character
- Predominantly White (79%)
- Race & ethnicity
- White 79% Hispanic / Latino 9% Two or more races 8% Black 8%
- Hispanic origin (detail)
- Puerto Rican 6%
- Common ancestry
- Serbian 2% Romanian 2% Lithuanian 2%
- Foreign-born
- 2% · Canada
- Languages at home
- 90% English-only · Spanish 7% Other Indo-European 2%
Political lean MEDSL · Marion
- 2024 margin
- Solid R (+31.6) · D 33.8% · R 65.5%
- 2008→2024 swing
- -20.0pp toward R · 2008: -11.6pp · 2024: -31.6pp
- All cycles
- 2024: R+31.6 2020: R+25.9 2016: R+26.2 2012: R+16.2 2008: R+11.6
Not yet ingested
- Civics
- —
Market trends
- HPI YoY
- ▼ -80.45%
- Current HPI
- 227.3763
- Rent YoY
- —
- Metro
- —
- State GDP YoY
- ▲ 3.28%
- F500 in state
- 36
Industry mix (Fortune 500 HQ in FL)
| Industry | F500 HQs | Revenue |
|---|---|---|
| Industrial Technology | 2 | $29B |
|
||
| Insurance | 2 | $17B |
|
||
| Retail | 1 | $60B |
|
||
| Technology Distribution | 1 | $58B |
|
||
| Homebuilding | 1 | $35B |
|
||
| Technology Manufacturing | 1 | $35B |
|
||
Price history
+348.0% since first listed9 events — show timeline
- 2026-04-30 Pending — Stellar MLS as Distributed by MLS Grid
- 2026-03-19 Price Changed $99,900 Stellar MLS as Distributed by MLS Grid
- 2026-02-27 Price Changed $109,000 Stellar MLS as Distributed by MLS Grid
- 2026-02-13 Listed $115,000 Stellar MLS as Distributed by MLS Grid
- 2023-08-22 Sold (Public Records) $21,000 Public Records
- 2013-04-19 Sold (MLS) $12,000 Stellar MLS as Distributed by MLS Grid
- 2012-12-07 Listed $14,900 Stellar MLS as Distributed by MLS Grid
- 1990-06-01 Sold (Public Records) $25,000 Public Records
- 1986-06-01 Sold (Public Records) $22,300 Public Records
Property tax history
+15.4%/yrLatest (2025): $1,288 · +18.4% YoY. Source: county tax records.
Cash-flow waterfall
monthlySold comps — $/sqft
last 12 mo · ≤1 miLoading sold comps…