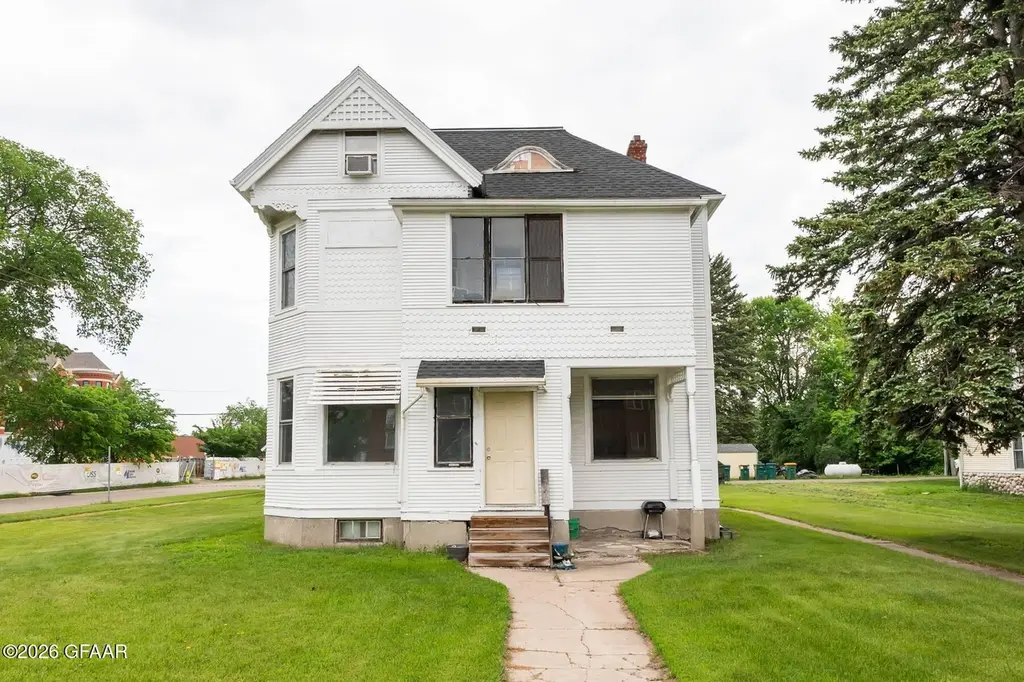
 Triplex
None · Mayville, ND
Flood risk No data
- FEMA flood zone
- —
- Chance of flooding over 30 yrs
- —
- Est. flood insurance / yr
- —
Fire risk No data
- Est. fire insurance / yr
- —
Heat risk No data
- Hot days now (above threshold)
- —
- Hot days in 30 yrs
- —
Wind risk No data
- Chance of severe wind over 30 yrs
- —
Air-quality risk No data
- Unhealthy air days now
- —
- Unhealthy air days in 30 yrs
- —
Risk factors via First Street. Map © Google.
Why this score? — see what drove the B grade
The composite is a weighted blend of 9 inputs, each scored 0–100. Each bar is that input's sub-score; the figure is the points it added to the 100-point composite (weight × sub-score).
- Cash flow +30.0/30.0
- 1% rule +10.0/10.0
- DSCR +10.0/10.0
- ARV discount +7.5/15.0
- Livability +4.2/5.0
- Schools +4.0/10.0
- Rent growth +2.5/5.0
- Condition / age +2.2/5.0
- Appreciation +0.0/10.0
$170,000
🖨 Deal sheet 📄 Offer letter ✓ Due diligence
Multi-family units
County records classify this as Multi-Family (2-4 Unit). Listing-text estimate: 3 units. confirmed
Key facts
- Four apartments
- Living space
- Multi-unit home
Tags
Property features AI
Finance
- Other: Listing provided by Valley Land Investments
- Financial info: Residential Income property type
Exterior
- Parking: Off-street parking
- Utilities: Electricity connected; Sewer connected; Water available
- Home design: Multi Family property; Two levels
- Construction: Multi Family structure
- Exterior features: 100 x 140 lot dimensions; A-1 Limited Development zoning
Interior
- Kitchen: Range; Refrigerator
- Heating & cooling: Baseboard heating; Electric heating
- Interior features: Range; Refrigerator
Neighborhood map
What this means for you Summary
Snapshot
- This is a 3 × 3-bed/1.7-bath units multifamily listed at $170k. Condition is rated fair.
Deal economics
- At list price, monthly cash flow is $1k ($13k/yr) — positive. Per door: $358/mo.
- The deal already cash-flows at list — no discount required.
- Meets the 1% rule at list price ($3k rent vs $170k).
Location & tenants
- Location reads 83/100 on livability (#2 in ND, #959 nationally) — a professional / high-income tenant draw. Strengths: crime A+, cost of living A+, housing A+; Watch: amenities F, commute F.
- May-Port Cg 14 (rural): math 42% / reading 50% proficiency, ranked #19 of 53 in ND (top 36%) — families likely to look elsewhere, expect single-tenant / working-renter base with shorter leases; only 20% free/reduced lunch — higher-income household profile.
- Market conditions: 19 active listings in the ZIP; 8 units permitted in Traill County in 2024 (0 in 5+ unit buildings).
Forward outlook
- Local home prices are declining (-3.0%/yr); year-one equity from $1k of loan paydown is wiped out by about $5k of value loss. Plan a longer hold.
- Traill County population projected at +3% by 2050 — modest demand growth; plan on rents tracking national, not racing it.
- At projected returns (-3.0% appreciation + 3.0% rent growth), your $48k cash investment doubles in ~5 years — after that, you're playing with house money.
Negotiation context
- Only 6 days on market — expect competitive offers; lowballing is unlikely to land.
Risks & watch-outs
- Watch-outs: built in 1900 — expect roof / HVAC / electrical / plumbing capex.
Questions for the listing agent
- Can we see the unit-by-unit rent roll, current vacancy, and any below-market leases? What's the average tenancy length?
- What capital expenditures (roof, boiler, parking lot, exteriors) have been made in the last 5 years, and what's planned in the next 2?
- Have any recent inspections been done? Can we get a copy of the seller's disclosures and any deferred-maintenance estimates?
- Built in 1900 — when were the roof, HVAC, electrical panel, plumbing, and water heater last replaced?
- Is there a deadline driving the sale (1031 exchange, divorce, estate, relocation)? That informs how much negotiation room exists.
- Schools are B-rated — typically a magnet for longer-tenancy family renters. What's the average tenant stay here, and is there a school-zone premium baked into asking?
- What's the average days-on-market for RENTAL listings here right now (not sales)? A rising rental-DOM trend means longer vacancies and softer asking-rent achievability than the comps imply.
- What's the recent tenant-quality profile in this submarket — average credit score on applications, eviction rate, late-payment / NSF rate, and stable-employment percentage? A property-management company in the area should have these aggregated.
- How much new apartment / multifamily construction is in the pipeline within 1–3 miles? Heavy new supply (>2% of stock underway) typically softens rents 12–24 months out; light construction supports rent growth.
Investment metrics
- 1% rule
- 1.67% ✓
- Cap rate
- 13.87%
- Cash-on-cash
- 27.06%
- DSCR
- 2.20
- GRM
- 5.0
CMA / ARV
No comps found within radius.
Projected returns pro-forma
-3.0% appreciation · 3.0% rent growth · sell at horizon
- IRR
- 21.0%
- Equity multiple
- 1.86×
- Total profit
- $40,868
- Equity at exit
- $25,348
- IRR
- 29.2%
- Equity multiple
- 3.60×
- Total profit
- $123,802
- Equity at exit
- $14,698
Cash invested: $47,600 (down + closing). Projections, not guarantees.
Landlord ↔ Tenant lean methodology
- Overall (STATE)
- 82 Strongly Landlord-Friendly
- State North Dakota
- 82 Strongly Landlord-Friendly · R+20
- County
- — inherits STATE
- City
- — inherits STATE
ZIP-level market 58257
- Home prices YoY
- -34.2%
- Active inventory
- 19
- Price-to-rent
- 14.9×
Monthly cashflow live
- Estimated rent
- $2,846 medium interval (Pro) →
- Mortgage (P&I)
- −$891
- Tax est. 1.5%
- −$212 /mo · $2,550/yr
- Insurance
- −$71
- HOA
- −$0
- Vacancy / Maint / Mgmt
- −$598
- Net cashflow
- $1,074
Break-even live
3-unit breakdown (identical units grouped — click to expand)
| Units | Beds | Baths | Est. rent |
|---|---|---|---|
| 3× units | 3 | 1.7 | $2,847 |
| #1 | 3 | 1.7 | $949 |
| #2 | 3 | 1.7 | $949 |
| #3 | 3 | 1.7 | $949 |
| Total (3 units) | $2,846 | ||
UW: 25.0% down · 7.5% · 30yr · 1.5% tax · 5.0% vac · 8.0% maint · 8.0% mgmt
Financing live
Cash to close
- Down payment
- $42,500
- Closing costs
- $5,100
- Reserves months
- —
- Total cash needed
- —
Loan-product check · same deal, 3 products live
Conventional
25% down · 7.5% · 30yr
- Down + closing
- —
- Monthly P&I
- —
- Monthly cashflow
- —
- DSCR
- —
- Eligible?
- —
Personal DTI + credit; lowest rate.
DSCR
20% down · 8.5% · 30yr
- Down + closing
- —
- Monthly P&I
- —
- Monthly cashflow
- —
- DSCR
- —
- Eligible?
- —
No personal income docs; deal must DSCR.
Hard money
10% down · 12.0% · 12mo
- Down + closing
- —
- Monthly P&I
- —
- Monthly cashflow
- —
- DSCR
- —
- Eligible?
- —
Short-term bridge; refi at stabilization.
Listing history 5 events
-
2026-06-18days on market $170,000 Active 6 DOM
-
2026-06-17days on market $170,000 Active 5 DOM
-
2026-06-16days on market $170,000 Active 4 DOM
-
2026-06-15days on market $170,000 Active 3 DOM
-
2026-06-12$170,000 Active 1 DOM
ⓘ Source: listings_history table (triggers on properties + properties_extension) + one-shot
backfill from property_details.listing_events for pre-trigger history.
Nearby sold comps map
Loading sold comps map…
Walkable amenities ~0.75 mi
Loading nearby amenities…
Taxation est. · year 1
- Rental income
- $34,152
- − Mortgage interest
- −$9,523
- − Property taxes
- −$2,550
- − Insurance
- −$850
- − Repairs & maintenance
- −$2,732
- − Management
- −$2,732
- − Depreciation
- −$4,945
- Taxable income
- $10,820
- Est. tax owed @ 24.0%
- −$2,597
- After-tax cash flow
- $10,285/yr
For passive investors: Depreciation is non-cash, so a rental often shows a tax loss while cash-flowing — sheltering income. Rental losses are passive: they offset passive income freely, and up to $25,000/yr can offset ordinary (W-2) income if you actively participate and your MAGI is under $100k (phasing out to $0 by $150k); unused losses carry forward. On sale, claimed depreciation is recaptured at up to 25%, and gains may owe capital-gains tax (a 1031 exchange can defer both). Figures are a year-1 estimate at your 24.0% rate — not tax advice; consult a CPA.
Condition & rehab AI · 6 photos
The property requires moderate renovations, focusing on updating the kitchen and exterior. These improvements will significantly enhance its resale and rental value.
Repairs flagged
- Major kitchen cabinets — severely worn and outdated
- Major kitchen countertops — worn and in need of replacement
Value-add opportunities
- Both update kitchen cabinets and countertops — modernizing the kitchen will appeal to both buyers and renters
- Both paint exterior siding — fresh paint will improve curb appeal and home value
- Both replace carpeting — new flooring will enhance the home's appearance and comfort
Renovation cost estimate screening
| Repair item | Severity | Est. cost |
|---|---|---|
| kitchen cabinets · severely worn and outdated | Major | $15,000–50,000 |
| kitchen countertops · worn and in need of replacement | Major | $15,000–50,000 |
| Total estimated repair cost · 2 items | $30,000–100,000 |
Value-add ROI direction
- Both update kitchen cabinets and countertops — modernizing the kitchen will appeal to both buyers and renters ↑
- Both paint exterior siding — fresh paint will improve curb appeal and home value ↑
- Both replace carpeting — new flooring will enhance the home's appearance and comfort ↑
ⓘ Cost ranges are severity-bucket heuristics (US national rule-of-thumb). Get contractor quotes + a written scope before underwriting a rehab budget.
Schools (NCES district)
- District
- May-Port Cg 14
- NCES district ID
- 3800041
- Math proficiency
- 42% ▼ -8.00%
- Reading proficiency
- 50% ▼ -7.00%
- Median HH income
- $50,978
- Composite
- 39.53/100
- National rank
- #3944
- State rank
- #19 of 53 in ND
Livability — Mayville
- Score
- 83/100
- State rank
- #2
- US rank
- #959
Category grades
Schools grade is shown separately in the Schools card above.
Census & demographics
- Census place
- Mayville, ND
- Population (ZIP)
- 2,275
Population outlook (Traill County) Hauer SSP2
- Today (2025)
- 8,107 people
- By 2030
- 8,099 · -0.1%
- By 2040
- 8,151 · +0.5%
- By 2050
- 8,384 · +3.4%
- By 2075
- 9,868 · +21.7%
- By 2100
- 12,181 · +50.3%
Race, ethnicity, and origin ACS 2023
- Neighborhood character
- Predominantly White (86%)
- Race & ethnicity
- White 86% Hispanic / Latino 8% Two or more races 6% Black 3%
- Hispanic origin (detail)
- Mexican 5%
- Common ancestry
- Portuguese 34% Lithuanian 3% Romanian 2%
- Foreign-born
- 5% · Canada
- Languages at home
- 94% English-only · Spanish 5% Other Indo-European 1% German/W. Germanic 0%
Political lean MEDSL · Traill
- 2024 margin
- Solid R (+31.6) · D 33.3% · R 65.0% · Other 1.7%
- 2008→2024 swing
- -38.8pp toward R · 2008: 7.2pp · 2024: -31.6pp
- All cycles
- 2024: R+31.6 2020: R+24.9 2016: R+26.5 2012: R+4.7 2008: D+7.2
Not yet ingested
- Civics
- —
Market trends
- HPI YoY
- ▼ -67.93%
- Current HPI
- 130.6558
- Rent YoY
- —
- Metro
- —
- State GDP YoY
- ▲ 2.09%
- F500 in state
- 2
Industry mix (Fortune 500 HQ in ND)
| Industry | F500 HQs | Revenue |
|---|---|---|
| Utilities / Construction | 1 | $6B |
|
||
Price history
1 event — show timeline
- 2026-06-11 Listed $170,000 GFAAR
Cash-flow waterfall
monthlySold comps — $/sqft
last 12 mo · ≤1 miLoading sold comps…