 Multi-family
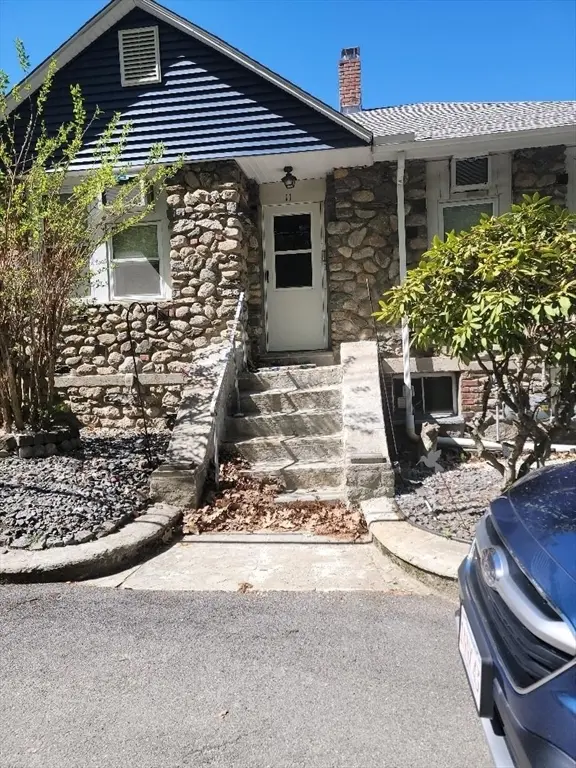
11 Olympia Ave · Shrewsbury, MA
Flood risk 6/10 · Moderate
- FEMA flood zone
- X (unshaded)
- Chance of flooding over 30 yrs
- 0.75%
- Est. flood insurance / yr
- $473 – $860
Fire risk 1/10 · Minimal
- Est. fire insurance / yr
- $915 – $1,699
Heat risk 4/10 · Minor
- Hot days now (above 94°F)
- 7 days/yr
- Hot days in 30 yrs
- 16 days/yr
Wind risk 6/10 · Moderate
- Chance of severe wind over 30 yrs
- 27.0%
Air-quality risk 2/10 · Minimal
- Unhealthy air days now
- 1 days/yr
- Unhealthy air days in 30 yrs
- 2 days/yr
Risk factors via First Street. Map © Google.
Why this score? — see what drove the C- grade
The composite is a weighted blend of 9 inputs, each scored 0–100. Each bar is that input's sub-score; the figure is the points it added to the 100-point composite (weight × sub-score).
- Cash flow +18.7/30.0
- ARV discount +10.8/15.0
- DSCR +5.9/10.0
- Schools +5.9/10.0
- 1% rule +4.4/10.0
- Livability +2.5/5.0
- Condition / age +2.5/5.0
- Rent growth +2.3/5.0
- Appreciation +0.0/10.0
$543,600
🖨 Deal sheet 📄 Offer letter ✓ Due diligence
Multi-family units
County records classify this as Multi-Family (2-4 Unit). Listing-text estimate: 1 unit. estimate disagrees with records
Listing remarks
A beautiful home with a small 3 room rental apartment attached. The home is located within minutes of Rt 290, Rt 495, Rt 20 and Rt 9, It is within walking distance to stores, markets, restaurants and shops, as well as, U-Mass Memorial Main Campus and the WRTA bus route. A perfect home for the working professional starting out or one that is downsizing, but wants to remain living in an easy to maintain home close to all services with town water and sewer. A great home for a reasonable price in Shrewsbury.
Key facts
- Town sewer
- Town water
- 5,844 sq ft lot
Tags
Property features AI
Finance
- Other: Partial basement; Total building area 1,573 (as reported)
- HOA & community: Access to public transportation; Nearby shopping; Nearby medical facility; Highway access; House of worship nearby; Nearby public and private schools; Not a senior community
Exterior
- Parking: Has garage (1 covered space); Open parking (1 space); Total 2 parking spaces; Off-street, paved parking
- Utilities: Public water; Public sewer; 110 volt electric; Gas available for range; Electric available for range
- Home design: Multi-family property; 2 stories
- Construction: Stone construction; Stone foundation; Shingle roof; Built (year per public records)
- Exterior features: Deck; Patio; Corner lot; Lake/pond nearby (walkable, 0 to 1/10 mile to beach); Beach access is public; Unimproved road surface; Private road frontage; Publicly maintained road
Interior
- Kitchen: Range; Dishwasher; Refrigerator
- Flooring: Wood flooring
- Bathrooms: 2 full bathrooms
- Heating & cooling: Central heating; Hot water heating; Natural gas; 2 heating units
- Interior features: Living room; Dining room; Office/den; Bathroom with tub & shower; Laundry room; Total of 8 rooms
- Laundry & utility: Washer; Dryer
Neighborhood map
What this means for you Summary
Snapshot
- This is a 3-bed/2.0-bath multifamily listed at $544k.
Deal economics
- At list price, monthly cash flow is $539 ($6k/yr) — positive.
- The deal already cash-flows at list — no discount required.
- To meet the 1% rule (rent ≥ 1% of price), the offer needs to be $511k (6.0% below list).
- Recommended offer: $511k (6.0% below list) — sets the bar for 1% rule.
Location & tenants
- Location reads: area grade C — affects rentability + tenant quality, not the cash-flow math above.
- Shrewsbury (suburban): math 62% / reading 68% proficiency, ranked #41 of 302 in MA (top 14%) — acceptable for families but not a draw, mixed tenant base, ~2y average lease; only 11% free/reduced lunch — higher-income household profile.
- Market conditions: Rents soft (-1.0%/yr); 81 active listings in the ZIP; 19 comparable units currently listed for rent nearby; rentals at typical pace (median 24d on market — plan ~3-4 weeks tenant-placement turnaround); 47% of comp listings sitting > 30 days — soft ceiling on asking rent; high-income renter base; 2,293 units permitted in Worcester County in 2024 (1,205 in 5+ unit buildings).
- This rent runs 44% of the median local income ($139k/yr) — at the standard rent-burdened threshold; future hikes will face affordability resistance.
Forward outlook
- Local home prices are declining (-3.0%/yr); year-one equity from $4k of loan paydown is wiped out by about $16k of value loss. Plan a longer hold.
Negotiation context
- It's been on market 29 days — a 2% lower offer ($535k) is reasonable based on typical stale-listing flexibility.
Risks & watch-outs
- Watch-outs: built in 1938 — expect roof / HVAC / electrical / plumbing capex.
- Climate carrying-cost: major flood risk; major wind risk, 27% chance of damaging wind over 30y — expect insurance premiums to compound above CPI over the hold.
Questions for the listing agent
- Built in 1938 — when were the roof, HVAC, electrical panel, plumbing, and water heater last replaced?
- Is there a deadline driving the sale (1031 exchange, divorce, estate, relocation)? That informs how much negotiation room exists.
- What's the average days-on-market for RENTAL listings here right now (not sales)? A rising rental-DOM trend means longer vacancies and softer asking-rent achievability than the comps imply.
- What's the recent tenant-quality profile in this submarket — average credit score on applications, eviction rate, late-payment / NSF rate, and stable-employment percentage? A property-management company in the area should have these aggregated.
- How much new apartment / multifamily construction is in the pipeline within 1–3 miles? Heavy new supply (>2% of stock underway) typically softens rents 12–24 months out; light construction supports rent growth.
Investment metrics
- 1% rule
- 0.94% ✗
- Cap rate
- 7.48%
- Cash-on-cash
- 4.25%
- DSCR
- 1.19
- GRM
- 8.9
CMA / ARV
- ARV (on-the-fly)
- $586,729
- Comps found
- 1
Show comp detail 1 sale within ~0.75 mi
| Address | Dist | Beds/Ba | Sqft | Sold | Price | $/sf | Match |
|---|---|---|---|---|---|---|---|
| 6 Gleason Rd | 0.68mi | 3/2.5 | 1,636 (+4%) | 12mo | $610,000 | $373 | 50 |
Match score weights: distance 35% · size 25% · config 20% · recency 20%. Top-matched comps best support the ARV.
Projected returns pro-forma
-3.0% appreciation · 0.0% rent growth · sell at horizon
- IRR
- -12.9%
- Equity multiple
- 0.55×
- Total profit
- $-68,797
- Equity at exit
- $81,053
- IRR
- -9.0%
- Equity multiple
- 0.51×
- Total profit
- $-73,893
- Equity at exit
- $47,001
Cash invested: $152,208 (down + closing). Projections, not guarantees.
Landlord ↔ Tenant lean methodology
- Overall (STATE)
- 20 Strongly Tenant-Friendly
- State Massachusetts
- 20 Strongly Tenant-Friendly · D+15
- County
- — inherits STATE
- City
- — inherits STATE
ZIP-level market 01545
- Rents YoY
- -1.0%
- Active inventory
- 81
- Price-to-rent
- 17.7×
Monthly cashflow live
- Estimated rent
- $5,111 high interval (Pro) →
- Mortgage (P&I)
- −$2,851
- Tax from tax record
- −$421 /mo · $5,054/yr
- Insurance
- −$226
- HOA
- −$0
- Vacancy / Maint / Mgmt
- −$1,073
- Net cashflow
- $539
Break-even live
2-unit breakdown (identical units grouped — click to expand)
| Units | Beds | Baths | Est. rent |
|---|---|---|---|
| 2× units | 3 | 2 | $5,112 |
| #1 | 3 | 2 | $2,556 |
| #2 | 3 | 2 | $2,556 |
| Total (2 units) | $5,111 | ||
UW: 25.0% down · 7.5% · 30yr · 1.5% tax · 5.0% vac · 8.0% maint · 8.0% mgmt
Financing live
Cash to close
- Down payment
- $135,900
- Closing costs
- $16,308
- Reserves months
- —
- Total cash needed
- —
Loan-product check · same deal, 3 products live
Conventional
25% down · 7.5% · 30yr
- Down + closing
- —
- Monthly P&I
- —
- Monthly cashflow
- —
- DSCR
- —
- Eligible?
- —
Personal DTI + credit; lowest rate.
DSCR
20% down · 8.5% · 30yr
- Down + closing
- —
- Monthly P&I
- —
- Monthly cashflow
- —
- DSCR
- —
- Eligible?
- —
No personal income docs; deal must DSCR.
Hard money
10% down · 12.0% · 12mo
- Down + closing
- —
- Monthly P&I
- —
- Monthly cashflow
- —
- DSCR
- —
- Eligible?
- —
Short-term bridge; refi at stabilization.
Rent comps 19 comps
| Address | Beds | Baths | Sqft | Rent | $/sqft | DOM | Units | Dist |
|---|---|---|---|---|---|---|---|---|
| 67 N Quinsigamond Ave #9 Shrewsbury, MA | 3.0 | 2.5 | 1620 | $3,500 | $2.16 | 43d | 1 | 0.11mi |
| 59 Olympia Ave Unit 4A Shrewsbury, MA | 3.0 | 2.5 | 1823 | $4,000 | $2.19 | 14d | 1 | 0.24mi |
| 35 Harrington Ave Shrewsbury, MA | 2.0 | 1.0–2.0 | 907 | $3,560 | $3.93 | 14d | 18 | 0.38mi |
| 20 Winneconnett Rd Unit 20 Worcester, MA | 2.0 | 1.0 | 1080 | $2,500 | $2.31 | 43d | 1 | 0.45mi |
| 92 Odonnell Ave #92 Shrewsbury, MA | 2.0 | 2.5 | 2115 | $3,700 | $1.75 | 43d | 1 | 0.45mi |
| 83 Coburn Ave Unit 83 Worcester, MA | 3.0 | 1.5 | 1365 | $3,000 | $2.20 | 43d | 1 | 0.65mi |
| 147 Lake Ave Unit 147 Worcester, MA | 3.0 | 2.5 | 1408 | $3,200 | $2.27 | 14d | 1 | 0.67mi |
| 132 Coburn Ave Unit 1 Worcester, MA | 3.0 | 1.0 | 1436 | $2,100 | $1.46 | 43d | 1 | 0.78mi |
| 511 Plantation St Worcester, MA | 1.0–2.0 | 1.0–2.0 | 947 | $2,587 | $2.73 | 14d | 40 | 0.94mi |
| 52 Northboro St Unit 1 Worcester, MA | 2.0 | 1.0 | 1200 | $1,600 | $1.33 | 43d | 1 | 0.97mi |
| 4 Linda Cir Unit 1 Shrewsbury, MA | 2.0 | 1.0 | 1300 | $2,200 | $1.69 | 43d | 1 | 1.08mi |
| 308 Plantation St Apt 3 Worcester, MA | 3.0 | 1.0 | 1600 | $2,000 | $1.25 | 23d | 1 | 1.12mi |
| 285 Plantation St Worcester, MA | 2.0 | 1.0–1.5 | 987 | $2,189 | $2.22 | 14d | 15 | 1.27mi |
| 27 Granby Rd Apt 2 Worcester, MA | 3.0 | 1.0 | 1240 | $2,300 | $1.85 | 14d | 1 | 1.30mi |
| 383 Shrewsbury St Worcester, MA | 1.0–2.0 | 1.0–2.0 | 895 | $2,895 | $3.23 | 14d | 3 | 1.30mi |
| 51 Oriol Dr Worcester, MA | 3.0 | 1.0–2.0 | 936 | $4,360 | $4.66 | 14d | 151 | 1.40mi |
| 9 Brookdale St Unit 2 Worcester, MA | 3.0 | 1.0 | 1210 | $2,200 | $1.82 | 21d | 1 | 1.41mi |
| 8 Ellsmere St Unit a Worcester, MA | 3.0 | 2.0 | 1600 | $2,400 | $1.50 | 43d | 1 | 1.44mi |
| 15 Ancona Rd Unit 1 Worcester, MA | 3.0 | 1.0 | 1538 | $2,999 | $1.95 | 43d | 1 | 1.48mi |
Listing history 16 events
-
2026-06-18days on market $543,600 Active 29 DOM
-
2026-06-17days on market $543,600 Active 28 DOM
-
2026-06-16days on market $543,600 Active 27 DOM
-
2026-06-15days on market $543,600 Active 26 DOM
-
2026-06-14days on market $543,600 Active 24 DOM
-
2026-06-13days on market $543,600 Active 23 DOM
-
2026-06-10days on market $543,600 Active 21 DOM
-
2026-06-09days on market $543,600 Active 20 DOM
-
2026-06-08days on market $543,600 Active 19 DOM
-
2026-06-07days on market $543,600 Active 18 DOM
-
2026-06-03days on market $543,600 Active 14 DOM
-
2026-06-02days on market $543,600 Active 13 DOM
-
2026-06-01days on market $543,600 Active 12 DOM
-
2026-05-31days on market $543,600 Active 11 DOM
-
2026-05-31days on market $543,600 Active 10 DOM
-
2026-05-20$543,600 New
ⓘ Source: listings_history table (triggers on properties + properties_extension) + one-shot
backfill from property_details.listing_events for pre-trigger history.
Tax reassessment forecast MA · Partial reset (capped growth)
- Current annual tax
- $5,054 · $421/mo
- Projected year-2 tax
- $5,870 · $489/mo
- Expected delta
- +$816/yr (+$68/mo · 16.1%)
ⓘ Screening estimate from a state-policy table — verify with the county assessor before closing.
Climate risk First Street
- Flood 6/10 Major FEMA zone X (unshaded) · 75% chance over 30 yrs
- Wildfire 1/10 Low
- Heat 4/10 Moderate 7 d/yr ≥94°F today · 16 d/yr by 30 yrs out
- Wind 6/10 Major 27% chance of damaging wind over 30 yrs
- Air quality 2/10 Low 1 unhealthy d/yr today · 2 by 30 yrs out
Nearby sold comps map
Loading sold comps map…
Walkable amenities ~0.75 mi
Loading nearby amenities…
Taxation est. · year 1
- Rental income
- $61,332
- − Mortgage interest
- −$30,450
- − Property taxes
- −$5,054
- − Insurance
- −$2,718
- − Repairs & maintenance
- −$4,907
- − Management
- −$4,907
- − Depreciation
- −$15,814
- Taxable loss
- −$2,517
- Est. tax savings @ 24.0%
- +$604
- After-tax cash flow
- $7,076/yr
For passive investors: Depreciation is non-cash, so a rental often shows a tax loss while cash-flowing — sheltering income. Rental losses are passive: they offset passive income freely, and up to $25,000/yr can offset ordinary (W-2) income if you actively participate and your MAGI is under $100k (phasing out to $0 by $150k); unused losses carry forward. On sale, claimed depreciation is recaptured at up to 25%, and gains may owe capital-gains tax (a 1031 exchange can defer both). Figures are a year-1 estimate at your 24.0% rate — not tax advice; consult a CPA.
Schools (NCES district)
- District
- Shrewsbury
- NCES district ID
- 2510770
- Math proficiency
- 62% ▼ -10.00%
- Reading proficiency
- 68% ▼ -5.00%
- Median HH income
- $92,075
- Composite
- 59.23/100
- National rank
- #938
- State rank
- #41 of 302 in MA
Livability — Shrewsbury
No livability data for this city. (Only ~50 U.S. cities are tracked.)
Census & demographics
- County
- Worcester County · 487,911 people
- City population
- 38,876
- Metro
- Worcester, MA-CT
- Population (ZIP)
- 38,876
- Household income
- $139,302
- Rent vs Own
- Severe rent burden
- 924.0
Population outlook (Worcester County) Hauer SSP2
- Today (2025)
- 850,858 people
- By 2030
- 860,403 · +1.1%
- By 2040
- 869,902 · +2.2%
- By 2050
- 869,110 · +2.1%
- By 2075
- 870,120 · +2.3%
- By 2100
- 829,703 · -2.5%
Race, ethnicity, and origin ACS 2023
- Neighborhood character
- Majority White (63%)
- Race & ethnicity
- White 63% Asian 24% Two or more races 7% Hispanic / Latino 5% Black 3%
- Common ancestry
- Lithuanian 4% Romanian 3% Slovak 2%
- Foreign-born
- 27% · Canada, China
- Languages at home
- 66% English-only · Other Indo-European 12% Other Asian/Pacific 9% Chinese 3%
Political lean MEDSL · Worcester
- 2024 margin
- D (+10.0) · D 53.9% · R 43.9% · Other 2.2%
- 2008→2024 swing
- -3.8pp toward R · 2008: 13.8pp · 2024: 10.0pp
- All cycles
- 2024: D+10.0 2020: D+17.8 2016: D+10.5 2012: D+9.2 2008: D+13.8
Not yet ingested
- Civics
- —
Market trends
- HPI YoY
- ▼ -338.80%
- Current HPI
- 427.1289
- Rent YoY
- ▼ -0.98%
- Metro
- Worcester, MA-CT
- State GDP YoY
- ▲ 2.28%
- F500 in state
- 38
Industry mix (Fortune 500 HQ in MA)
| Industry | F500 HQs | Revenue |
|---|---|---|
| Technology | 3 | $17B |
|
||
| Insurance | 2 | $84B |
|
||
| Retail | 2 | $76B |
|
||
| Life Sciences | 1 | $43B |
|
||
| Energy Technology | 1 | $31B |
|
||
| Aerospace / Defense | 1 | $18B |
|
||
Price history
1 event — show timeline
- 2026-05-20 Listed $543,600 MLS PIN
Property tax history
+5.7%/yrLatest (2023): $5,054 · -1.7% YoY. Source: county tax records.
Cash-flow waterfall
monthlySold comps — $/sqft
last 12 mo · ≤1 miLoading sold comps…