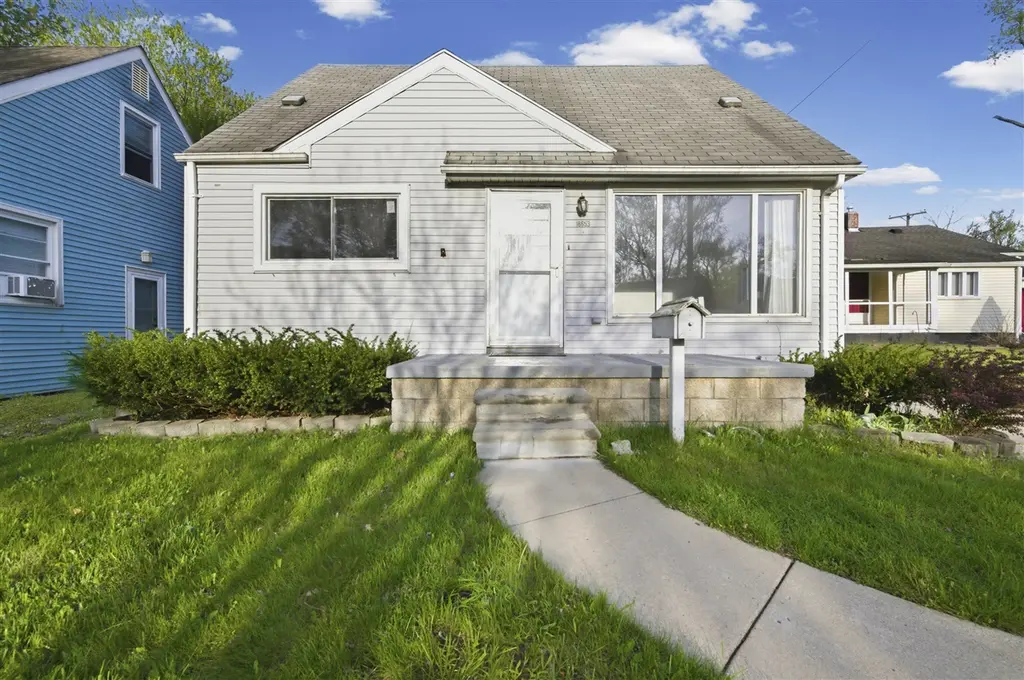
18653 Indian · Livonia, MI
Flood risk 1/10 · Minimal
- FEMA flood zone
- X (unshaded)
- Chance of flooding over 30 yrs
- 0.0%
- Est. flood insurance / yr
- $473 – $860
Fire risk 1/10 · Minimal
- Est. fire insurance / yr
- $784 – $1,456
Heat risk 3/10 · Minor
- Hot days now (above 98°F)
- 7 days/yr
- Hot days in 30 yrs
- 14 days/yr
Wind risk 2/10 · Minimal
- Chance of severe wind over 30 yrs
- —
Air-quality risk 3/10 · Minor
- Unhealthy air days now
- 2 days/yr
- Unhealthy air days in 30 yrs
- 3 days/yr
Risk factors via First Street. Map © Google.
Why this score? — see what drove the C grade
The composite is a weighted blend of 9 inputs, each scored 0–100. Each bar is that input's sub-score; the figure is the points it added to the 100-point composite (weight × sub-score).
- Cash flow +22.5/30.0
- ARV discount +11.3/15.0
- DSCR +7.2/10.0
- 1% rule +6.0/10.0
- Livability +3.9/5.0
- Rent growth +2.5/5.0
- Condition / age +2.5/5.0
- Schools +1.4/10.0
- Appreciation +0.0/10.0
$145,000
🖨 Deal sheet 📄 Offer letter ✓ Due diligence
Listing remarks MLS
Welcome home to this charming 3-bedroom bungalow, ideal for first-time buyers or those looking to downsize. Features include a partially finished basement for added flexibility, detached garage, and rear deck for relaxing or entertaining. A great opportunity to own instead of rent.
Key facts
- Rear deck
- Detached garage
- 5,227 sq ft lot
Tags
Property features AI
Exterior
- Parking: Detached 2-car garage
- Utilities: Public water
- Home design: Single-family residential; Built in 1953
- Construction: Vinyl siding construction
- Exterior features: Vinyl siding; Public water
Interior
- Kitchen: Kitchen
- Bedrooms: Primary bedroom; Bedroom 2; Bedroom 3
- Bathrooms: 1 full bathroom
- Heating & cooling: Forced air heating
- Interior features: Six total rooms; Full basement
- Laundry & utility: Laundry room
Neighborhood map
What this means for you Summary
Snapshot
- This is a 3-bed/1.0-bath single-family listed at $145k.
Deal economics
- At list price, monthly cash flow is $244 ($3k/yr) — positive.
- The deal already cash-flows at list — no discount required.
- Meets the 1% rule at list price ($2k rent vs $145k).
- Cap rate 8.3% vs local median 4.9% in Livonia — top-decile yield for the area; either an underpriced asset or a hidden risk that comps aren't pricing in. Stress-test before assuming the spread holds.
Location & tenants
- Location reads 77/100 on livability (#116 in MI, #2,784 nationally) — a middle-class / working-renter tenant base. Strengths: employment A+, cost of living A+, housing A+; Watch: amenities D, health & safety D, commute F.
- Redford Union Schools District No. 1 (suburban): math 8% / reading 23% proficiency, ranked #489 of 540 in MI (top 91%) — low school quality limits family demand, transient renter base, plan for 1-2y turnover; 66% free/reduced lunch — lower-income household profile, screen leases tightly.
- Market conditions: 86 active listings in the ZIP; 13 comparable units currently listed for rent nearby; rentals at typical pace (median 24d on market — plan ~3-4 weeks tenant-placement turnaround); 2,639 units permitted in Wayne County in 2024 (1,216 in 5+ unit buildings).
Forward outlook
- Local home prices are declining (-3.0%/yr); year-one equity from $1k of loan paydown is wiped out by about $4k of value loss. Plan a longer hold.
- Wayne County population projected at -17% by 2050 — secular population decline; favor cash flow + early exit over multi-decade hold.
Negotiation context
- Only 3 days on market — expect competitive offers; lowballing is unlikely to land.
- 5 sale attempts since 25y ago with the ask held roughly flat each time — persistent listings suggest the price (not the market) is what's stuck; bring a comps-based counter.
- Current owner paid $32k; list at $145k implies a 357% gain — meaningful room to come down on a strong offer.
Risks & watch-outs
- Watch-outs: built in 1953 — expect roof / HVAC / electrical / plumbing capex.
Questions for the listing agent
- Built in 1953 — when were the roof, HVAC, electrical panel, plumbing, and water heater last replaced?
- Is there a deadline driving the sale (1031 exchange, divorce, estate, relocation)? That informs how much negotiation room exists.
- Schools are B-rated — typically a magnet for longer-tenancy family renters. What's the average tenant stay here, and is there a school-zone premium baked into asking?
- What's the average days-on-market for RENTAL listings here right now (not sales)? A rising rental-DOM trend means longer vacancies and softer asking-rent achievability than the comps imply.
- What's the recent tenant-quality profile in this submarket — average credit score on applications, eviction rate, late-payment / NSF rate, and stable-employment percentage? A property-management company in the area should have these aggregated.
- How much new for-sale + rental construction is in the pipeline within 1–3 miles? Heavy new supply typically softens prices + rents 12–24 months out; constrained supply supports both.
Investment metrics
- 1% rule
- 1.10% ✓
- Cap rate
- 8.31%
- Cash-on-cash
- 7.22%
- DSCR
- 1.32
- GRM
- 7.6
CMA / ARV
- ARV (on-the-fly)
- $158,508
- Comps found
- 12
Show comp detail 12 sales within ~0.75 mi
| Address | Dist | Beds/Ba | Sqft | Sold | Price | $/sf | Match |
|---|---|---|---|---|---|---|---|
| 18653 Indian | 0.00mi | 3/1.0 | 1,071 (0%) | 1mo | $151,000 | $141 | 100 |
| 18696 Gaylord | 0.21mi | 3/1.0 | 1,071 (0%) | 5mo | $130,000 | $121 | 86 |
| 18400 Delaware Ave | 0.33mi | 3/1.0 | 981 (-8%) | 6mo | $175,000 | $178 | 66 |
| 18743 Macarthur | 0.36mi | 3/1.0 | 931 (-13%) | 3mo | $190,000 | $204 | 58 |
| 19910 Seminole | 0.71mi | 3/1.0 | 1,026 (-4%) | 2mo | $108,000 | $105 | 58 |
| 18943 Lathers St | 0.70mi | 3/1.0 | 1,016 (-5%) | 1mo | $125,000 | $123 | 58 |
| 19350 Antago St | 0.51mi | 3/1.0 | 1,179 (+10%) | 3mo | $215,000 | $182 | 57 |
| 19470 Woodworth Ave | 0.69mi | 3/1.0 | 1,000 (-7%) | 1mo | $175,000 | $175 | 55 |
| 19394 Woodworth | 0.63mi | 2/1.0 (-1) | 1,132 (+6%) | 5mo | $168,000 | $148 | 52 |
| 17697 Norborne | 0.71mi | 4/1.0 (+1) | 1,134 (+6%) | 4mo | $134,500 | $119 | 49 |
| 19369 Wakenden | 0.69mi | 3/1.0 | 936 (-13%) | 3mo | $120,000 | $128 | 44 |
| 18070 Floral St | 0.70mi | 3/1.0 | 1,225 (+14%) | 5mo | $230,000 | $188 | 39 |
Match score weights: distance 35% · size 25% · config 20% · recency 20%. Top-matched comps best support the ARV.
Projected returns pro-forma
-3.0% appreciation · 3.0% rent growth · sell at horizon
- IRR
- -5.2%
- Equity multiple
- 0.81×
- Total profit
- $-7,905
- Equity at exit
- $21,620
- IRR
- 4.5%
- Equity multiple
- 1.33×
- Total profit
- $13,287
- Equity at exit
- $12,537
Cash invested: $40,600 (down + closing). Projections, not guarantees.
Landlord ↔ Tenant lean methodology
- Overall (STATE)
- 62 Landlord-Friendly
- State Michigan
- 62 Landlord-Friendly · EVEN
- County
- — inherits STATE
- City
- — inherits STATE
ZIP-level market 48240
- Active inventory
- 86
- Price-to-rent
- 7.6×
Monthly cashflow live
- Estimated rent
- $1,598 high interval (Pro) →
- Mortgage (P&I)
- −$760
- Tax from tax record
- −$198 /mo · $2,371/yr
- Insurance
- −$60
- HOA
- −$0
- Vacancy / Maint / Mgmt
- −$336
- Net cashflow
- $244
Break-even live
UW: 25.0% down · 7.5% · 30yr · 1.5% tax · 5.0% vac · 8.0% maint · 8.0% mgmt
Financing live
Cash to close
- Down payment
- $36,250
- Closing costs
- $4,350
- Reserves months
- —
- Total cash needed
- —
Loan-product check · same deal, 3 products live
Conventional
25% down · 7.5% · 30yr
- Down + closing
- —
- Monthly P&I
- —
- Monthly cashflow
- —
- DSCR
- —
- Eligible?
- —
Personal DTI + credit; lowest rate.
DSCR
20% down · 8.5% · 30yr
- Down + closing
- —
- Monthly P&I
- —
- Monthly cashflow
- —
- DSCR
- —
- Eligible?
- —
No personal income docs; deal must DSCR.
Hard money
10% down · 12.0% · 12mo
- Down + closing
- —
- Monthly P&I
- —
- Monthly cashflow
- —
- DSCR
- —
- Eligible?
- —
Short-term bridge; refi at stabilization.
Rent comps 13 comps
| Address | Beds | Baths | Sqft | Rent | $/sqft | DOM | Units | Dist |
|---|---|---|---|---|---|---|---|---|
| 26539 Clarita Redford, MI | 3.0 | 1.5 | 931 | $1,875 | $2.01 | 24d | 1 | 0.30mi |
| 19354 Seminole Redford, MI | 3.0 | 1.0 | 1050 | $1,450 | $1.38 | 24d | 1 | 0.40mi |
| 18405 Gillman St Livonia, MI | 3.0 | 2.0 | 1014 | $1,950 | $1.92 | 5d | 1 | 0.62mi |
| 20091 Inkster Rd Livonia, MI | 2.0 | 1.0 | 756 | $1,400 | $1.85 | 5d | 1 | 0.93mi |
| 25822 W 6 Mile Rd Redford Township, MI | 2.0 | 2.0 | 1100 | $1,100 | $1.00 | 24d | 1 | 1.06mi |
| 20516 Denby Redford, MI | 4.0 | 1.5 | 950 | $1,800 | $1.89 | 18d | 1 | 1.10mi |
| 20524 Indian Redford, MI | 3.0 | 1.0 | 988 | $1,600 | $1.62 | 24d | 1 | 1.10mi |
| 20772 Indian St Southfield, MI | 4.0 | 1.0 | 1272 | $1,800 | $1.42 | 43d | 1 | 1.27mi |
| 20745 Saint Francis Unit 208 Farmington Hills, MI | 2.0 | 1.0 | 900 | $1,395 | $1.55 | 15d | 1 | 1.35mi |
| 20745 Saint Francis Unit 101 Farmington Hills, MI | 2.0 | 1.0 | 900 | $1,495 | $1.66 | 43d | 1 | 1.35mi |
| 18732 Salem Unit 2 Detroit, MI | 2.0 | 1.0 | 925 | $1,050 | $1.14 | 12d | 1 | 1.37mi |
| 29599 Nottingham Cir Livonia, MI | 2.0 | 2.0 | 1302 | $1,800 | $1.38 | 3d | 1 | 1.45mi |
| 17324 Salem St Detroit, MI | 2.0 | 1.0 | 989 | $1,200 | $1.21 | 24d | 1 | 1.49mi |
Listing history 14 events
-
2026-05-01status Pending 282-char remark
Show marketing remark (282 chars)
Welcome home to this charming 3-bedroom bungalow, ideal for first-time buyers or those looking to downsize. Features include a partially finished basement for added flexibility, detached garage, and rear deck for relaxing or entertaining. A great opportunity to own instead of rent.
-
2026-05-01status Pending
Show marketing remark (282 chars)
Welcome home to this charming 3-bedroom bungalow, ideal for first-time buyers or those looking to downsize. Features include a partially finished basement for added flexibility, detached garage, and rear deck for relaxing or entertaining. A great opportunity to own instead of rent.
-
2026-04-28$145,000 Active 282-char remark
Show marketing remark (282 chars)
Welcome home to this charming 3-bedroom bungalow, ideal for first-time buyers or those looking to downsize. Features include a partially finished basement for added flexibility, detached garage, and rear deck for relaxing or entertaining. A great opportunity to own instead of rent.
-
2026-04-28$145,000 Active
Show marketing remark (282 chars)
Welcome home to this charming 3-bedroom bungalow, ideal for first-time buyers or those looking to downsize. Features include a partially finished basement for added flexibility, detached garage, and rear deck for relaxing or entertaining. A great opportunity to own instead of rent.
-
2010-09-03soldstatus $31,700
-
2010-01-26$30,000
-
2001-10-26soldstatus $115,500
-
2001-06-27soldstatus $115,500
-
2001-05-23historical
-
2001-05-02$114,900
-
1999-03-16soldstatus $89,500
-
1996-05-22soldstatus $72,000
ⓘ Source: listings_history table (triggers on properties + properties_extension) + one-shot
backfill from property_details.listing_events for pre-trigger history.
Tax reassessment forecast MI · Partial reset (capped growth)
- Current annual tax
- $2,371 · $198/mo
- Projected year-2 tax
- $2,371 · $198/mo
- Expected delta
- $0/yr ($0/mo · 0.0%)
ⓘ Screening estimate from a state-policy table — verify with the county assessor before closing.
Climate risk First Street
- Flood 1/10 Low FEMA zone X (unshaded) · 0% chance over 30 yrs
- Wildfire 1/10 Low
- Heat 3/10 Moderate 7 d/yr ≥98°F today · 14 d/yr by 30 yrs out
- Wind 2/10 Low
- Air quality 3/10 Moderate 2 unhealthy d/yr today · 3 by 30 yrs out
Nearby sold comps map
Loading sold comps map…
Walkable amenities ~0.75 mi
Loading nearby amenities…
Taxation est. · year 1
- Rental income
- $19,180
- − Mortgage interest
- −$8,122
- − Property taxes
- −$2,371
- − Insurance
- −$725
- − Repairs & maintenance
- −$1,534
- − Management
- −$1,534
- − Depreciation
- −$4,218
- Taxable income
- $674
- Est. tax owed @ 24.0%
- −$162
- After-tax cash flow
- $2,769/yr
For passive investors: Depreciation is non-cash, so a rental often shows a tax loss while cash-flowing — sheltering income. Rental losses are passive: they offset passive income freely, and up to $25,000/yr can offset ordinary (W-2) income if you actively participate and your MAGI is under $100k (phasing out to $0 by $150k); unused losses carry forward. On sale, claimed depreciation is recaptured at up to 25%, and gains may owe capital-gains tax (a 1031 exchange can defer both). Figures are a year-1 estimate at your 24.0% rate — not tax advice; consult a CPA.
Schools (NCES district)
- District
- Redford Union Schools District No. 1
- NCES district ID
- 2629460
- Math proficiency
- 8% ▼ -6.00%
- Reading proficiency
- 23% ▬ 0.00%
- Median HH income
- $49,778
- Composite
- 14.1/100
- National rank
- #9460
- State rank
- #489 of 540 in MI
Livability — Livonia
- Score
- 77/100
- State rank
- #116
- US rank
- #2784
Category grades
Schools grade is shown separately in the Schools card above.
Census & demographics
- City population
- 56,806
- Population (ZIP)
- 17,097
Population outlook (Wayne County) Hauer SSP2
- Today (2025)
- 1,675,273 people
- By 2030
- 1,620,300 · -3.3%
- By 2040
- 1,502,341 · -10.3%
- By 2050
- 1,384,039 · -17.4%
- By 2075
- 1,124,592 · -32.9%
- By 2100
- 881,193 · -47.4%
Race, ethnicity, and origin ACS 2023
- Neighborhood character
- Diverse neighborhood (Simpson 0.64)
- Race & ethnicity
- White 45% Black 40% Two or more races 10% Hispanic / Latino 6%
- Hispanic origin (detail)
- Mexican 6%
- Common ancestry
- Romanian 5% Lithuanian 3% Slovak 2%
- Foreign-born
- 4% · Canada
- Languages at home
- 93% English-only · Spanish 5% Chinese 1%
Political lean MEDSL · Wayne
- 2024 margin
- Strong D (+29.0) · D 62.7% · R 33.7% · Other 3.6%
- 2008→2024 swing
- -20.5pp toward R · 2008: 49.5pp · 2024: 29.0pp
- All cycles
- 2024: D+29.0 2020: D+38.1 2016: D+37.3 2012: D+46.9 2008: D+49.5
Not yet ingested
- Civics
- —
Market trends
- HPI YoY
- ▼ -177.98%
- Current HPI
- 236.2958
- Rent YoY
- —
- Metro
- —
- State GDP YoY
- ▲ 1.37%
- F500 in state
- 28
Industry mix (Fortune 500 HQ in MI)
| Industry | F500 HQs | Revenue |
|---|---|---|
| Automotive Parts | 3 | $48B |
|
||
| Automotive | 2 | $372B |
|
||
| Chemicals | 1 | $45B |
|
||
| Automotive Retail | 1 | $29B |
|
||
| Healthcare / Medical Devices | 1 | $23B |
|
||
| Automotive Technology | 1 | $20B |
|
||
Price history
+101.4% since first listed14 events — show timeline
- 2026-05-01 Pending — REALCOMP
- 2026-05-01 Pending — MiRealSource-MiMLS
- 2026-05-01 Pending — SW Michigan MLS
- 2026-04-28 Listed $145,000 SW Michigan MLS
- 2026-04-28 Listed $145,000 MiRealSource-MiMLS
- 2026-04-28 Listed $145,000 REALCOMP
- 2010-09-03 Sold (MLS) $31,700 REALCOMP
- 2010-01-26 Listed $30,000 REALCOMP
- 2001-10-26 Sold (Public Records) $115,500 Public Records
- 2001-06-27 Sold (MLS) $115,500 MiRealSource-MiMLS
- 2001-05-23 Listing Removed — MiRealSource-MiMLS
- 2001-05-02 Listed $114,900 MiRealSource-MiMLS
- 1999-03-16 Sold (Public Records) $89,500 Public Records
- 1996-05-22 Sold (Public Records) $72,000 Public Records
Property tax history
+1.5%/yrLatest (2025): $2,371 · -45.4% YoY. Source: county tax records.
Cash-flow waterfall
monthlySold comps — $/sqft
last 12 mo · ≤1 miLoading sold comps…