 Fourplex
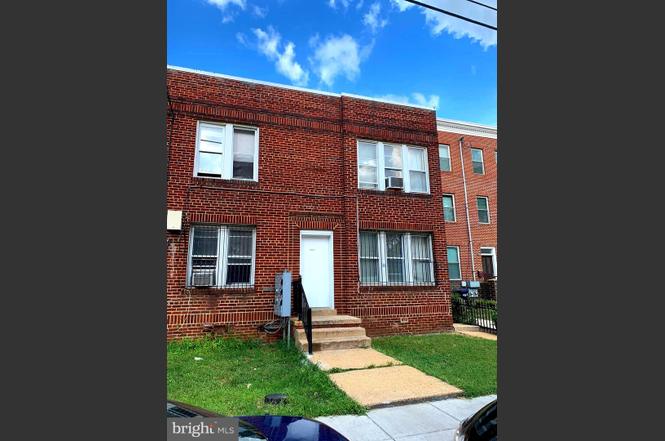
1851 NE Kendall St NE · Washington, DC
Flood risk 7/10 · Major
- FEMA flood zone
- X (unshaded)
- Chance of flooding over 30 yrs
- 0.99%
- Est. flood insurance / yr
- $507 – $1,088
Fire risk 1/10 · Minimal
- Est. fire insurance / yr
- $631 – $1,173
Heat risk 7/10 · Major
- Hot days now (above 106°F)
- 7 days/yr
- Hot days in 30 yrs
- 15 days/yr
Wind risk 4/10 · Minor
- Chance of severe wind over 30 yrs
- 19.0%
Air-quality risk 4/10 · Minor
- Unhealthy air days now
- 4 days/yr
- Unhealthy air days in 30 yrs
- 5 days/yr
Risk factors via First Street. Map © Google.
Why this score? — see what drove the C+ grade
The composite is a weighted blend of 9 inputs, each scored 0–100. Each bar is that input's sub-score; the figure is the points it added to the 100-point composite (weight × sub-score).
- Cash flow +30.0/30.0
- 1% rule +10.0/10.0
- DSCR +10.0/10.0
- Livability +3.7/5.0
- Schools +3.6/10.0
- Condition / age +2.5/5.0
- Rent growth +1.7/5.0
- ARV discount +0.0/15.0
- Appreciation +0.0/10.0
$889,000
🖨 Deal sheet 📄 Offer letter ✓ Due diligence
Multi-family units
County records classify this as Multi-Family (2-4 Unit). Listing-text estimate: 4 units. confirmed
Listing remarks
PRICE REDUCED bring all offers Calling all Investors/Developers!! This is a 4 unit building with one unit vacant, Shows well, building , with all the attractive development, eateries, City Winery and nightlife all within walking distance.
Key facts
- 4 unit building
- One unit vacant
- 3,600 sq ft lot
Tags
Property features AI
Finance
- Other: Total of 4 units in the building; Assessor lists above-grade finished area; Property has both above-grade and below-grade structures noted
- Financial info: Some units are leased (3 of 4 units leased); All units listed as month-to-month; Rent control: no
- HOA & community: Information not provided
Exterior
- Parking: On-street parking
- Security: Information not provided
- Utilities: Public water; Public sewer; Natural gas available; Natural gas hot water; Phone service
- Home design: Semi-detached structure; Two levels; Property condition listed as very good; Fee simple ownership
- Construction: Brick construction; Composite roof; Foundation described as other; Built year source: assessor
- Exterior features: Road surface: approved blacktop; In city limits
Interior
- Kitchen: Information not provided
- Bedrooms: Four 1-bedroom units and four single-room units (multi-unit property)
- Flooring: Information not provided
- Bathrooms: Information not provided
- Heating & cooling: Hot water heating; Electric heating fuel; Electric cooling fuel
- Interior features: No basement; Assessor indicates finished above-grade area
- Laundry & utility: Month-to-month leases for units (some units occupied)
Neighborhood map
What this means for you Summary
Snapshot
- This is a 4 × 4-bed/4.0-bath units multifamily listed at $889k.
Deal economics
- At list price, monthly cash flow is $8k ($96k/yr) — positive. Per door: $2k/mo.
- The deal already cash-flows at list — no discount required.
- Meets the 1% rule at list price ($17k rent vs $889k).
- Recommended offer: $782k (12.0% below list) — sets the bar for market timing.
- Cap rate 17.2% vs local median 2.5% in Washington — top-decile yield for the area; either an underpriced asset or a hidden risk that comps aren't pricing in. Stress-test before assuming the spread holds.
Location & tenants
- Location reads 73/100 on livability (#1 in DC) — a middle-class / working-renter tenant base. Strengths: amenities A+, commute A+, employment A+; Watch: crime F, cost of living F.
- District Of Columbia Public Schools (urban): math 33% / reading 40% proficiency, ranked #8 of 32 in DC (top 25%) — families likely to look elsewhere, expect single-tenant / working-renter base with shorter leases; 65% free/reduced lunch — lower-income household profile, screen leases tightly.
- Market conditions: Rents falling (-3.0%/yr); 548 active listings in the ZIP; 40 comparable units currently listed for rent nearby; rentals at typical pace (median 24d on market — plan ~3-4 weeks tenant-placement turnaround); high-income renter base; 1,737 units permitted in District of Columbia in 2024 (1,506 in 5+ unit buildings).
- At $17,063/mo this rent would consume 170% of the median local household income ($120k/yr) (locally 3854% of renters already pay >50% of income on rent) — very limited rent-growth headroom before tenants either downsize or default.
Forward outlook
- Local home prices are declining (-3.0%/yr); year-one equity from $6k of loan paydown is wiped out by about $27k of value loss. Plan a longer hold.
- District of Columbia County population projected at +50% by 2050 — long-run rental-demand tailwind backs the buy-and-hold thesis.
- At projected returns (-3.0% appreciation + 0.0% rent growth), your $249k cash investment doubles in ~4 years — after that, you're playing with house money.
Negotiation context
- It's been on market 447 days — a 12% lower offer ($782k) is reasonable based on typical stale-listing flexibility.
- 7 sale attempts since 7y ago; this cycle's ask is 889% above the opening price — seller raised mid-cycle; expect resistance to lowballs.
- Current owner paid $68k; list at $889k implies a 1207% gain — meaningful room to come down on a strong offer.
Risks & watch-outs
- Watch-outs: flood insurance adds $66/mo; built in 1942 — expect roof / HVAC / electrical / plumbing capex.
- Climate carrying-cost: major flood risk; extreme-heat days projected 7→15/yr by 2055 (HVAC capex compounding) — expect insurance premiums to compound above CPI over the hold.
Questions for the listing agent
- It's been on market 447 days. Have you received any prior offers? Is the seller open to a 12% concession, seller financing, or rate buy-down credit?
- Can we see the unit-by-unit rent roll, current vacancy, and any below-market leases? What's the average tenancy length?
- What capital expenditures (roof, boiler, parking lot, exteriors) have been made in the last 5 years, and what's planned in the next 2?
- Built in 1942 — when were the roof, HVAC, electrical panel, plumbing, and water heater last replaced?
- What's the actual annual flood-insurance premium (NFIP or private), and is the property in a SFHA with mandatory coverage?
- Why hasn't it sold? Are there any deal-killer items the seller is aware of (foundation, flood, title, zoning, code violations)?
- Is there a deadline driving the sale (1031 exchange, divorce, estate, relocation)? That informs how much negotiation room exists.
- Crime grade is F in this area — have there been break-ins, vandalism, or insurance claims at this property in the last 3 years? What carrier currently insures it and at what premium?
- What's the average days-on-market for RENTAL listings here right now (not sales)? A rising rental-DOM trend means longer vacancies and softer asking-rent achievability than the comps imply.
- What's the recent tenant-quality profile in this submarket — average credit score on applications, eviction rate, late-payment / NSF rate, and stable-employment percentage? A property-management company in the area should have these aggregated.
- How much new apartment / multifamily construction is in the pipeline within 1–3 miles? Heavy new supply (>2% of stock underway) typically softens rents 12–24 months out; light construction supports rent growth.
Investment metrics
- 1% rule
- 1.92% ✓
- Cap rate
- 17.17%
- Cash-on-cash
- 38.86%
- DSCR
- 2.73
- GRM
- 4.3
CMA / ARV
- ARV (on-the-fly)
- $711,954
- Comps found
- 5
Show comp detail 5 sales within ~0.75 mi
| Address | Dist | Beds/Ba | Sqft | Sold | Price | $/sf | Match |
|---|---|---|---|---|---|---|---|
| 1308 Gallaudet St NE | 0.08mi | 4/— | 2,376 (+11%) | 8mo | $770,000 | $324 | 71 |
| 1906 West Virginia Ave NE | 0.11mi | 4/4.0 | 2,024 (-5%) | 22mo | $475,000 | $235 | 67 |
| 1103 Florida Ave NE | 0.70mi | 4/— | 2,288 (+7%) | 0mo | $765,000 | $334 | 55 |
| 1114 Florida Ave NE | 0.67mi | 4/3.0 | 2,040 (-5%) | 7mo | $690,000 | $338 | 51 |
| 1520-1524 Queen St NE | 0.58mi | 4/— | 2,442 (+14%) | 11mo | $814,000 | $333 | 40 |
Match score weights: distance 35% · size 25% · config 20% · recency 20%. Top-matched comps best support the ARV.
Projected returns pro-forma
-3.0% appreciation · 0.0% rent growth · sell at horizon
- IRR
- 31.4%
- Equity multiple
- 2.27×
- Total profit
- $315,018
- Equity at exit
- $132,553
- IRR
- 36.9%
- Equity multiple
- 3.96×
- Total profit
- $736,174
- Equity at exit
- $76,864
Cash invested: $248,920 (down + closing). Projections, not guarantees.
Landlord ↔ Tenant lean methodology
- Overall (CITY)
- 0 Strongly Tenant-Friendly
- State District of Columbia
- 12 Strongly Tenant-Friendly · D+43
- County
- — inherits STATE
- City Washington
- 0 Strongly Tenant-Friendly · D+43
ZIP-level market 20002
- Rents YoY
- -3.0%
- Active inventory
- 548
- Price-to-rent
- 17.4×
Monthly cashflow live
- Estimated rent
- $17,063 high interval (Pro) →
- Mortgage (P&I)
- −$4,662
- Tax from tax record
- −$386 /mo · $4,627/yr
- Insurance
- −$370
- Flood insurance flood zone
- −$66 /mo · $798/yr
- HOA
- −$0
- Vacancy / Maint / Mgmt
- −$3,583
- Net cashflow
- $7,995
Break-even live
4-unit breakdown (identical units grouped — click to expand)
| Units | Beds | Baths | Est. rent |
|---|---|---|---|
| 4× units | 4 | 4 | $17,064 |
| #1 | 4 | 4 | $4,266 |
| #2 | 4 | 4 | $4,266 |
| #3 | 4 | 4 | $4,266 |
| #4 | 4 | 4 | $4,266 |
| Total (4 units) | $17,063 | ||
UW: 25.0% down · 7.5% · 30yr · 1.5% tax · 5.0% vac · 8.0% maint · 8.0% mgmt
Financing live
Cash to close
- Down payment
- $222,250
- Closing costs
- $26,670
- Reserves months
- —
- Total cash needed
- —
Loan-product check · same deal, 3 products live
Conventional
25% down · 7.5% · 30yr
- Down + closing
- —
- Monthly P&I
- —
- Monthly cashflow
- —
- DSCR
- —
- Eligible?
- —
Personal DTI + credit; lowest rate.
DSCR
20% down · 8.5% · 30yr
- Down + closing
- —
- Monthly P&I
- —
- Monthly cashflow
- —
- DSCR
- —
- Eligible?
- —
No personal income docs; deal must DSCR.
Hard money
10% down · 12.0% · 12mo
- Down + closing
- —
- Monthly P&I
- —
- Monthly cashflow
- —
- DSCR
- —
- Eligible?
- —
Short-term bridge; refi at stabilization.
Rent comps 40 comps
| Address | Beds | Baths | Sqft | Rent | $/sqft | DOM | Units | Dist |
|---|---|---|---|---|---|---|---|---|
| 1495 Gallaudet St NE Unit 1495B Washington, DC | 3.0 | 2.5 | 1586 | $4,141 | $2.61 | 24d | 1 | 0.08mi |
| 1916 W Virginia Ave NE Unit 2 Washington, DC | 3.0 | 2.0 | 1800 | $2,900 | $1.61 | 20d | 1 | 0.08mi |
| 1714 Montello Ave NE Washington, DC | 4.0 | 3.0 | 2100 | $4,350 | $2.07 | 24d | 1 | 0.18mi |
| 1255 Raum St NE Unit 1388282P Washington, DC | 2.0–8.0 | 1.0–5.0 | 3245 | $6,967 | $2.15 | 1d | 2 | 0.29mi |
| 1638 Trinidad Ave NE #1 Washington, DC | 3.0 | 2.5 | 1780 | $5,950 | $3.34 | 18d | 1 | 0.36mi |
| 1222 Owen Pl NE Washington, DC | 4.0 | 2.5 | 2164 | $3,800 | $1.76 | 24d | 1 | 0.43mi |
| 1417 Montello Ave NE Washington, DC | 3.0 | 2.5 | 1412 | $4,995 | $3.54 | 24d | 1 | 0.44mi |
| 1157 Oates St NE Unit 1A Washington, DC | 3.0 | 3.0 | 1400 | $4,000 | $2.86 | 24d | 1 | 0.47mi |
| 1331 Queen St NE Washington, DC | 3.0 | 2.0 | 1708 | $4,600 | $2.69 | 17d | 1 | 0.49mi |
| 1331 Queen St NE Washington, DC | 3.0 | 2.0 | 1708 | $4,600 | $2.69 | 15d | 1 | 0.49mi |
| 1334 Downing St NE Washington, DC | 3.0 | 1.0 | 1408 | $3,000 | $2.13 | 24d | 1 | 0.58mi |
| 2218 16th St NE Washington, DC | 4.0 | 2.5 | 1496 | $3,400 | $2.27 | 18d | 1 | 0.59mi |
| 1609 Levis St NE Washington, DC | 4.0 | 4.5 | 2295 | $3,900 | $1.70 | 24d | 1 | 0.60mi |
| 1232 Trinidad Ave NE Unit 1 Washington, DC | 3.0 | 2.5 | 1478 | $4,000 | $2.71 | 24d | 1 | 0.61mi |
| 1169 Morse St NE Washington, DC | 3.0 | 3.0 | 2274 | $4,250 | $1.87 | 4d | 1 | 0.61mi |
| 1640 L St NE Washington, DC | 3.0 | 2.0 | 2300 | $3,700 | $1.61 | 18d | 1 | 0.64mi |
| 1117 Montello Ave NE Washington, DC | 4.0 | 3.5 | 2260 | $4,500 | $1.99 | 24d | 1 | 0.64mi |
| 1417 Downing St NE Washington, DC | 4.0 | 2.0 | 1538 | $4,200 | $2.73 | 4d | 1 | 0.67mi |
| 1103 9th St NE Unit 1 DOWNSTAIRS Washington, DC | 3.0 | 3.5 | 1500 | $3,549 | $2.37 | 24d | 1 | 0.68mi |
| 2300 18th St NE #2300 Washington, DC | 4.0 | 3.0 | 1826 | $4,500 | $2.46 | 22d | 1 | 0.69mi |
| 1704 Montana Ave NE Washington, DC | 4.0 | 2.0 | 1518 | $4,000 | $2.64 | 24d | 1 | 0.69mi |
| 1213 Holbrook St NE #1 Washington, DC | 3.0 | 2.5 | 1618 | $3,850 | $2.38 | 18d | 1 | 0.72mi |
| 2413 14th St NE Washington, DC | 1.0–5.0 | 1.0–2.0 | 1121 | $2,821 | $2.52 | 3d | 46 | 0.74mi |
| 300 Neal Pl NE Washington, DC | 4.0 | 1.0–4.0 | 951 | $6,363 | $6.69 | 1d | 10 | 0.76mi |
| 1006 18th St NE Washington, DC | 3.0 | 2.5 | 1684 | $3,095 | $1.84 | 24d | 1 | 0.76mi |
| 1011 8th St NE Washington, DC | 3.0 | 2.5 | 1672 | $4,495 | $2.69 | 24d | 1 | 0.76mi |
| 1321 I St NE Washington, DC | 4.0 | 3.5 | 1809 | $4,600 | $2.54 | 24d | 1 | 0.76mi |
| 1241 I St NE Washington, DC | 3.0 | 2.5 | 1402 | $4,000 | $2.85 | 24d | 1 | 0.77mi |
| 1209 6th St NE Unit A Washington, DC | 4.0 | 1.5 | 1648 | $3,400 | $2.06 | 24d | 1 | 0.78mi |
| 1113 I St NE Washington, DC | 3.0 | 1.0 | 1800 | $3,325 | $1.85 | 24d | 1 | 0.80mi |
| 1324 H St NE Unit 2 Washington, DC | 4.0 | 1.5 | 2100 | $4,000 | $1.90 | 24d | 1 | 0.80mi |
| 1280 Union St NE Washington, DC | 1.0–3.0 | 1.0–3.0 | 1122 | $8,925 | $7.95 | 1d | 22 | 0.81mi |
| 1501 Harry Thomas Way NE Washington, DC | 3.0 | 1.0–3.0 | 1220 | $5,655 | $4.64 | 2d | 26 | 0.84mi |
| 721 K St NE Washington, DC | 3.0 | 1.0 | 1832 | $4,500 | $2.46 | 24d | 1 | 0.84mi |
| 2129 4th St NE Washington, DC | 4.0 | 3.5 | 2052 | $4,400 | $2.14 | 24d | 1 | 0.90mi |
| 2104 4th St NE #1 Washington, DC | 4.0 | 3.5 | 2165 | $6,150 | $2.84 | 24d | 1 | 0.91mi |
| 1417 G St NE Washington, DC | 3.0 | 2.0 | 1982 | $3,700 | $1.87 | 18d | 1 | 0.92mi |
| 847 20th St NE Washington, DC | 4.0 | 2.5 | 1802 | $4,100 | $2.28 | 12d | 1 | 0.94mi |
| 847 20th St NE Washington, DC | 3.0 | 2.5 | 1802 | $4,100 | $2.28 | 15d | 1 | 0.94mi |
| 301 V St NE Washington, DC | 4.0 | 3.5 | 3000 | $5,650 | $1.88 | 19d | 1 | 0.95mi |
Listing history 34 events
-
2026-06-18days on market $889,000 Active 447 DOM
-
2026-06-17days on market $889,000 Active 446 DOM
-
2026-06-16days on market $889,000 Active 445 DOM
-
2026-06-15days on market $889,000 Active 444 DOM
-
2026-06-13days on market $889,000 Active 442 DOM
-
2026-06-09days on market $889,000 Active 438 DOM
-
2026-06-08days on market $889,000 Active 437 DOM
-
2026-06-07days on market $889,000 Active 436 DOM
-
2026-06-04days on market $889,000 Active 433 DOM
-
2026-06-03days on market $889,000 Active 432 DOM
-
2026-06-02days on market $889,000 Active 431 DOM
-
2026-06-01days on market $889,000 Active 430 DOM
-
2026-05-31days on market $889,000 Active 429 DOM
-
2025-03-29price $889,000
-
2025-03-28$89,900 Active
-
2024-01-24historical
-
2023-10-17status Active
-
2023-10-17historical
-
2023-01-24$899,900 Active
-
2023-01-08$899,900 Active
-
2023-01-08historical
-
2022-11-10historical
-
2022-10-12price $895,000
-
2022-09-25status Active
-
2022-09-10historical
-
2022-08-13price $949,000
-
2021-12-10$1,200,000 Active
-
2020-07-27historical
-
2020-01-24price $799,000
-
2019-12-16price $899,500
-
2019-11-13price $900,500
-
2019-08-06price $1,200,000
-
2019-08-01$900,000 Active
-
1987-01-02soldstatus $68,000
ⓘ Source: listings_history table (triggers on properties + properties_extension) + one-shot
backfill from property_details.listing_events for pre-trigger history.
Tax reassessment forecast DC · Partial reset (capped growth)
- Current annual tax
- $4,627 · $386/mo
- Projected year-2 tax
- $5,025 · $419/mo
- Expected delta
- +$398/yr (+$33/mo · 8.6%)
ⓘ Screening estimate from a state-policy table — verify with the county assessor before closing.
Climate risk First Street
- Flood 7/10 Severe FEMA zone X (unshaded) · 99% chance over 30 yrs
- Wildfire 1/10 Low
- Heat 7/10 Severe 7 d/yr ≥106°F today · 15 d/yr by 30 yrs out
- Wind 4/10 Moderate 19% chance of damaging wind over 30 yrs
- Air quality 4/10 Moderate 4 unhealthy d/yr today · 5 by 30 yrs out
Nearby sold comps map
Loading sold comps map…
Walkable amenities ~0.75 mi
Loading nearby amenities…
Taxation est. · year 1
- Rental income
- $204,756
- − Mortgage interest
- −$49,798
- − Property taxes
- −$4,627
- − Insurance
- −$5,242
- − Repairs & maintenance
- −$16,380
- − Management
- −$16,380
- − Depreciation
- −$25,862
- Taxable income
- $86,466
- Est. tax owed @ 24.0%
- −$20,752
- After-tax cash flow
- $75,192/yr
For passive investors: Depreciation is non-cash, so a rental often shows a tax loss while cash-flowing — sheltering income. Rental losses are passive: they offset passive income freely, and up to $25,000/yr can offset ordinary (W-2) income if you actively participate and your MAGI is under $100k (phasing out to $0 by $150k); unused losses carry forward. On sale, claimed depreciation is recaptured at up to 25%, and gains may owe capital-gains tax (a 1031 exchange can defer both). Figures are a year-1 estimate at your 24.0% rate — not tax advice; consult a CPA.
Schools (NCES district)
- District
- District Of Columbia Public Schools
- NCES district ID
- 1100030
- Math proficiency
- 33% ▲ 3.00%
- Reading proficiency
- 40% ▲ 5.00%
- Median HH income
- $67,671
- Composite
- 35.84/100
- National rank
- #9606
- State rank
- #8 of 32 in DC
Livability — Washington
- Score
- 73/100
- State rank
- #1
- US rank
- #5327
Category grades
Schools grade is shown separately in the Schools card above.
Census & demographics
- Census place
- Washington, DC
- County
- District of Columbia · 671,873 people
- City population
- 671,873
- Metro
- Washington-Arlington-Alexandria, DC-VA-MD-WV
- Population (ZIP)
- 72,397
- Household income
- $120,337
- Rent vs Own
- Severe rent burden
- 3854.0
Population outlook (District of Columbia County) Hauer SSP2
- Today (2025)
- 821,926 people
- By 2030
- 899,517 · +9.4%
- By 2040
- 1,061,162 · +29.1%
- By 2050
- 1,231,493 · +49.8%
- By 2075
- 1,603,312 · +95.1%
- By 2100
- 1,847,141 · +124.7%
Race, ethnicity, and origin ACS 2023
- Neighborhood character
- Diverse neighborhood (Simpson 0.66)
- Race & ethnicity
- White 41% Black 40% Two or more races 9% Hispanic / Latino 9% Asian 3%
- Hispanic origin (detail)
- Mexican 2%
- Common ancestry
- Romanian 3% Lithuanian 2% Italian 2%
- Foreign-born
- 9% · Canada, China, South Korea
- Languages at home
- 87% English-only · Spanish 5% French/Haitian/Cajun 2% Other Indo-European 1%
Political lean MEDSL · District of Columbia
- 2024 margin
- Solid D (+86.1) · D 91.2% · R 5.1% · Other 3.8%
- 2008→2024 swing
- +0.1pp no change · 2008: 85.9pp · 2024: 86.1pp
- All cycles
- 2024: D+86.1 2020: D+86.8 2016: D+88.7 2012: D+84.2 2008: D+85.9
Not yet ingested
- Civics
- —
Market trends
- HPI YoY
- ▼ -852.61%
- Current HPI
- 396.6033
- Rent YoY
- ▼ -3.04%
- Metro
- Washington-Arlington-Alexandria, DC-VA-MD-WV
- State GDP YoY
- ▲ 1.33%
- F500 in state
- 6
Industry mix (Fortune 500 HQ in DC)
| Industry | F500 HQs | Revenue |
|---|---|---|
| Financial Services | 1 | $153B |
|
||
| Life Sciences / Industrials | 1 | $25B |
|
||
| Industrial Machinery | 1 | $8B |
|
||
Price history
+1207.4% since first listed21 events — show timeline
- 2025-03-29 Price Changed $889,000 BRIGHT MLS
- 2025-03-28 Listed $89,900 BRIGHT MLS
- 2024-01-24 Listing Removed — BRIGHT MLS
- 2023-10-17 Relisted — BRIGHT MLS
- 2023-10-17 Listing Removed — BRIGHT MLS
- 2023-01-24 Listed $899,900 BRIGHT MLS
- 2023-01-08 Listing Removed — BRIGHT MLS
- 2023-01-08 Listed $899,900 BRIGHT MLS
- 2022-11-10 Listing Removed — BRIGHT MLS
- 2022-10-12 Price Changed $895,000 BRIGHT MLS
- 2022-09-25 Relisted — BRIGHT MLS
- 2022-09-10 Listing Removed — BRIGHT MLS
- 2022-08-13 Price Changed $949,000 BRIGHT MLS
- 2021-12-10 Listed $1,200,000 BRIGHT MLS
- 2020-07-27 Listing Removed — BRIGHT MLS
- 2020-01-24 Price Changed $799,000 BRIGHT MLS
- 2019-12-16 Price Changed $899,500 BRIGHT MLS
- 2019-11-13 Price Changed $900,500 BRIGHT MLS
- 2019-08-06 Price Changed $1,200,000 BRIGHT MLS
- 2019-08-01 Listed $900,000 BRIGHT MLS
- 1987-01-02 Sold (Public Records) $68,000 Public Records
Property tax history
+4.0%/yrLatest (2025): $4,627 · +1.4% YoY. Source: county tax records.
Cash-flow waterfall
monthlySold comps — $/sqft
last 12 mo · ≤1 miLoading sold comps…