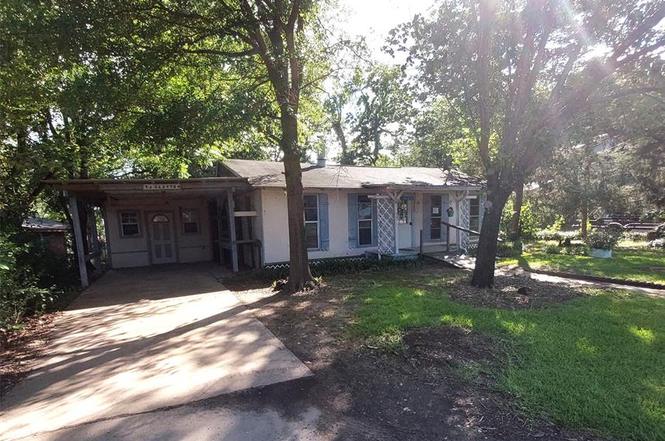
1805 Cherokee Trce · Tool, TX
Flood risk 1/10 · Minimal
- FEMA flood zone
- X (unshaded)
- Chance of flooding over 30 yrs
- 0.0%
- Est. flood insurance / yr
- $507 – $1,088
Fire risk 3/10 · Minor
- Est. fire insurance / yr
- $1,222 – $2,270
Heat risk 7/10 · Major
- Hot days now (above 110°F)
- 7 days/yr
- Hot days in 30 yrs
- 26 days/yr
Wind risk 6/10 · Moderate
- Chance of severe wind over 30 yrs
- 69.0%
Air-quality risk 2/10 · Minimal
- Unhealthy air days now
- 0 days/yr
- Unhealthy air days in 30 yrs
- 1 days/yr
Risk factors via First Street. Map © Google.
Why this score? — see what drove the B grade
The composite is a weighted blend of 9 inputs, each scored 0–100. Each bar is that input's sub-score; the figure is the points it added to the 100-point composite (weight × sub-score).
- Cash flow +30.0/30.0
- 1% rule +10.0/10.0
- DSCR +10.0/10.0
- ARV discount +7.5/15.0
- Schools +4.3/10.0
- Livability +3.3/5.0
- Rent growth +2.5/5.0
- Condition / age +2.5/5.0
- Appreciation +0.0/10.0
$115,000
🖨 Deal sheet (PDF) 📄 Offer letter ✓ Due diligence
Listing remarks
Come check out this great opportunity! Located in Tool, Texas. This 2 bedroom, 2 bath home has a large living room, attached carport, fenced back yard and more. Great location for a weekend getaway near Cedar Creek Lake in the Tradewinds Addition, this property delivers flexibility and potential in a great neighborhood. Located about an hour drive from Dallas, enjoy a quiet setting with convenient access to Cedar Creek Lake and surrounding areas. Cedar Creek Lake is one of the largest lakes in Texas, celebrated for its recreational lifestyle, boating, and bass fishing. Property is being sold as is.
Key facts
- Attached carport
- Fenced back yard
- Great location
Tags
Property features AI
Finance
- Other: Lot is less than 0.5 acre (approximately 0.147 acres); Subdivision: Tradwinds; County: Henderson; Directions: GPS
- Financial info: Listing is Real Estate Owned
- HOA & community: No homeowners association
Exterior
- Parking: Carport (covered, 1 covered space, 1 carport space); No garage spaces
- Utilities: MUD water; MUD sewer; Not in a municipal utility district
- Home design: Single-family residence; Residential property; Built in 1971; One story; Not attached to another property
- Construction: Frame construction; Composition roof; Pillar/post/pier foundation
- Exterior features: Covered patio/porch
Interior
- Kitchen: Dishwasher
- Bedrooms: 2 bedrooms (both on the main level; includes primary bedroom and one additional bedroom)
- Flooring: Carpet; Vinyl
- Bathrooms: 2 full bathrooms
- Interior features: Decorative lighting; One living area; One dining area; 8 total rooms; One-level home
- Laundry & utility: Utility room; Washer hookup
Neighborhood map
What this means for you Summary
Snapshot
- This is a 2-bed/2.0-bath single-family listed at $115k.
Deal economics
- At list price, monthly cash flow is $728 ($9k/yr) — positive.
- The deal already cash-flows at list — no discount required.
- Meets the 1% rule at list price ($2k rent vs $115k).
- Cap rate 13.9% vs local median 2.8% in Tool — top-decile yield for the area; either an underpriced asset or a hidden risk that comps aren't pricing in. Stress-test before assuming the spread holds.
Location & tenants
- Location reads 66/100 on livability (#651 in TX) — a middle-class / working-renter tenant base. Strengths: crime A+, cost of living A+, housing A+; Watch: employment D, amenities F, commute F.
- Malakoff ISD (town): math 48% / reading 54% proficiency, ranked #187 of 826 in TX (top 23%) — acceptable for families but not a draw, mixed tenant base, ~2y average lease; 61% free/reduced lunch — lower-income household profile, screen leases tightly.
- Zoned schools: Malakoff El (math 58% / reading 54%, grade C+, #574 of 4,322 statewide, top 14%, 457 students, 75% FRL); Malakoff Middle (math 48% / reading 54%, grade C, #326 of 1,662 statewide, top 20%, 323 students, 72% FRL); Malakoff H S (math 42% / reading 52%, grade D-, #591 of 1,632 statewide, top 38%, 378 students, 62% FRL).
- Market conditions: 443 active listings in the ZIP; 2 comparable units currently listed for rent nearby; 263 units permitted in Henderson County in 2024 (0 in 5+ unit buildings).
Forward outlook
- Local home prices are declining (-3.0%/yr); year-one equity from $795 of loan paydown is wiped out by about $3k of value loss. Plan a longer hold.
- At projected returns (-3.0% appreciation + 3.0% rent growth), your $32k cash investment doubles in ~5 years — after that, you're playing with house money.
Negotiation context
- Only 8 days on market — expect competitive offers; lowballing is unlikely to land.
Risks & watch-outs
- Climate carrying-cost: major wind risk, 69% chance of damaging wind over 30y; extreme-heat days projected 7→26/yr by 2055 (HVAC capex compounding) — expect insurance premiums to compound above CPI over the hold.
Questions for the listing agent
- Built in 1971 — when were the roof, HVAC, electrical panel, plumbing, and water heater last replaced?
- Is there a deadline driving the sale (1031 exchange, divorce, estate, relocation)? That informs how much negotiation room exists.
- What's the average days-on-market for RENTAL listings here right now (not sales)? A rising rental-DOM trend means longer vacancies and softer asking-rent achievability than the comps imply.
- What's the recent tenant-quality profile in this submarket — average credit score on applications, eviction rate, late-payment / NSF rate, and stable-employment percentage? A property-management company in the area should have these aggregated.
- How much new for-sale + rental construction is in the pipeline within 1–3 miles? Heavy new supply typically softens prices + rents 12–24 months out; constrained supply supports both.
Investment metrics
- 1% rule
- 1.67% ✓
- Cap rate
- 13.89%
- Cash-on-cash
- 27.13%
- DSCR
- 2.21
- GRM
- 5.0
CMA / ARV
- ARV (on-the-fly)
- $378,012
- Comps found
- 7
Show comp detail 7 sales within ~0.75 mi
| Address | Dist | Beds/Ba | Sqft | Sold | Price | $/sf | Match |
|---|---|---|---|---|---|---|---|
| 1801 Scenic Dr | 0.06mi | 3/2.0 (+1) | 1,144 (-1%) | 13mo | $129,999 | $114 | 80 |
| 1525 Oak Shore Dr | 0.17mi | 2/2.0 | 1,204 (+4%) | 22mo | $599,000 | $498 | 67 |
| 1519 Cherokee Trce | 0.19mi | 2/1.0 | 996 (-14%) | 0mo | $179,500 | $180 | 64 |
| 1805 Scenic Dr | 0.07mi | 3/2.0 (+1) | 1,298 (+12%) | 12mo | $425,000 | $327 | 62 |
| 900 Lohaina Ct | 0.40mi | 3/2.0 (+1) | 1,200 (+4%) | 23mo | $450,000 | $375 | 51 |
| 1313 Aloha Rd | 0.52mi | 2/2.0 | 1,280 (+11%) | 11mo | $275,000 | $215 | 49 |
| 2032 Austin Aisle | 0.74mi | 3/2.5 (+1) | 1,040 (-10%) | 23mo | $599,000 | $576 | 23 |
Match score weights: distance 35% · size 25% · config 20% · recency 20%. Top-matched comps best support the ARV.
Projected returns pro-forma
-3.0% appreciation · 3.0% rent growth · sell at horizon
- IRR
- 21.1%
- Equity multiple
- 1.86×
- Total profit
- $27,760
- Equity at exit
- $17,147
- IRR
- 29.3%
- Equity multiple
- 3.61×
- Total profit
- $83,992
- Equity at exit
- $9,943
Cash invested: $32,200 (down + closing). Projections, not guarantees.
Landlord ↔ Tenant lean methodology
- Overall (STATE)
- 87 Strongly Landlord-Friendly
- State Texas
- 87 Strongly Landlord-Friendly · R+5
- County
- — inherits STATE
- City
- — inherits STATE
ZIP-level market 75143
- Home prices YoY
- -11.4%
- Active inventory
- 443
- Price-to-rent
- 5.0×
Monthly cashflow live
- Estimated rent
- $1,926 medium interval (Pro) →
- Mortgage (P&I)
- −$603
- Tax from tax record
- −$143 /mo · $1,711/yr
- Insurance
- −$48
- HOA
- −$0
- Vacancy / Maint / Mgmt
- −$404
- Net cashflow
- $728
Break-even live
Sensitivity live
| Price | -10% $793 | -5% $761 | +0% $728 | +5% $695 | +10% $663 |
|---|---|---|---|---|---|
| Rent | -10% $576 | -5% $652 | +0% $728 | +5% $804 | +10% $880 |
| Rate | -1.0pp $786 | -0.5pp $757 | base $728 | +0.5pp $698 | +1.0pp $668 |
UW: 25.0% down · 7.5% · 30yr · 1.5% tax · 5.0% vac · 8.0% maint · 8.0% mgmt
Financing live
Cash to close
- Down payment
- $28,750
- Closing costs
- $3,450
- Reserves months
- —
- Total cash needed
- —
Loan-product check · same deal, 3 products live
Conventional
25% down · 7.5% · 30yr
- Down + closing
- —
- Monthly P&I
- —
- Monthly cashflow
- —
- DSCR
- —
- Eligible?
- —
Personal DTI + credit; lowest rate.
DSCR
20% down · 8.5% · 30yr
- Down + closing
- —
- Monthly P&I
- —
- Monthly cashflow
- —
- DSCR
- —
- Eligible?
- —
No personal income docs; deal must DSCR.
Hard money
10% down · 12.0% · 12mo
- Down + closing
- —
- Monthly P&I
- —
- Monthly cashflow
- —
- DSCR
- —
- Eligible?
- —
Short-term bridge; refi at stabilization.
Rent comps 2 comps
| Address | Beds | Baths | Sqft | Rent | $/sqft | DOM | Units | Dist |
|---|---|---|---|---|---|---|---|---|
| 1813 Oak Shore Dr Tool, TX | 2.0 | 1.0 | 905 | $1,975 | $2.18 | 45d | 1 | 0.04mi |
| 1933 Island Cir Unit B106 Tool, TX | 1.0 | 1.0 | 719 | $1,350 | $1.88 | 45d | 1 | 0.93mi |
Listing history 7 events
-
2026-06-22days on market $115,000 Active 8 DOM
-
2026-06-19days on market $115,000 Active 5 DOM
-
2026-06-18days on market $115,000 Active 4 DOM
-
2026-06-17days on market $115,000 Active 3 DOM
-
2026-06-16days on market $115,000 Active 2 DOM
-
2026-06-15remarks 605-char remark
-
2026-06-15$115,000 Active 1 DOM
ⓘ Source: listings_history table (triggers on properties + properties_extension) + one-shot
backfill from property_details.listing_events for pre-trigger history.
Tax reassessment forecast TX · Resets to sale price
- Current annual tax
- $1,711 · $143/mo
- Projected year-2 tax
- $2,104 · $175/mo
- Expected delta
- +$394/yr (+$33/mo · 23.0%)
ⓘ Screening estimate from a state-policy table — verify with the county assessor before closing.
Climate risk First Street
- Flood 1/10 Low FEMA zone X (unshaded) · 0% chance over 30 yrs
- Wildfire 3/10 Moderate
- Heat 7/10 Severe 7 d/yr ≥110°F today · 26 d/yr by 30 yrs out
- Wind 6/10 Major 69% chance of damaging wind over 30 yrs
- Air quality 2/10 Low 0 unhealthy d/yr today · 1 by 30 yrs out
Nearby sold comps map
Loading sold comps map…
Walkable amenities ~0.75 mi
Loading nearby amenities…
Taxation est. · year 1
- Rental income
- $23,112
- − Mortgage interest
- −$6,442
- − Property taxes
- −$1,711
- − Insurance
- −$575
- − Repairs & maintenance
- −$1,849
- − Management
- −$1,849
- − Depreciation
- −$3,345
- Taxable income
- $7,341
- Est. tax owed @ 24.0%
- −$1,762
- After-tax cash flow
- $6,974/yr
For passive investors: Depreciation is non-cash, so a rental often shows a tax loss while cash-flowing — sheltering income. Rental losses are passive: they offset passive income freely, and up to $25,000/yr can offset ordinary (W-2) income if you actively participate and your MAGI is under $100k (phasing out to $0 by $150k); unused losses carry forward. On sale, claimed depreciation is recaptured at up to 25%, and gains may owe capital-gains tax (a 1031 exchange can defer both). Figures are a year-1 estimate at your 24.0% rate — not tax advice; consult a CPA.
Schools (NCES district)
- District
- Malakoff ISD
- NCES district ID
- 4828780
- Math proficiency
- 48% ▼ -14.00%
- Reading proficiency
- 54% ▼ -5.00%
- Median HH income
- $38,970
- Composite
- 42.54/100
- National rank
- #3200
- State rank
- #187 of 826 in TX
Livability — Tool
- Score
- 66/100
- State rank
- #651
- US rank
- #12292
Category grades
Schools grade is shown separately in the Schools card above.
Census & demographics
- Census place
- Tool, TX
- Population (ZIP)
- 14,676
Population outlook (Henderson County) Hauer SSP2
- Today (2025)
- 80,471 people
- By 2030
- 80,608 · +0.2%
- By 2040
- 80,087 · -0.5%
- By 2050
- 78,208 · -2.8%
- By 2075
- 72,423 · -10.0%
- By 2100
- 61,012 · -24.2%
Race, ethnicity, and origin ACS 2023
- Neighborhood character
- Predominantly White (80%)
- Race & ethnicity
- White 80% Hispanic / Latino 13% Two or more races 8% Black 2%
- Hispanic origin (detail)
- Mexican 13%
- Common ancestry
- Italian 2% Iranian 2% Lithuanian 1%
- Foreign-born
- 4% · Canada, China
- Languages at home
- 90% English-only · Spanish 9%
Political lean MEDSL · Henderson
- 2024 margin
- Solid R (+63.5) · D 18.0% · R 81.4%
- 2008→2024 swing
- -18.8pp toward R · 2008: -44.6pp · 2024: -63.5pp
- All cycles
- 2024: R+63.5 2020: R+60.2 2016: R+60.0 2012: R+54.8 2008: R+44.6
Not yet ingested
- Civics
- —
Market trends
- HPI YoY
- ▼ -42.99%
- Current HPI
- 332.57
- Rent YoY
- —
- Metro
- —
- State GDP YoY
- ▲ 3.95%
- F500 in state
- 110
Industry mix (Fortune 500 HQ in TX)
| Industry | F500 HQs | Revenue |
|---|---|---|
| Energy | 16 | $1,198B |
|
||
| Technology | 5 | $198B |
|
||
| Engineering / Construction | 4 | $72B |
|
||
| Energy Services | 3 | $60B |
|
||
| Utilities | 3 | $41B |
|
||
| Healthcare | 2 | $330B |
|
||
Price history
4 events — show timeline
- 2026-06-12 Listed $115,000 NTREIS
- 2010-11-02 Sold (Public Records) — Public Records
- 2009-09-16 Sold (Public Records) — Public Records
- 2000-08-02 Sold (Public Records) — Public Records
Property tax history
+3.7%/yrLatest (2025): $1,711 · +13.3% YoY. Source: county tax records.
Cash-flow waterfall
monthlySold comps — $/sqft
last 12 mo · ≤1 miLoading sold comps…