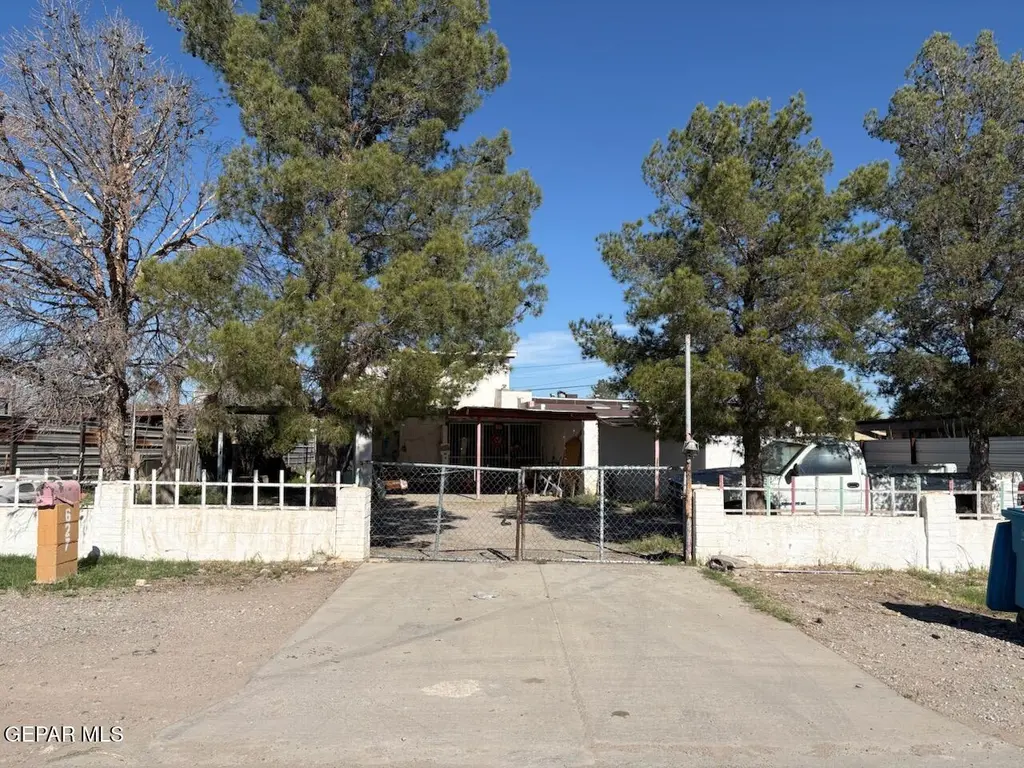
627 Milo Dr · Socorro, TX
Flood risk 1/10 · Minimal
- FEMA flood zone
- —
- Chance of flooding over 30 yrs
- 0.0%
- Est. flood insurance / yr
- —
Fire risk 1/10 · Minimal
- Est. fire insurance / yr
- $1,222 – $2,270
Heat risk 6/10 · Moderate
- Hot days now (above 101°F)
- 7 days/yr
- Hot days in 30 yrs
- 25 days/yr
Wind risk 1/10 · Minimal
- Chance of severe wind over 30 yrs
- —
Air-quality risk 2/10 · Minimal
- Unhealthy air days now
- 0 days/yr
- Unhealthy air days in 30 yrs
- 1 days/yr
Risk factors via First Street. Map © Google.
Why this score? — see what drove the B grade
The composite is a weighted blend of 9 inputs, each scored 0–100. Each bar is that input's sub-score; the figure is the points it added to the 100-point composite (weight × sub-score).
- Cash flow +30.0/30.0
- 1% rule +10.0/10.0
- DSCR +10.0/10.0
- ARV discount +7.5/15.0
- Appreciation +4.5/10.0
- Rent growth +3.8/5.0
- Livability +3.2/5.0
- Schools +2.6/10.0
- Condition / age +2.5/5.0
$80,000
🖨 Deal sheet 📄 Offer letter ✓ Due diligence
Listing remarks MLS
Investment Opportunity. This property sold as is. It is a manufactured home with an attached home. Needs TLC but has potential.
Key facts
- 9,738 sq ft lot
- Built 1973
- Listed 8 days
Neighborhood map
What this means for you Summary
Snapshot
- This is a 4-bed/1.5-bath single-family listed at $80k.
Deal economics
- At list price, monthly cash flow is $1k ($12k/yr) — positive.
- The deal already cash-flows at list — no discount required.
- Meets the 1% rule at list price ($2k rent vs $80k).
Location & tenants
- Location reads 63/100 on livability (#830 in TX) — a middle-class / working-renter tenant base. Strengths: crime A+, cost of living A+, housing A+; Watch: schools F, amenities F, commute F.
- Socorro ISD (urban): math 23% / reading 36% proficiency, ranked #624 of 826 in TX (top 76%) — low school quality limits family demand, transient renter base, plan for 1-2y turnover; 66% free/reduced lunch — lower-income household profile, screen leases tightly.
- Market conditions: Rents rising fast (+5.3%/yr); 219 active listings in the ZIP; 3 comparable units currently listed for rent nearby; rentals at typical pace (median 15d on market — plan ~3-4 weeks tenant-placement turnaround); 2,196 units permitted in El Paso County in 2024 (143 in 5+ unit buildings).
- This rent runs 45% of the median local income ($54k/yr) — at the standard rent-burdened threshold; future hikes will face affordability resistance.
Forward outlook
- Local home prices are declining (-0.9%/yr); year-one equity from $553 of loan paydown is wiped out by about $746 of value loss. Plan a longer hold.
- El Paso County population projected at +10% by 2050 — modest demand growth; plan on rents tracking national, not racing it.
- At projected returns (-0.9% appreciation + 5.3% rent growth), your $22k cash investment doubles in ~2 years — after that, you're playing with house money.
Negotiation context
- Only 8 days on market — expect competitive offers; lowballing is unlikely to land.
Risks & watch-outs
- Climate carrying-cost: extreme-heat days projected 7→25/yr by 2055 (HVAC capex compounding) — expect insurance premiums to compound above CPI over the hold.
Questions for the listing agent
- Built in 1973 — when were the roof, HVAC, electrical panel, plumbing, and water heater last replaced?
- Is there a deadline driving the sale (1031 exchange, divorce, estate, relocation)? That informs how much negotiation room exists.
- Schools are F-rated, which usually means shorter tenancies and higher turnover. Who's the typical renter profile here, and what's been the actual vacancy rate?
- What's the average days-on-market for RENTAL listings here right now (not sales)? A rising rental-DOM trend means longer vacancies and softer asking-rent achievability than the comps imply.
- What's the recent tenant-quality profile in this submarket — average credit score on applications, eviction rate, late-payment / NSF rate, and stable-employment percentage? A property-management company in the area should have these aggregated.
- How much new for-sale + rental construction is in the pipeline within 1–3 miles? Heavy new supply typically softens prices + rents 12–24 months out; constrained supply supports both.
Investment metrics
- 1% rule
- 2.51% ✓
- Cap rate
- 21.78%
- Cash-on-cash
- 55.30%
- DSCR
- 3.46
- GRM
- 3.3
CMA / ARV
No comps found within radius.
Projected returns pro-forma
-0.93% appreciation · 5.29% rent growth · sell at horizon
- IRR
- 58.3%
- Equity multiple
- 3.89×
- Total profit
- $64,720
- Equity at exit
- $19,566
- IRR
- 62.3%
- Equity multiple
- 8.51×
- Total profit
- $168,238
- Equity at exit
- $20,764
Cash invested: $22,400 (down + closing). Projections, not guarantees.
Landlord ↔ Tenant lean methodology
- Overall (STATE)
- 87 Strongly Landlord-Friendly
- State Texas
- 87 Strongly Landlord-Friendly · R+5
- County
- — inherits STATE
- City
- — inherits STATE
ZIP-level market 79927
- Home prices YoY
- -0.4%
- Rents YoY
- 5.3%
- Active inventory
- 219
- Price-to-rent
- 3.3×
Monthly cashflow live
- Estimated rent
- $2,006 medium interval (Pro) →
- Mortgage (P&I)
- −$420
- Tax est. 1.5%
- −$100 /mo · $1,200/yr
- Insurance
- −$33
- HOA
- −$0
- Vacancy / Maint / Mgmt
- −$421
- Net cashflow
- $1,032
Break-even live
UW: 25.0% down · 7.5% · 30yr · 1.5% tax · 5.0% vac · 8.0% maint · 8.0% mgmt
Financing live
Cash to close
- Down payment
- $20,000
- Closing costs
- $2,400
- Reserves months
- —
- Total cash needed
- —
Loan-product check · same deal, 3 products live
Conventional
25% down · 7.5% · 30yr
- Down + closing
- —
- Monthly P&I
- —
- Monthly cashflow
- —
- DSCR
- —
- Eligible?
- —
Personal DTI + credit; lowest rate.
DSCR
20% down · 8.5% · 30yr
- Down + closing
- —
- Monthly P&I
- —
- Monthly cashflow
- —
- DSCR
- —
- Eligible?
- —
No personal income docs; deal must DSCR.
Hard money
10% down · 12.0% · 12mo
- Down + closing
- —
- Monthly P&I
- —
- Monthly cashflow
- —
- DSCR
- —
- Eligible?
- —
Short-term bridge; refi at stabilization.
Rent comps 3 comps
| Address | Beds | Baths | Sqft | Rent | $/sqft | DOM | Units | Dist |
|---|---|---|---|---|---|---|---|---|
| 780 Clems Rd Unit 6 Socorro, TX | 4.0 | 3.0 | 2535 | $1,850 | $0.73 | 43d | 1 | 0.44mi |
| 11293 Cielo Mar Dr El Paso, TX | 4.0 | 2.5 | 1917 | $2,000 | $1.04 | 14d | 1 | 1.20mi |
| 629 David Ortiz St El Paso, TX | 3.0 | 2.0 | 1447 | $1,750 | $1.21 | 3d | 1 | 1.49mi |
Listing history 14 events
-
2026-06-18days on market $80,000 Active 8 DOM
-
2026-06-17days on market $80,000 Active 7 DOM
-
2026-06-16days on market $80,000 Active 6 DOM
-
2026-06-15days on market $80,000 Active 5 DOM
-
2026-06-13pricedays on market $80,000 Active 3 DOM
-
2026-06-09days on market $99,000 Active 170 DOM
-
2026-06-08days on market $99,000 Active 169 DOM
-
2026-06-07days on market $99,000 Active 168 DOM
-
2026-06-05statusdays on market $99,000 Active 165 DOM
-
2026-04-21price $99,000 129-char remark
Show marketing remark (129 chars)
Investment Opportunity. This property sold as is. It is a manufactured home with an attached home. Needs TLC but has potential.
-
2026-03-11price $120,000 129-char remark
Show marketing remark (129 chars)
Investment Opportunity. This property sold as is. It is a manufactured home with an attached home. Needs TLC but has potential.
-
2026-02-25price $130,000 129-char remark
Show marketing remark (129 chars)
Investment Opportunity. This property sold as is. It is a manufactured home with an attached home. Needs TLC but has potential.
-
2025-12-16$150,000 Active 129-char remark
Show marketing remark (129 chars)
Investment Opportunity. This property sold as is. It is a manufactured home with an attached home. Needs TLC but has potential.
-
1983-04-06soldstatus
ⓘ Source: listings_history table (triggers on properties + properties_extension) + one-shot
backfill from property_details.listing_events for pre-trigger history.
Climate risk First Street
- Flood 1/10 Low 0% chance over 30 yrs
- Wildfire 1/10 Low
- Heat 6/10 Major 7 d/yr ≥101°F today · 25 d/yr by 30 yrs out
- Wind 1/10 Low
- Air quality 2/10 Low 0 unhealthy d/yr today · 1 by 30 yrs out
Nearby sold comps map
Loading sold comps map…
Walkable amenities ~0.75 mi
Loading nearby amenities…
Taxation est. · year 1
- Rental income
- $24,078
- − Mortgage interest
- −$4,481
- − Property taxes
- −$1,200
- − Insurance
- −$400
- − Repairs & maintenance
- −$1,926
- − Management
- −$1,926
- − Depreciation
- −$2,327
- Taxable income
- $11,817
- Est. tax owed @ 24.0%
- −$2,836
- After-tax cash flow
- $9,551/yr
For passive investors: Depreciation is non-cash, so a rental often shows a tax loss while cash-flowing — sheltering income. Rental losses are passive: they offset passive income freely, and up to $25,000/yr can offset ordinary (W-2) income if you actively participate and your MAGI is under $100k (phasing out to $0 by $150k); unused losses carry forward. On sale, claimed depreciation is recaptured at up to 25%, and gains may owe capital-gains tax (a 1031 exchange can defer both). Figures are a year-1 estimate at your 24.0% rate — not tax advice; consult a CPA.
Schools (NCES district)
- District
- Socorro ISD
- NCES district ID
- 4840710
- Math proficiency
- 23% ▼ -34.00%
- Reading proficiency
- 36% ▼ -14.00%
- Median HH income
- $49,318
- Composite
- 25.67/100
- National rank
- #7396
- State rank
- #624 of 826 in TX
Livability — Socorro
- Score
- 63/100
- State rank
- #830
- US rank
- #14960
Category grades
Schools grade is shown separately in the Schools card above.
Census & demographics
- Census place
- Socorro, TX
- County
- El Paso County · 761,266 people
- City population
- 44,444
- Metro
- El Paso, TX
- Population (ZIP)
- 44,444
- Household income
- $53,652
- Rent vs Own
- Severe rent burden
- 732.0
Population outlook (El Paso County) Hauer SSP2
- Today (2025)
- 897,899 people
- By 2030
- 922,694 · +2.8%
- By 2040
- 960,492 · +7.0%
- By 2050
- 982,919 · +9.5%
- By 2075
- 997,266 · +11.1%
- By 2100
- 900,630 · +0.3%
Race, ethnicity, and origin ACS 2023
- Neighborhood character
- Predominantly Hispanic (97%)
- Race & ethnicity
- Hispanic / Latino 97% Two or more races 39% Native American 2% White 2%
- Hispanic origin (detail)
- Mexican 94%
- Foreign-born
- 34% · Canada
- Languages at home
- 16% English-only · Spanish 84%
Political lean MEDSL · El Paso
- 2024 margin
- D (+15.1) · D 57.0% · R 41.8% · Other 1.2%
- 2008→2024 swing
- -17.4pp toward R · 2008: 32.5pp · 2024: 15.1pp
- All cycles
- 2024: D+15.1 2020: D+35.1 2016: D+43.2 2012: D+32.6 2008: D+32.5
Not yet ingested
- Civics
- —
Market trends
- HPI YoY
- ▼ -0.93%
- Current HPI
- 239.646
- Rent YoY
- ▲ 5.29%
- Metro
- El Paso, TX
- State GDP YoY
- ▲ 3.95%
- F500 in state
- 110
Industry mix (Fortune 500 HQ in TX)
| Industry | F500 HQs | Revenue |
|---|---|---|
| Energy | 16 | $1,198B |
|
||
| Technology | 5 | $198B |
|
||
| Engineering / Construction | 4 | $72B |
|
||
| Energy Services | 3 | $60B |
|
||
| Utilities | 3 | $41B |
|
||
| Healthcare | 2 | $330B |
|
||
Price history
-34.0% since first listed5 events — show timeline
- 2026-04-21 Price Changed $99,000 GEPARMLS
- 2026-03-11 Price Changed $120,000 GEPARMLS
- 2026-02-25 Price Changed $130,000 GEPARMLS
- 2025-12-16 Listed $150,000 GEPARMLS
- 1983-04-06 Sold (Public Records) — Public Records
Property tax history
+11.5%/yrLatest (2025): $6,218 · -1.9% YoY. Source: county tax records.
Cash-flow waterfall
monthlySold comps — $/sqft
last 12 mo · ≤1 miLoading sold comps…