12437 S Crystal Ave · Odessa, TX
Flood risk 5/10 · Moderate
- FEMA flood zone
- X (unshaded)
- Chance of flooding over 30 yrs
- 0.6%
- Est. flood insurance / yr
- $507 – $1,088
Fire risk 6/10 · Moderate
- Est. fire insurance / yr
- $1,222 – $2,270
Heat risk 6/10 · Moderate
- Hot days now (above 102°F)
- 7 days/yr
- Hot days in 30 yrs
- 21 days/yr
Wind risk 2/10 · Minimal
- Chance of severe wind over 30 yrs
- 4.0%
Air-quality risk 1/10 · Minimal
- Unhealthy air days now
- 0 days/yr
- Unhealthy air days in 30 yrs
- 0 days/yr
Risk factors via First Street. Map © Google.
Why this score? — see what drove the B grade
The composite is a weighted blend of 9 inputs, each scored 0–100. Each bar is that input's sub-score; the figure is the points it added to the 100-point composite (weight × sub-score).
- Cash flow +30.0/30.0
- DSCR +10.0/10.0
- 1% rule +8.1/10.0
- ARV discount +7.5/15.0
- Appreciation +7.5/10.0
- Livability +3.8/5.0
- Rent growth +2.5/5.0
- Condition / age +2.5/5.0
- Schools +2.2/10.0
$195,000
🖨 Deal sheet 📄 Offer letter ✓ Due diligence
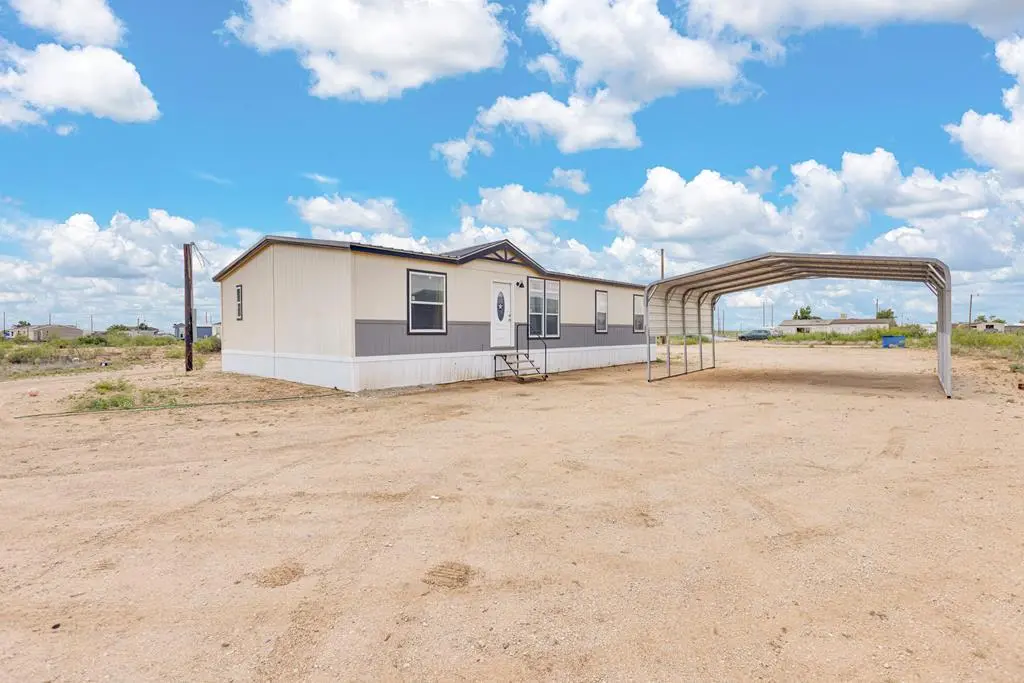
Listing remarks
Located just South of Odessa, offering blend of modern style and comfortable living. Spacious 4-bed 2-bath home features an open concept layout designed for both living and entertaining. No carpet, making it easy to maintenance. Enjoy peaceful country living with room to make it your own.
Key facts
- 0.3 acre lot
- Garage
- Built 2023
Property features AI
Exterior
- Parking: 1 total parking space; 1 covered parking space; Detached carport
- Utilities: Well water; Septic tank; Propane service
- Home design: Single family residence; Double wide mobile home body type
- Construction: Composition roof; Pillar/post/pier foundation; Built as double wide
- Exterior features: No additional exterior features listed; Corner lot; County road frontage; Solar panels
Interior
- Kitchen: Electric range; Electric cooktop; Microwave; Dishwasher; Electric water heater
- Flooring: Laminate
- Bathrooms: 2 full bathrooms
- Heating & cooling: Central heating (electric); Central electric air conditioning
- Interior features: Skylights; Window blinds; No fireplace listed
- Laundry & utility: Dryer
Neighborhood map
What this means for you Summary
Snapshot
- This is a 4-bed/2.0-bath other listed at $195k.
Deal economics
- At list price, monthly cash flow is $874 ($10k/yr) — positive.
- The deal already cash-flows at list — no discount required.
- Meets the 1% rule at list price ($3k rent vs $195k).
- Recommended offer: $189k (3.0% below list) — sets the bar for market timing.
Location & tenants
- Location reads 75/100 on livability (#132 in TX, #3,928 nationally) — a middle-class / working-renter tenant base. Strengths: cost of living A+, housing A+, health & safety A+; Watch: commute D+, amenities D.
- Ector County ISD (urban): math 22% / reading 27% proficiency, ranked #707 of 826 in TX (top 86%) — low school quality limits family demand, transient renter base, plan for 1-2y turnover.
- Zoned schools: Lauro Cavazos El (math 12% / reading 15%, grade F, #4,138 of 4,322 statewide, top 96%, 680 students, 83% FRL); Bonham Middle (math 9% / reading 16%, grade F, #1,616 of 1,662 statewide, top 97%, 867 students, 65% FRL); Permian H S (math 19% / reading 29%, grade F, #1,333 of 1,632 statewide, top 82%, 3,978 students, 51% FRL).
- Market conditions: 78 active listings in the ZIP; 1,004 units permitted in Ector County in 2024 (0 in 5+ unit buildings).
Forward outlook
- In year one you build about $11k of equity ($1k loan paydown + $10k appreciation (4.9% local appreciation)).
- Ector County population projected at +78% by 2050 — long-run rental-demand tailwind backs the buy-and-hold thesis.
- At projected returns (4.9% appreciation + 3.0% rent growth), your $55k cash investment doubles in ~3 years — after that, you're playing with house money.
- By year 4, paydown + projected appreciation supports a ~$37k cash-out refi (75% LTV) — recoverable capital for the next deal without selling this one.
Negotiation context
- It's been on market 46 days — a 3% lower offer ($189k) is reasonable based on typical stale-listing flexibility.
Risks & watch-outs
- Climate carrying-cost: moderate flood risk; major wildfire risk; extreme-heat days projected 7→21/yr by 2055 (HVAC capex compounding) — expect insurance premiums to compound above CPI over the hold.
Questions for the listing agent
- It's been on market 46 days. Have you received any prior offers? Is the seller open to a 3% concession, seller financing, or rate buy-down credit?
- Is there a deadline driving the sale (1031 exchange, divorce, estate, relocation)? That informs how much negotiation room exists.
- Schools are F-rated, which usually means shorter tenancies and higher turnover. Who's the typical renter profile here, and what's been the actual vacancy rate?
- What's the average days-on-market for RENTAL listings here right now (not sales)? A rising rental-DOM trend means longer vacancies and softer asking-rent achievability than the comps imply.
- What's the recent tenant-quality profile in this submarket — average credit score on applications, eviction rate, late-payment / NSF rate, and stable-employment percentage? A property-management company in the area should have these aggregated.
- How much new for-sale + rental construction is in the pipeline within 1–3 miles? Heavy new supply typically softens prices + rents 12–24 months out; constrained supply supports both.
Investment metrics
- 1% rule
- 1.31% ✓
- Cap rate
- 11.67%
- Cash-on-cash
- 19.21%
- DSCR
- 1.85
- GRM
- 6.4
CMA / ARV
No comps found within radius.
Projected returns pro-forma
4.91% appreciation · 3.0% rent growth · sell at horizon
- IRR
- 29.4%
- Equity multiple
- 2.82×
- Total profit
- $99,524
- Equity at exit
- $109,425
- IRR
- 28.2%
- Equity multiple
- 5.64×
- Total profit
- $253,072
- Equity at exit
- $187,967
Cash invested: $54,600 (down + closing). Projections, not guarantees.
Landlord ↔ Tenant lean methodology
- Overall (STATE)
- 87 Strongly Landlord-Friendly
- State Texas
- 87 Strongly Landlord-Friendly · R+5
- County
- — inherits STATE
- City
- — inherits STATE
ZIP-level market 79766
- Home prices YoY
- 2.3%
- Active inventory
- 78
- Price-to-rent
- 6.4×
Monthly cashflow live
- Estimated rent
- $2,549 medium interval (Pro) →
- Mortgage (P&I)
- −$1,023
- Tax from tax record
- −$36 /mo · $427/yr
- Insurance
- −$81
- HOA
- −$0
- Vacancy / Maint / Mgmt
- −$535
- Net cashflow
- $874
Break-even live
UW: 25.0% down · 7.5% · 30yr · 1.5% tax · 5.0% vac · 8.0% maint · 8.0% mgmt
Financing live
Cash to close
- Down payment
- $48,750
- Closing costs
- $5,850
- Reserves months
- —
- Total cash needed
- —
Loan-product check · same deal, 3 products live
Conventional
25% down · 7.5% · 30yr
- Down + closing
- —
- Monthly P&I
- —
- Monthly cashflow
- —
- DSCR
- —
- Eligible?
- —
Personal DTI + credit; lowest rate.
DSCR
20% down · 8.5% · 30yr
- Down + closing
- —
- Monthly P&I
- —
- Monthly cashflow
- —
- DSCR
- —
- Eligible?
- —
No personal income docs; deal must DSCR.
Hard money
10% down · 12.0% · 12mo
- Down + closing
- —
- Monthly P&I
- —
- Monthly cashflow
- —
- DSCR
- —
- Eligible?
- —
Short-term bridge; refi at stabilization.
Listing history 17 events
-
2026-06-19days on market $195,000 Active 46 DOM
-
2026-06-18days on market $195,000 Active 45 DOM
-
2026-06-17days on market $195,000 Active 44 DOM
-
2026-06-16days on market $195,000 Active 43 DOM
-
2026-06-15days on market $195,000 Active 42 DOM
-
2026-06-14days on market $195,000 Active 40 DOM
-
2026-06-13days on market $195,000 Active 39 DOM
-
2026-06-10days on market $195,000 Active 37 DOM
-
2026-06-09days on market $195,000 Active 36 DOM
-
2026-06-08days on market $195,000 Active 35 DOM
-
2026-06-07days on market $195,000 Active 34 DOM
-
2026-06-03days on market $195,000 Active 29 DOM
-
2026-06-01days on market $195,000 Active 28 DOM
-
2026-05-31days on market $195,000 Active 27 DOM
-
2026-05-30days on market $195,000 Active 26 DOM
-
2026-05-04$195,000 Active 289-char remark
-
2023-04-12soldstatus
ⓘ Source: listings_history table (triggers on properties + properties_extension) + one-shot
backfill from property_details.listing_events for pre-trigger history.
Tax reassessment forecast TX · Resets to sale price
- Current annual tax
- $427 · $36/mo
- Projected year-2 tax
- $3,568 · $297/mo
- Expected delta
- +$3,141/yr (+$262/mo · 734.8%)
ⓘ Screening estimate from a state-policy table — verify with the county assessor before closing.
Climate risk First Street
- Flood 5/10 Major FEMA zone X (unshaded) · 60% chance over 30 yrs
- Wildfire 6/10 Major
- Heat 6/10 Major 7 d/yr ≥102°F today · 21 d/yr by 30 yrs out
- Wind 2/10 Low 4% chance of damaging wind over 30 yrs
- Air quality 1/10 Low 0 unhealthy d/yr today · 0 by 30 yrs out
Nearby sold comps map
Loading sold comps map…
Walkable amenities ~0.75 mi
Loading nearby amenities…
Taxation est. · year 1
- Rental income
- $30,589
- − Mortgage interest
- −$10,923
- − Property taxes
- −$427
- − Insurance
- −$975
- − Repairs & maintenance
- −$2,447
- − Management
- −$2,447
- − Depreciation
- −$5,673
- Taxable income
- $7,696
- Est. tax owed @ 24.0%
- −$1,847
- After-tax cash flow
- $8,644/yr
For passive investors: Depreciation is non-cash, so a rental often shows a tax loss while cash-flowing — sheltering income. Rental losses are passive: they offset passive income freely, and up to $25,000/yr can offset ordinary (W-2) income if you actively participate and your MAGI is under $100k (phasing out to $0 by $150k); unused losses carry forward. On sale, claimed depreciation is recaptured at up to 25%, and gains may owe capital-gains tax (a 1031 exchange can defer both). Figures are a year-1 estimate at your 24.0% rate — not tax advice; consult a CPA.
Schools (NCES district)
- District
- Ector County ISD
- NCES district ID
- 4818000
- Math proficiency
- 22% ▼ -9.00%
- Reading proficiency
- 27% ▼ -4.00%
- Median HH income
- $52,740
- Composite
- 21.89/100
- National rank
- #8233
- State rank
- #707 of 826 in TX
Livability — Odessa
- Score
- 75/100
- State rank
- #132
- US rank
- #3928
Category grades
Schools grade is shown separately in the Schools card above.
Census & demographics
- City population
- 131,169
- Population (ZIP)
- 10,712
Population outlook (Ector County) Hauer SSP2
- Today (2025)
- 212,765 people
- By 2030
- 241,962 · +13.7%
- By 2040
- 306,582 · +44.1%
- By 2050
- 379,755 · +78.5%
- By 2075
- 568,991 · +167.4%
- By 2100
- 709,829 · +233.6%
Race, ethnicity, and origin ACS 2023
- Neighborhood character
- Predominantly Hispanic (68%)
- Race & ethnicity
- Hispanic / Latino 68% White 25% Two or more races 24% Black 3% Native American 2%
- Hispanic origin (detail)
- Mexican 63% Cuban 2%
- Common ancestry
- Slovak 5% Serbian 4% Lithuanian 1%
- Foreign-born
- 22% · Canada, Jamaica
- Languages at home
- 36% English-only · Spanish 63%
Political lean MEDSL · Ector
- 2024 margin
- Solid R (+52.9) · D 23.2% · R 76.1%
- 2008→2024 swing
- -4.9pp toward R · 2008: -48.0pp · 2024: -52.9pp
- All cycles
- 2024: R+52.9 2020: R+47.8 2016: R+40.6 2012: R+48.9 2008: R+48.0
Not yet ingested
- Civics
- —
Market trends
- HPI YoY
- ▲ 4.91%
- Current HPI
- 222.3497
- Rent YoY
- —
- Metro
- —
- State GDP YoY
- ▲ 3.95%
- F500 in state
- 110
Industry mix (Fortune 500 HQ in TX)
| Industry | F500 HQs | Revenue |
|---|---|---|
| Energy | 16 | $1,198B |
|
||
| Technology | 5 | $198B |
|
||
| Engineering / Construction | 4 | $72B |
|
||
| Energy Services | 3 | $60B |
|
||
| Utilities | 3 | $41B |
|
||
| Healthcare | 2 | $330B |
|
||
Price history
2 events — show timeline
- 2026-05-04 Listed $195,000 ODMLS
- 2023-04-12 Sold (Public Records) — Public Records
Property tax history
+27.0%/yrLatest (2025): $427 · +28.2% YoY. Source: county tax records.
Cash-flow waterfall
monthlySold comps — $/sqft
last 12 mo · ≤1 miLoading sold comps…