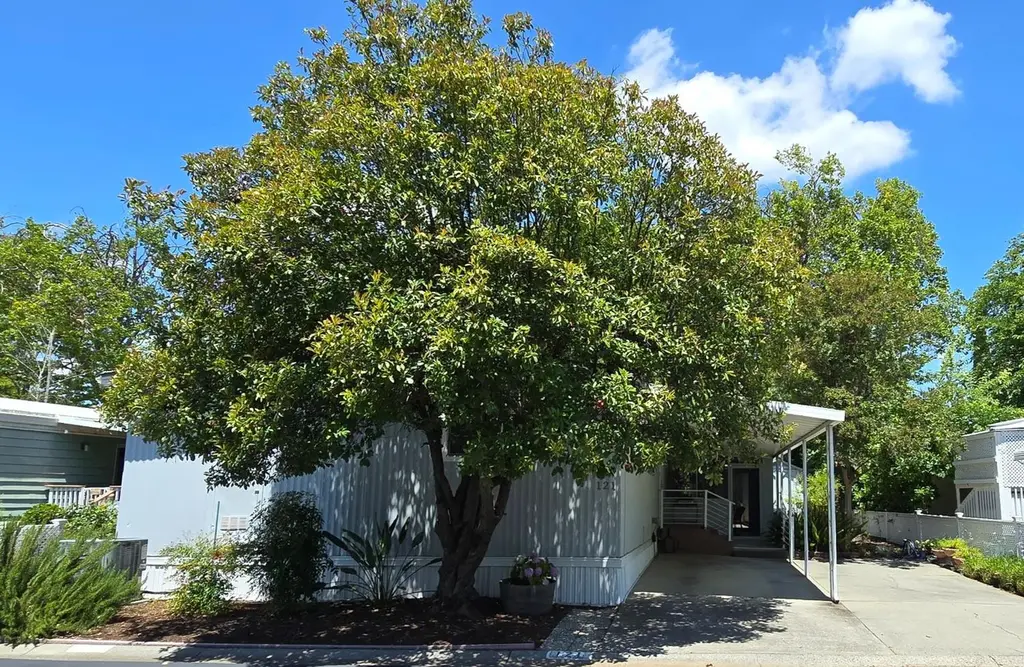
121 Full Cir · Davis, CA
Flood risk 3/10 · Minor
- FEMA flood zone
- X (unshaded)
- Chance of flooding over 30 yrs
- 0.07%
- Est. flood insurance / yr
- $507 – $1,088
Fire risk 3/10 · Minor
- Est. fire insurance / yr
- $659 – $1,223
Heat risk 6/10 · Moderate
- Hot days now (above 103°F)
- 6 days/yr
- Hot days in 30 yrs
- 13 days/yr
Wind risk 1/10 · Minimal
- Chance of severe wind over 30 yrs
- —
Air-quality risk 10/10 · Severe
- Unhealthy air days now
- 27 days/yr
- Unhealthy air days in 30 yrs
- 29 days/yr
Risk factors via First Street. Map © Google.
Why this score? — see what drove the C+ grade
The composite is a weighted blend of 9 inputs, each scored 0–100. Each bar is that input's sub-score; the figure is the points it added to the 100-point composite (weight × sub-score).
- Cash flow +22.0/30.0
- ARV discount +10.3/15.0
- Schools +7.1/10.0
- DSCR +7.0/10.0
- 1% rule +5.8/10.0
- Condition / age +4.0/5.0
- Livability +3.9/5.0
- Rent growth +2.3/5.0
- Appreciation +0.0/10.0
$239,000
🖨 Deal sheet 📄 Offer letter ✓ Due diligence
Listing remarks
Experience comfortable living in the highly regarded Rancho Yolo Senior Community, one of Davis's most desirable active adult neighborhoods. This well-maintained manufactured home offers two bedrooms and two bathrooms in a functional and inviting layout. Bright and spacious living room and dining area with a welcoming atmosphere. Conveniently designed kitchen with easy access to main living spaces. Primary bedroom with walk in closet and an in-suite bathroom. Thoughtfully arranged floor plan for comfort and livability. Rancho Yolo offers a vibrant lifestyle with a wide range of amenities: Clubhouse for gatherings and activities. Two swimming pools, including an adult-only pool with hot tub.
Key facts
- Adult only pool
- In suite bathroom
- Walk in closet
Tags
Property features AI
Finance
- Financial info: Land lease: Yes — $850
- HOA & community: Not part of an association; Senior community
Exterior
- Parking: 2 parking spaces; Off-street parking; Covered parking; Guest parking available
- Utilities: Cable available; Individual electric meter; Individual gas meter; Public water; Public sewer
- Home design: Manufactured in park (double wide); Updated/remodeled; Vinyl skirting; Bendex make; Built in 1974
- Construction: Shingle and metal roof
- Exterior features: Patio awning; Carport awning; Backyard; Close to clubhouse; Regular-shaped lot; Front and back landscaping; Shed(s)
Interior
- Kitchen: Free standing gas range; Free standing refrigerator; Dishwasher; Disposal; Microwave; Pantry closet
- Bedrooms: 2 bedrooms
- Flooring: Simulated wood flooring
- Bathrooms: 2 full bathrooms; Tub with shower over; Shower stall(s)
- Heating & cooling: Central heating; Central cooling; Ceiling fan(s)
- Interior features: Screened-in patio; Dual-pane full windows; Pantry closet; Formal dining area; Living room with additional features
- Laundry & utility: Laundry closet with electric and gas hook-up; Stacked washer/dryer included; 220V in laundry
Neighborhood map
What this means for you Summary
Snapshot
- This is a 2-bed/2.0-bath manufactured listed at $239k. Condition is rated good.
Deal economics
- At list price, monthly cash flow is $379 ($5k/yr) — positive.
- The deal already cash-flows at list — no discount required.
- Meets the 1% rule at list price ($3k rent vs $239k).
- Recommended offer: $235k (1.5% below list) — sets the bar for market timing.
- Cap rate 8.2% vs local median 2.0% in Davis — top-decile yield for the area; either an underpriced asset or a hidden risk that comps aren't pricing in. Stress-test before assuming the spread holds.
Location & tenants
- Location reads 78/100 on livability (#71 in CA, #2,713 nationally) — a middle-class / working-renter tenant base. Strengths: schools A+, amenities A+, commute A+; Watch: cost of living F.
- Davis Joint Unified (suburban): math 76% / reading 89% proficiency, ranked #28 of 517 in CA (top 5%) — strong family-tenant draw, lease renewals of 3-5y typical; only 18% free/reduced lunch — higher-income household profile.
- Market conditions: Rents soft (-0.9%/yr); 96 active listings in the ZIP; 40 comparable units currently listed for rent nearby; rentals at typical pace (median 18d on market — plan ~3-4 weeks tenant-placement turnaround); high-income renter base; 721 units permitted in Yolo County in 2024 (260 in 5+ unit buildings).
Forward outlook
- Local home prices are declining (-3.0%/yr); year-one equity from $2k of loan paydown is wiped out by about $7k of value loss. Plan a longer hold.
- Yolo County population projected at +31% by 2050 — long-run rental-demand tailwind backs the buy-and-hold thesis.
Negotiation context
- It's been on market 18 days — a 2% lower offer ($235k) is reasonable based on typical stale-listing flexibility.
Risks & watch-outs
- Climate carrying-cost: extreme-heat days projected 6→13/yr by 2055 (HVAC capex compounding) — expect insurance premiums to compound above CPI over the hold.
Questions for the listing agent
- Built in 1974 — when were the roof, HVAC, electrical panel, plumbing, and water heater last replaced?
- Is there a deadline driving the sale (1031 exchange, divorce, estate, relocation)? That informs how much negotiation room exists.
- Schools are A-rated — typically a magnet for longer-tenancy family renters. What's the average tenant stay here, and is there a school-zone premium baked into asking?
- What's the average days-on-market for RENTAL listings here right now (not sales)? A rising rental-DOM trend means longer vacancies and softer asking-rent achievability than the comps imply.
- What's the recent tenant-quality profile in this submarket — average credit score on applications, eviction rate, late-payment / NSF rate, and stable-employment percentage? A property-management company in the area should have these aggregated.
- How much new for-sale + rental construction is in the pipeline within 1–3 miles? Heavy new supply typically softens prices + rents 12–24 months out; constrained supply supports both.
Investment metrics
- 1% rule
- 1.08% ✓
- Cap rate
- 8.20%
- Cash-on-cash
- 6.80%
- DSCR
- 1.30
- GRM
- 7.7
CMA / ARV
- ARV (on-the-fly)
- $254,592
- Comps found
- 4
Show comp detail 4 sales within ~0.75 mi
| Address | Dist | Beds/Ba | Sqft | Sold | Price | $/sf | Match |
|---|---|---|---|---|---|---|---|
| 141 Inner Cir | 0.07mi | 2/2.0 | 1,344 (+8%) | 10mo | $175,000 | $130 | 76 |
| 96 Full Cir | 0.08mi | 3/2.0 (+1) | 1,344 (+8%) | 5mo | $293,000 | $218 | 74 |
| 156 Inner Cir | 0.08mi | 2/2.0 | 1,152 (-8%) | 22mo | $88,000 | $76 | 66 |
| 252 Quarter Cir | 0.11mi | 3/2.0 (+1) | 1,344 (+8%) | 17mo | $274,000 | $204 | 63 |
Match score weights: distance 35% · size 25% · config 20% · recency 20%. Top-matched comps best support the ARV.
Projected returns pro-forma
-3.0% appreciation · 0.0% rent growth · sell at horizon
- IRR
- -9.3%
- Equity multiple
- 0.67×
- Total profit
- $-22,077
- Equity at exit
- $35,636
- IRR
- -4.5%
- Equity multiple
- 0.74×
- Total profit
- $-17,090
- Equity at exit
- $20,664
Cash invested: $66,920 (down + closing). Projections, not guarantees.
Landlord ↔ Tenant lean methodology
- Overall (STATE)
- 18 Strongly Tenant-Friendly
- State California
- 18 Strongly Tenant-Friendly · D+13
- County
- — inherits STATE
- City
- — inherits STATE
ZIP-level market 95618
- Rents YoY
- -0.9%
- Active inventory
- 96
- Price-to-rent
- 7.7×
Monthly cashflow live
- Estimated rent
- $2,571 high interval (Pro) →
- Mortgage (P&I)
- −$1,253
- Tax est. 1.5%
- −$299 /mo · $3,585/yr
- Insurance
- −$100
- HOA
- −$0
- Vacancy / Maint / Mgmt
- −$540
- Net cashflow
- $379
Break-even live
UW: 25.0% down · 7.5% · 30yr · 1.5% tax · 5.0% vac · 8.0% maint · 8.0% mgmt
Financing live
Cash to close
- Down payment
- $59,750
- Closing costs
- $7,170
- Reserves months
- —
- Total cash needed
- —
Loan-product check · same deal, 3 products live
Conventional
25% down · 7.5% · 30yr
- Down + closing
- —
- Monthly P&I
- —
- Monthly cashflow
- —
- DSCR
- —
- Eligible?
- —
Personal DTI + credit; lowest rate.
DSCR
20% down · 8.5% · 30yr
- Down + closing
- —
- Monthly P&I
- —
- Monthly cashflow
- —
- DSCR
- —
- Eligible?
- —
No personal income docs; deal must DSCR.
Hard money
10% down · 12.0% · 12mo
- Down + closing
- —
- Monthly P&I
- —
- Monthly cashflow
- —
- DSCR
- —
- Eligible?
- —
Short-term bridge; refi at stabilization.
Rent comps 40 comps
| Address | Beds | Baths | Sqft | Rent | $/sqft | DOM | Units | Dist |
|---|---|---|---|---|---|---|---|---|
| 2505 5th St Davis, CA | 3.0 | 2.5 | 1459 | $3,153 | $2.16 | 43d | 1 | 0.21mi |
| 2505 5th St Davis, CA | 1.0 | 1.0 | 712 | $1,908 | $2.68 | 17d | 1 | 0.21mi |
| 771 Pole Line Rd Davis, CA | 1.0–2.0 | 1.0 | 750 | $1,995 | $2.66 | 43d | 2 | 0.22mi |
| 709 Adeline Pl Davis, CA | 3.0 | 2.0 | 1250 | $3,400 | $2.72 | 14d | 1 | 0.28mi |
| 709 Adeline Pl Davis, CA | 3.0 | 2.0 | 1250 | $2,890 | $2.31 | 4d | 1 | 0.28mi |
| 1805 E 8th St Davis, CA | 2.0 | 1.0 | 850 | $1,995 | $2.35 | 23d | 3 | 0.37mi |
| 1615 E 8th St Davis, CA | 2.0–3.0 | 1.0–1.5 | 865 | $1,645 | $1.90 | 3d | 6 | 0.46mi |
| 1143 Greene Ter Davis, CA | 2.0 | 2.0 | 946 | $2,850 | $3.01 | 21d | 1 | 0.53mi |
| 2200 Whittier Dr Davis, CA | 3.0 | 1.0 | 1000 | $3,100 | $3.10 | 43d | 1 | 0.58mi |
| 516 K St Unit A Davis, CA | 3.0 | 1.0 | 940 | $2,300 | $2.45 | 7d | 1 | 0.64mi |
| 516 K St Unit C Davis, CA | 2.0 | 1.0 | 800 | $2,000 | $2.50 | 7d | 1 | 0.64mi |
| 2701 Lillard Dr Davis, CA | 3.0 | 2.0 | 1425 | $3,200 | $2.25 | 43d | 1 | 0.68mi |
| 300 J St Davis, CA | 1.0–2.0 | 1.0 | 660 | $2,245 | $3.40 | 1d | 16 | 0.73mi |
| 1280 Olive Dr Davis, CA | 1.0 | 1.0 | 724 | $2,295 | $3.17 | 20d | 1 | 0.73mi |
| 505 I St Davis, CA | 1.0–2.0 | 1.0 | 675 | $2,100 | $3.11 | 43d | 3 | 0.79mi |
| 717 I St Davis, CA | 3.0 | 2.0 | 1172 | $3,650 | $3.11 | 17d | 1 | 0.80mi |
| 401 I St Davis, CA | 2.0 | 1.0 | 785 | $1,995 | $2.54 | 4d | 1 | 0.80mi |
| 1540 Valdora St Davis, CA | 2.0–4.0 | 1.5–2.0 | 1225 | $2,199 | $1.80 | 12d | 38 | 0.80mi |
| 1880 Cowell Blvd Davis, CA | 2.0 | 2.0 | 1080 | $2,499 | $2.31 | 43d | 1 | 0.83mi |
| 1880 Cowell Blvd Davis, CA | 3.0 | 2.0 | 1300 | $3,399 | $2.61 | 17d | 1 | 0.83mi |
| 1100 Olive Dr Unit 236 Davis, CA | 2.0 | 2.0 | 1033 | $3,085 | $2.99 | 43d | 1 | 0.88mi |
| 1617 Valdora St Davis, CA | 3.0 | 3.0 | 1450 | $3,395 | $2.34 | 7d | 1 | 0.90mi |
| 1660 Drew Cir Davis, CA | 2.0–4.0 | 1.0–2.5 | 1262 | $1,894 | $1.50 | 11d | 32 | 0.92mi |
| 801 2nd St Unit 301 Davis, CA | 1.0 | 1.5 | 1259 | $3,000 | $2.38 | 43d | 1 | 0.94mi |
| 1659 Drew Cir Davis, CA | 3.0–4.0 | 2.0 | 1293 | $1,100 | $0.85 | 1d | 23 | 0.95mi |
| 1736 Valdora St Davis, CA | 3.0 | 2.0 | 987 | $3,400 | $3.44 | 3d | 1 | 0.99mi |
| 3028 Bryant Pl Davis, CA | 1.0 | 1.0 | 1380 | $850 | $0.62 | 7d | 1 | 1.01mi |
| 811 F St Davis, CA | 1.0–2.0 | 1.0 | 825 | $2,595 | $3.15 | 14d | 1 | 1.02mi |
| 514 10th St Unit 516 Davis, CA | 2.0 | 1.0 | 800 | $1,950 | $2.44 | 12d | 1 | 1.08mi |
| 647 D St Unit 408-A Davis, CA | 1.0 | 1.0 | 750 | $1,595 | $2.13 | 10d | 1 | 1.11mi |
| 3820 Chiles Rd Davis, CA | 3.0 | 1.0–2.0 | 995 | $3,140 | $3.16 | 43d | 1 | 1.11mi |
| 1703 Donner Ave #3 Davis, CA | 2.0 | 1.0 | 903 | $2,100 | $2.33 | 43d | 1 | 1.12mi |
| 4005 Cowell Blvd Davis, CA | 1.0–2.0 | 1.0–2.0 | 838 | $2,400 | $2.86 | 1d | 7 | 1.15mi |
| 311 7th St Davis, CA | 2.0 | 1.0 | 750 | $2,099 | $2.80 | 43d | 1 | 1.18mi |
| 2810 Pole Line Rd #3 Davis, CA | 2.0 | 1.0 | 903 | $2,350 | $2.60 | 14d | 1 | 1.19mi |
| 2861 Bidwell St #4 Davis, CA | 2.0 | 1.0 | 819 | $2,050 | $2.50 | 17d | 1 | 1.21mi |
| 2390 Roualt St Davis, CA | 3.0 | 2.0 | 1235 | $3,400 | $2.75 | 17d | 1 | 1.23mi |
| 2842 Bidwell St Davis, CA | 2.0 | 1.0 | 1012 | $1,995 | $1.97 | 7d | 1 | 1.23mi |
| 4141 Cowell Blvd Davis, CA | 1.0–2.0 | 1.0–2.0 | 838 | $2,395 | $2.86 | 4d | 6 | 1.28mi |
| 207 3rd St Unit 320 Davis, CA | 2.0 | 1.0 | 750 | $2,995 | $3.99 | 43d | 1 | 1.33mi |
Listing history 14 events
-
2026-06-18days on market $239,000 Active 18 DOM
-
2026-06-17days on market $239,000 Active 17 DOM
-
2026-06-16days on market $239,000 Active 16 DOM
-
2026-06-15days on market $239,000 Active 15 DOM
-
2026-06-13days on market $239,000 Active 13 DOM
-
2026-06-13days on market $239,000 Active 12 DOM
-
2026-06-09days on market $239,000 Active 9 DOM
-
2026-06-08days on market $239,000 Active 8 DOM
-
2026-06-07days on market $239,000 Active 7 DOM
-
2026-06-05days on market $239,000 Active 4 DOM
-
2026-06-03days on market $239,000 Active 3 DOM
-
2026-06-02days on market $239,000 Active 2 DOM
-
2026-06-01remarks 699-char remark
-
2026-06-01$239,000 Active 1 DOM
ⓘ Source: listings_history table (triggers on properties + properties_extension) + one-shot
backfill from property_details.listing_events for pre-trigger history.
Climate risk First Street
- Flood 3/10 Moderate FEMA zone X (unshaded) · 7% chance over 30 yrs
- Wildfire 3/10 Moderate
- Heat 6/10 Major 6 d/yr ≥103°F today · 13 d/yr by 30 yrs out
- Wind 1/10 Low
- Air quality 10/10 Extreme 27 unhealthy d/yr today · 29 by 30 yrs out
Nearby sold comps map
Loading sold comps map…
Walkable amenities ~0.75 mi
Loading nearby amenities…
Taxation est. · year 1
- Rental income
- $30,847
- − Mortgage interest
- −$13,388
- − Property taxes
- −$3,585
- − Insurance
- −$1,195
- − Repairs & maintenance
- −$2,468
- − Management
- −$2,468
- − Depreciation
- −$6,953
- Taxable income
- $791
- Est. tax owed @ 24.0%
- −$190
- After-tax cash flow
- $4,359/yr
For passive investors: Depreciation is non-cash, so a rental often shows a tax loss while cash-flowing — sheltering income. Rental losses are passive: they offset passive income freely, and up to $25,000/yr can offset ordinary (W-2) income if you actively participate and your MAGI is under $100k (phasing out to $0 by $150k); unused losses carry forward. On sale, claimed depreciation is recaptured at up to 25%, and gains may owe capital-gains tax (a 1031 exchange can defer both). Figures are a year-1 estimate at your 24.0% rate — not tax advice; consult a CPA.
Condition & rehab AI · 12 photos
This well-maintained manufactured home in Rancho Yolo Senior Community is move-in ready with a good condition score and minimal repairs needed.
Value-add opportunities
- Both Paint exterior — Enhances curb appeal and value
- Both Clean gutters — Improves drainage and property value
Renovation cost estimate screening
Value-add ROI direction
- Both Paint exterior — Enhances curb appeal and value ↑
- Both Clean gutters — Improves drainage and property value ↑
ⓘ Cost ranges are severity-bucket heuristics (US national rule-of-thumb). Get contractor quotes + a written scope before underwriting a rehab budget.
Schools (NCES district)
- District
- Davis Joint Unified
- NCES district ID
- 0610620
- Math proficiency
- 76% ▲ 11.00%
- Reading proficiency
- 89% ▲ 17.00%
- Median HH income
- $58,551
- Composite
- 70.5/100
- National rank
- #261
- State rank
- #28 of 517 in CA
Livability — Davis
- Score
- 78/100
- State rank
- #71
- US rank
- #2713
Category grades
Schools grade is shown separately in the Schools card above.
Census & demographics
- Census place
- Davis, CA
- County
- Yolo County · 212,115 people
- City population
- 79,897
- Metro
- Sacramento-Roseville-Folsom, CA
- Population (ZIP)
- 26,267
- Household income
- $115,591
- Rent vs Own
- Severe rent burden
- 1441.0
Population outlook (Yolo County) Hauer SSP2
- Today (2025)
- 242,183 people
- By 2030
- 257,662 · +6.4%
- By 2040
- 288,050 · +18.9%
- By 2050
- 318,202 · +31.4%
- By 2075
- 392,736 · +62.2%
- By 2100
- 438,150 · +80.9%
Race, ethnicity, and origin ACS 2023
- Neighborhood character
- Diverse neighborhood (Simpson 0.66)
- Race & ethnicity
- White 50% Asian 24% Hispanic / Latino 18% Two or more races 11% Black 3% Native American 1%
- Hispanic origin (detail)
- Mexican 12%
- Common ancestry
- Italian 7% Portuguese 2% Slovak 2%
- Foreign-born
- 24% · China, Canada, South Korea
- Languages at home
- 68% English-only · Spanish 11% Chinese 10% Other Indo-European 4%
Political lean MEDSL · Yolo
- 2024 margin
- Solid D (+36.2) · D 66.3% · R 30.1% · Other 3.6%
- 2008→2024 swing
- 0.0pp no change · 2008: 36.2pp · 2024: 36.2pp
- All cycles
- 2024: D+36.2 2020: D+41.4 2016: D+42.0 2012: D+33.2 2008: D+36.2
Not yet ingested
- Civics
- —
Market trends
- HPI YoY
- ▼ -545.15%
- Current HPI
- 291.2054
- Rent YoY
- ▼ -0.92%
- Metro
- Sacramento-Roseville-Folsom, CA
- State GDP YoY
- ▲ 3.21%
- F500 in state
- 116
Industry mix (Fortune 500 HQ in CA)
| Industry | F500 HQs | Revenue |
|---|---|---|
| Technology | 27 | $1,492B |
|
||
| Financial Services | 3 | $174B |
|
||
| Retail | 3 | $44B |
|
||
| Insurance | 3 | $26B |
|
||
| Media / Entertainment | 2 | $115B |
|
||
| Pharmaceuticals / Biotech | 2 | $62B |
|
||
Cash-flow waterfall
monthlySold comps — $/sqft
last 12 mo · ≤1 miLoading sold comps…