 Triplex
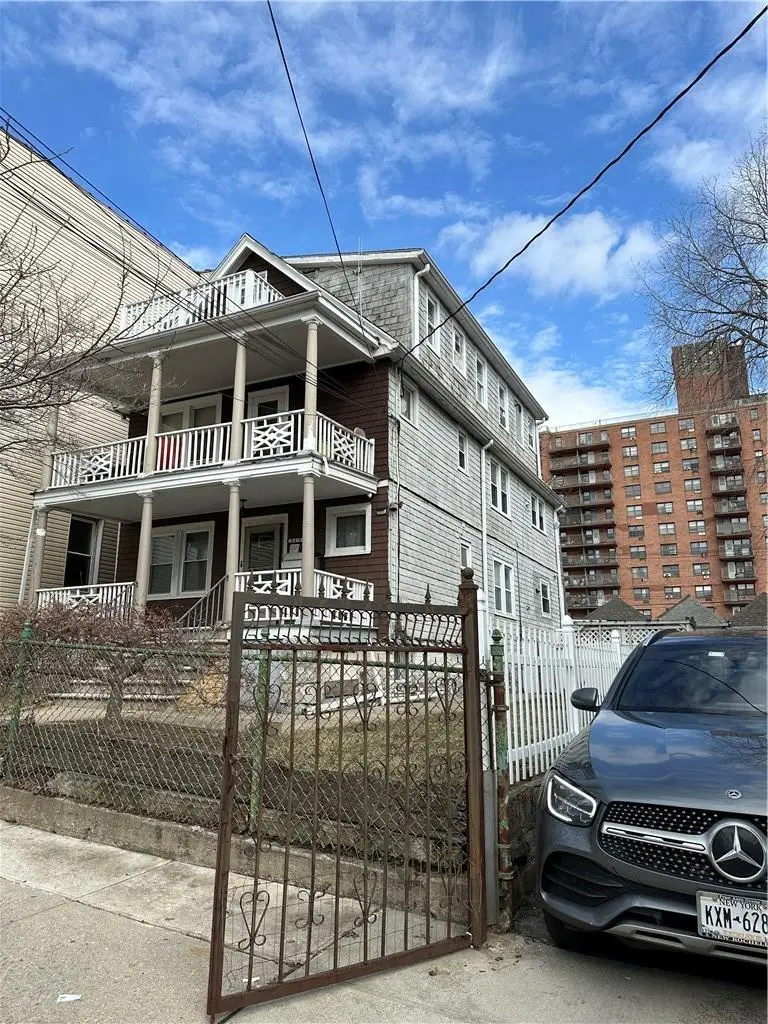
849 E 232nd St · New York, NY
Flood risk 1/10 · Minimal
- FEMA flood zone
- X (unshaded)
- Chance of flooding over 30 yrs
- 0.0%
- Est. flood insurance / yr
- $507 – $1,088
Fire risk 1/10 · Minimal
- Est. fire insurance / yr
- $691 – $1,283
Heat risk 6/10 · Moderate
- Hot days now (above 99°F)
- 7 days/yr
- Hot days in 30 yrs
- 15 days/yr
Wind risk 6/10 · Moderate
- Chance of severe wind over 30 yrs
- 27.0%
Air-quality risk 3/10 · Minor
- Unhealthy air days now
- 3 days/yr
- Unhealthy air days in 30 yrs
- 4 days/yr
Risk factors via First Street. Map © Google.
Why this score? — see what drove the C+ grade
The composite is a weighted blend of 9 inputs, each scored 0–100. Each bar is that input's sub-score; the figure is the points it added to the 100-point composite (weight × sub-score).
- Cash flow +23.3/30.0
- ARV discount +11.9/15.0
- DSCR +7.5/10.0
- 1% rule +5.6/10.0
- Schools +5.0/10.0
- Livability +3.8/5.0
- Rent growth +2.5/5.0
- Condition / age +2.5/5.0
- Appreciation +0.0/10.0
$839,000
🖨 Deal sheet (PDF) 📄 Offer letter ✓ Due diligence
Multi-family units
County records classify this as Multi-Family (2-4 Unit). Listing-text estimate: 3 units. confirmed
Listing remarks
DON'T MISS OUT! HUGE DOUBLE LOT three family with three 2 bedroom units and full, finished walk out 2 bedroom basement. The other lot features 3 detached garages, long driveway, private garden, extra land and enclosed garbage storage area. One unit was newly renovated in 2020 featuring new kitchen with granite countertops, stainless steel appliances including dishwasher, wood cabinetry. Wood flooring is throughout the entire home. Property also has fire escape in addition to front stairway. Top floor unit has skylight and pantry. Tenant paying $1600. All other units occupied by owner and to be delivered vacant. Additional Information: HeatingFuel:Oil Above Ground, ParkingFeatures:3 Car Deta
Key facts
- 5,732 sq ft lot
- 3 parking spots
- Built 1910
Neighborhood map
What this means for you Summary
Snapshot
- This is a 3 × 2-bed/1.0-bath units multifamily listed at $839k.
Deal economics
- At list price, monthly cash flow is $2k ($18k/yr) — positive. Per door: $510/mo.
- The deal already cash-flows at list — no discount required.
- Meets the 1% rule at list price ($9k rent vs $839k).
- Recommended offer: $814k (3.0% below list) — sets the bar for market timing.
- Cap rate 8.5% vs local median 2.6% in New York — top-decile yield for the area; either an underpriced asset or a hidden risk that comps aren't pricing in. Stress-test before assuming the spread holds.
Location & tenants
- Location reads 75/100 on livability (#268 in NY, #4,188 nationally) — a middle-class / working-renter tenant base. Strengths: amenities A+, commute A+, health & safety A; Watch: crime F, cost of living F.
- Zoned schools: Elm Tree Elementary School (math 27% / reading 52%, grade F, #1,444 of 2,108 statewide, top 71%, 806 students, 94% FRL); Jhs 383 Philippa Schuyler (math 32% / reading 67%, grade C, #280 of 729 statewide, top 40%, 822 students, 85% FRL); Midwood High School (math 94% / reading 96%, grade A+, #83 of 1,100 statewide, top 8%, 4,062 students, 73% FRL).
- Market conditions: 161 active listings in the ZIP; 6,929 units permitted in Bronx County in 2024 (6,829 in 5+ unit buildings).
- At $8,861/mo this rent would consume 161% of the median local household income ($66k/yr) (locally 4791% of renters already pay >50% of income on rent) — very limited rent-growth headroom before tenants either downsize or default.
Forward outlook
- Local home prices are declining (-3.0%/yr); year-one equity from $6k of loan paydown is wiped out by about $25k of value loss. Plan a longer hold.
- Bronx County population projected at +21% by 2050 — long-run rental-demand tailwind backs the buy-and-hold thesis.
Negotiation context
- It's been on market 51 days — a 3% lower offer ($814k) is reasonable based on typical stale-listing flexibility.
- 4 sale attempts since 5y ago with the ask held roughly flat each time — persistent listings suggest the price (not the market) is what's stuck; bring a comps-based counter.
- Current owner paid $210k; list at $839k implies a 300% gain — meaningful room to come down on a strong offer.
Risks & watch-outs
- Watch-outs: built in 1910 — expect roof / HVAC / electrical / plumbing capex.
- Climate carrying-cost: major wind risk, 27% chance of damaging wind over 30y; extreme-heat days projected 7→15/yr by 2055 (HVAC capex compounding) — expect insurance premiums to compound above CPI over the hold.
Questions for the listing agent
- It's been on market 51 days. Have you received any prior offers? Is the seller open to a 3% concession, seller financing, or rate buy-down credit?
- Can we see the unit-by-unit rent roll, current vacancy, and any below-market leases? What's the average tenancy length?
- What capital expenditures (roof, boiler, parking lot, exteriors) have been made in the last 5 years, and what's planned in the next 2?
- Built in 1910 — when were the roof, HVAC, electrical panel, plumbing, and water heater last replaced?
- Is there a deadline driving the sale (1031 exchange, divorce, estate, relocation)? That informs how much negotiation room exists.
- Schools are B-rated — typically a magnet for longer-tenancy family renters. What's the average tenant stay here, and is there a school-zone premium baked into asking?
- Crime grade is F in this area — have there been break-ins, vandalism, or insurance claims at this property in the last 3 years? What carrier currently insures it and at what premium?
- What's the average days-on-market for RENTAL listings here right now (not sales)? A rising rental-DOM trend means longer vacancies and softer asking-rent achievability than the comps imply.
- What's the recent tenant-quality profile in this submarket — average credit score on applications, eviction rate, late-payment / NSF rate, and stable-employment percentage? A property-management company in the area should have these aggregated.
- How much new apartment / multifamily construction is in the pipeline within 1–3 miles? Heavy new supply (>2% of stock underway) typically softens rents 12–24 months out; light construction supports rent growth.
Investment metrics
- 1% rule
- 1.06% ✓
- Cap rate
- 8.48%
- Cash-on-cash
- 7.81%
- DSCR
- 1.35
- GRM
- 7.9
CMA / ARV
- ARV (on-the-fly)
- $930,776
- Comps found
- 12
Show comp detail 12 sales within ~0.75 mi
| Address | Dist | Beds/Ba | Sqft | Sold | Price | $/sf | Match |
|---|---|---|---|---|---|---|---|
| 4216 Barnes Ave | 0.12mi | 5/3.0 (-1) | 3,113 (+3%) | 12mo | $830,000 | $267 | 75 |
| 4306 Matilda Ave | 0.42mi | 7/— (+1) | 2,980 (-1%) | 3mo | $799,000 | $268 | 71 |
| 4063 Ely Ave | 0.36mi | 6/2.0 | 3,119 (+3%) | 9mo | $895,000 | $287 | 66 |
| 4216 Edson Ave | 0.50mi | 6/3.0 | 3,186 (+5%) | 3mo | $930,000 | $292 | 65 |
| 741 E 227th St | 0.32mi | 5/3.0 (-1) | 2,719 (-10%) | 2mo | $949,000 | $349 | 62 |
| 1710 Nereid Ave | 0.43mi | 7/3.0 (+1) | 2,860 (-5%) | 5mo | $860,000 | $301 | 62 |
| 947 E 229th St | 0.23mi | 5/2.0 (-1) | 2,730 (-10%) | 6mo | $850,000 | $311 | 59 |
| 756 E 225th St | 0.42mi | 7/3.0 (+1) | 2,786 (-8%) | 4mo | $950,000 | $341 | 59 |
| 740 Nereid Ave | 0.43mi | 7/3.0 (+1) | 2,761 (-9%) | 8mo | $870,000 | $315 | 54 |
| 1012 E 225th St | 0.47mi | 5/2.0 (-1) | 2,760 (-9%) | 2mo | $850,000 | $308 | 53 |
| 4315 Murdock Ave | 0.68mi | 5/3.0 (-1) | 2,760 (-9%) | 8mo | $680,000 | $246 | 42 |
| 3941 Laconia Ave | 0.58mi | 7/5.0 (+1) | 3,387 (+12%) | 2mo | $1,180,000 | $348 | 38 |
Match score weights: distance 35% · size 25% · config 20% · recency 20%. Top-matched comps best support the ARV.
Projected returns pro-forma
-3.0% appreciation · 3.0% rent growth · sell at horizon
- IRR
- -4.4%
- Equity multiple
- 0.84×
- Total profit
- $-38,656
- Equity at exit
- $125,098
- IRR
- 5.3%
- Equity multiple
- 1.39×
- Total profit
- $91,440
- Equity at exit
- $72,541
Cash invested: $234,920 (down + closing). Projections, not guarantees.
Landlord ↔ Tenant lean methodology
- Overall (CITY)
- 0 Strongly Tenant-Friendly
- State New York
- 15 Strongly Tenant-Friendly · D+10
- County
- — inherits STATE
- City New York
- 0 Strongly Tenant-Friendly · D+34
ZIP-level market 10466
- Active inventory
- 161
- Price-to-rent
- 23.7×
Monthly cashflow live
- Estimated rent
- $8,861 high interval (Pro) →
- Mortgage (P&I)
- −$4,400
- Tax from tax record
- −$722 /mo · $8,665/yr
- Insurance
- −$350
- HOA
- −$0
- Vacancy / Maint / Mgmt
- −$1,861
- Net cashflow
- $1,529
Break-even live
Sensitivity live
| Price | -10% $2,004 | -5% $1,766 | +0% $1,529 | +5% $1,291 | +10% $1,054 |
|---|---|---|---|---|---|
| Rent | -10% $829 | -5% $1,179 | +0% $1,529 | +5% $1,879 | +10% $2,229 |
| Rate | -1.0pp $1,951 | -0.5pp $1,742 | base $1,529 | +0.5pp $1,311 | +1.0pp $1,090 |
3-unit breakdown (identical units grouped — click to expand)
| Units | Beds | Baths | Est. rent |
|---|---|---|---|
| 3× units | 2 | 1 | $8,862 |
| #1 | 2 | 1 | $2,954 |
| #2 | 2 | 1 | $2,954 |
| #3 | 2 | 1 | $2,954 |
| Total (3 units) | $8,861 | ||
UW: 25.0% down · 7.5% · 30yr · 1.5% tax · 5.0% vac · 8.0% maint · 8.0% mgmt
Financing live
Cash to close
- Down payment
- $209,750
- Closing costs
- $25,170
- Reserves months
- —
- Total cash needed
- —
Loan-product check · same deal, 3 products live
Conventional
25% down · 7.5% · 30yr
- Down + closing
- —
- Monthly P&I
- —
- Monthly cashflow
- —
- DSCR
- —
- Eligible?
- —
Personal DTI + credit; lowest rate.
DSCR
20% down · 8.5% · 30yr
- Down + closing
- —
- Monthly P&I
- —
- Monthly cashflow
- —
- DSCR
- —
- Eligible?
- —
No personal income docs; deal must DSCR.
Hard money
10% down · 12.0% · 12mo
- Down + closing
- —
- Monthly P&I
- —
- Monthly cashflow
- —
- DSCR
- —
- Eligible?
- —
Short-term bridge; refi at stabilization.
Listing history 9 events
-
2024-04-18status Pending
-
2024-02-27$839,000 Active
-
2023-01-28historical
-
2022-07-28$899,999 Active
-
2021-08-30historical
-
2021-08-28status Active
-
2021-08-17historical
-
2021-08-03$926,000 Active
-
1996-07-25soldstatus $210,000
ⓘ Source: listings_history table (triggers on properties + properties_extension) + one-shot
backfill from property_details.listing_events for pre-trigger history.
Tax reassessment forecast NY · Partial reset (capped growth)
- Current annual tax
- $8,665 · $722/mo
- Projected year-2 tax
- $11,422 · $952/mo
- Expected delta
- +$2,757/yr (+$230/mo · 31.8%)
ⓘ Screening estimate from a state-policy table — verify with the county assessor before closing.
Climate risk First Street
- Flood 1/10 Low FEMA zone X (unshaded) · 0% chance over 30 yrs
- Wildfire 1/10 Low
- Heat 6/10 Major 7 d/yr ≥99°F today · 15 d/yr by 30 yrs out
- Wind 6/10 Major 27% chance of damaging wind over 30 yrs
- Air quality 3/10 Moderate 3 unhealthy d/yr today · 4 by 30 yrs out
Nearby sold comps map
Loading sold comps map…
Walkable amenities ~0.75 mi
Loading nearby amenities…
Taxation est. · year 1
- Rental income
- $106,332
- − Mortgage interest
- −$46,997
- − Property taxes
- −$8,665
- − Insurance
- −$4,195
- − Repairs & maintenance
- −$8,507
- − Management
- −$8,507
- − Depreciation
- −$24,407
- Taxable income
- $5,055
- Est. tax owed @ 24.0%
- −$1,213
- After-tax cash flow
- $17,132/yr
For passive investors: Depreciation is non-cash, so a rental often shows a tax loss while cash-flowing — sheltering income. Rental losses are passive: they offset passive income freely, and up to $25,000/yr can offset ordinary (W-2) income if you actively participate and your MAGI is under $100k (phasing out to $0 by $150k); unused losses carry forward. On sale, claimed depreciation is recaptured at up to 25%, and gains may owe capital-gains tax (a 1031 exchange can defer both). Figures are a year-1 estimate at your 24.0% rate — not tax advice; consult a CPA.
Schools (NCES district)
No district data.
Livability — New York
- Score
- 75/100
- State rank
- #268
- US rank
- #4188
Category grades
Schools grade is shown separately in the Schools card above.
Census & demographics
- Census place
- New York, NY
- County
- Bronx County · 1,197,324 people
- City population
- 7,731,280
- Metro
- New York-Newark-Jersey City, NY-NJ-PA
- Population (ZIP)
- 71,116
- Household income
- $65,969
- Rent vs Own
- Severe rent burden
- 4791.0
Population outlook (Bronx County) Hauer SSP2
- Today (2025)
- 1,607,353 people
- By 2030
- 1,681,852 · +4.6%
- By 2040
- 1,824,421 · +13.5%
- By 2050
- 1,945,470 · +21.0%
- By 2075
- 2,187,887 · +36.1%
- By 2100
- 2,244,136 · +39.6%
Race, ethnicity, and origin ACS 2023
- Neighborhood character
- Diverse neighborhood (Simpson 0.55)
- Race & ethnicity
- Black 60% Hispanic / Latino 29% Two or more races 7% White 2% Asian 2% Native American 1%
- Hispanic origin (detail)
- Mexican 3% Puerto Rican 9% Dominican 12%
- Common ancestry
- Hispanic 1%
- Foreign-born
- 42% · Canada, Jamaica, United Kingdom
- Languages at home
- 67% English-only · Spanish 22% French/Haitian/Cajun 1% Other Indo-European 1%
Political lean MEDSL · Bronx
- 2024 margin
- Solid D (+45.4) · D 72.7% · R 27.3%
- 2008→2024 swing
- -32.3pp toward R · 2008: 77.8pp · 2024: 45.4pp
- All cycles
- 2024: D+45.4 2020: D+67.6 2016: D+79.1 2012: D+82.9 2008: D+77.8
Not yet ingested
- Civics
- —
Market trends
- HPI YoY
- ▼ -314.77%
- Current HPI
- 349.542
- Rent YoY
- —
- Metro
- New York-Newark-Jersey City, NY-NJ-PA
- State GDP YoY
- ▲ 2.60%
- F500 in state
- 92
Industry mix (Fortune 500 HQ in NY)
| Industry | F500 HQs | Revenue |
|---|---|---|
| Financial Services | 10 | $950B |
|
||
| Consumer Goods | 9 | $162B |
|
||
| Insurance | 4 | $225B |
|
||
| Telecommunications | 2 | $144B |
|
||
| Pharmaceuticals | 2 | $112B |
|
||
| Media / Entertainment | 2 | $69B |
|
||
Price history
+299.5% since first listed9 events — show timeline
- 2024-04-18 Pending — OneKey® MLS as Distributed by MLS Grid
- 2024-02-27 Listed $839,000 OneKey® MLS as Distributed by MLS Grid
- 2023-01-28 Listing Removed — OneKey® MLS as Distributed by MLS Grid
- 2022-07-28 Listed $899,999 OneKey® MLS as Distributed by MLS Grid
- 2021-08-30 Listing Removed — OneKey® MLS as Distributed by MLS Grid
- 2021-08-28 Relisted — OneKey® MLS as Distributed by MLS Grid
- 2021-08-17 Listing Removed — OneKey® MLS as Distributed by MLS Grid
- 2021-08-03 Listed $926,000 OneKey® MLS as Distributed by MLS Grid
- 1996-07-25 Sold (Public Records) $210,000 Public Records
Property tax history
+5.7%/yrLatest (2025): $8,665 · +6.0% YoY. Source: county tax records.
Cash-flow waterfall
monthlySold comps — $/sqft
last 12 mo · ≤1 miLoading sold comps…