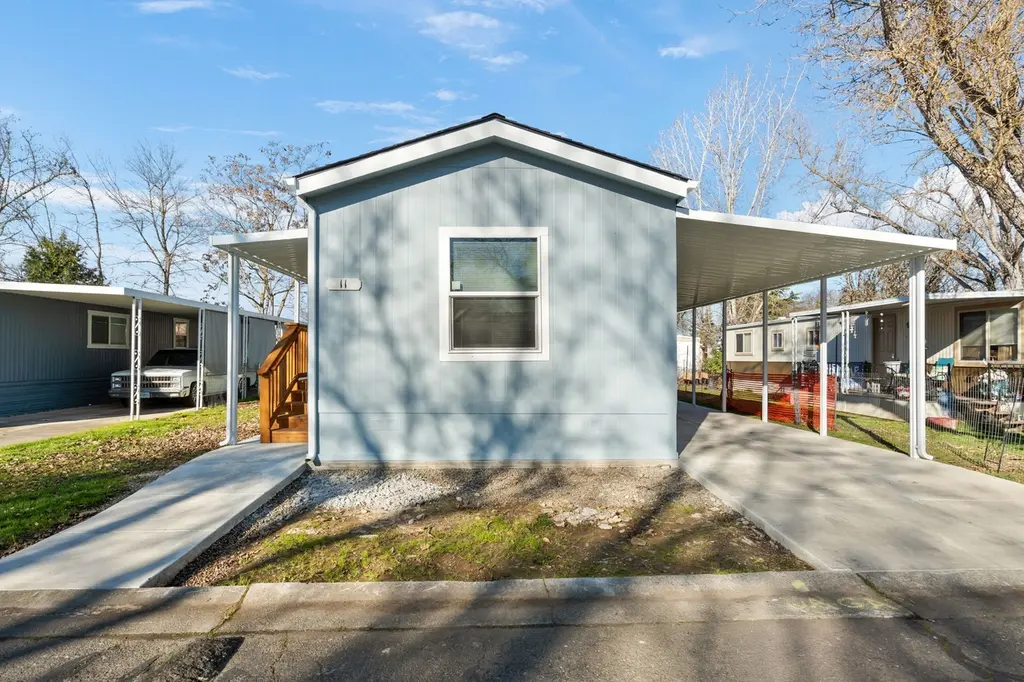
6850 Downing Rd · Medford, OR
Flood risk 1/10 · Minimal
- FEMA flood zone
- X (unshaded)
- Chance of flooding over 30 yrs
- 0.0%
- Est. flood insurance / yr
- $507 – $1,088
Fire risk 7/10 · Major
- Est. fire insurance / yr
- $498 – $926
Heat risk 6/10 · Moderate
- Hot days now (above 100°F)
- 6 days/yr
- Hot days in 30 yrs
- 13 days/yr
Wind risk 1/10 · Minimal
- Chance of severe wind over 30 yrs
- —
Air-quality risk 10/10 · Severe
- Unhealthy air days now
- 31 days/yr
- Unhealthy air days in 30 yrs
- 32 days/yr
Risk factors via First Street. Map © Google.
Why this score? — see what drove the B- grade
The composite is a weighted blend of 9 inputs, each scored 0–100. Each bar is that input's sub-score; the figure is the points it added to the 100-point composite (weight × sub-score).
- Cash flow +28.2/30.0
- DSCR +10.0/10.0
- 1% rule +7.7/10.0
- ARV discount +7.5/15.0
- Livability +3.8/5.0
- Rent growth +3.6/5.0
- Schools +2.6/10.0
- Condition / age +2.5/5.0
- Appreciation +0.0/10.0
$119,900
🖨 Deal sheet 📄 Offer letter ✓ Due diligence
Listing remarks MLS
2025 Skyline Ridgewood 2 Bedrooms 2 Bathrooms Approx. 720 Square Feet 54' x 16' Vinyl Flooring Stove, Refrigerator & Dishwasher All Age Community Pet Friendly Great Location & Much More!
Key facts
- Vinyl flooring
- Great location
- Pet friendly
Tags
Neighborhood map
What this means for you Summary
Snapshot
- This is a 2-bed/2.0-bath other listed at $120k.
Deal economics
- At list price, monthly cash flow is $379 ($5k/yr) — positive.
- The deal already cash-flows at list — no discount required.
- Meets the 1% rule at list price ($2k rent vs $120k).
- Recommended offer: $106k (12.0% below list) — sets the bar for market timing.
- Cap rate 10.1% vs local median 2.8% in Medford — top-decile yield for the area; either an underpriced asset or a hidden risk that comps aren't pricing in. Stress-test before assuming the spread holds.
Location & tenants
- Location reads 76/100 on livability (#78 in OR, #3,467 nationally) — a middle-class / working-renter tenant base. Strengths: commute A+, health & safety A+, amenities A-; Watch: schools C-, employment D+, crime F.
- Central Point SD 6 (suburban): math 19% / reading 41% proficiency, ranked #42 of 58 in OR (top 72%) — families likely to look elsewhere, expect single-tenant / working-renter base with shorter leases.
- Market conditions: Rents rising fast (+4.3%/yr); 211 active listings in the ZIP; 1 comparable units currently listed for rent nearby; solid renter incomes; 904 units permitted in Jackson County in 2024 (212 in 5+ unit buildings).
Forward outlook
- Local home prices are declining (-3.0%/yr); year-one equity from $829 of loan paydown is wiped out by about $4k of value loss. Plan a longer hold.
- Jackson County population projected at +17% by 2050 — long-run rental-demand tailwind backs the buy-and-hold thesis.
- At projected returns (-3.0% appreciation + 4.3% rent growth), your $34k cash investment doubles in ~8 years — after that, you're playing with house money.
Negotiation context
- It's been on market 141 days — a 12% lower offer ($106k) is reasonable based on typical stale-listing flexibility.
- 27 sale attempts since 30y ago with the ask held roughly flat each time — persistent listings suggest the price (not the market) is what's stuck; bring a comps-based counter.
- Current owner paid $10k; list at $120k implies a 1042% gain — meaningful room to come down on a strong offer.
Risks & watch-outs
- Climate carrying-cost: major wildfire risk; extreme-heat days projected 6→13/yr by 2055 (HVAC capex compounding) — expect insurance premiums to compound above CPI over the hold.
Questions for the listing agent
- It's been on market 141 days. Have you received any prior offers? Is the seller open to a 12% concession, seller financing, or rate buy-down credit?
- Why hasn't it sold? Are there any deal-killer items the seller is aware of (foundation, flood, title, zoning, code violations)?
- Is there a deadline driving the sale (1031 exchange, divorce, estate, relocation)? That informs how much negotiation room exists.
- Crime grade is F in this area — have there been break-ins, vandalism, or insurance claims at this property in the last 3 years? What carrier currently insures it and at what premium?
- What's the average days-on-market for RENTAL listings here right now (not sales)? A rising rental-DOM trend means longer vacancies and softer asking-rent achievability than the comps imply.
- What's the recent tenant-quality profile in this submarket — average credit score on applications, eviction rate, late-payment / NSF rate, and stable-employment percentage? A property-management company in the area should have these aggregated.
- How much new for-sale + rental construction is in the pipeline within 1–3 miles? Heavy new supply typically softens prices + rents 12–24 months out; constrained supply supports both.
Investment metrics
- 1% rule
- 1.27% ✓
- Cap rate
- 10.08%
- Cash-on-cash
- 13.53%
- DSCR
- 1.60
- GRM
- 6.5
CMA / ARV
- ARV (median comp)
- $36,567
- List price
- $119,900
- Delta
- 227.89%
- Verdict
- OVERPRICED
- Comps
- 2 within 1.0 mi
Projected returns pro-forma
-3.0% appreciation · 4.33% rent growth · sell at horizon
- IRR
- 5.1%
- Equity multiple
- 1.20×
- Total profit
- $6,783
- Equity at exit
- $17,877
- IRR
- 15.8%
- Equity multiple
- 2.36×
- Total profit
- $45,790
- Equity at exit
- $10,367
Cash invested: $33,572 (down + closing). Projections, not guarantees.
Landlord ↔ Tenant lean methodology
- Overall (STATE)
- 28 Tenant-Leaning
- State Oregon
- 28 Tenant-Leaning · D+6
- County
- — inherits STATE
- City
- — inherits STATE
ZIP-level market 97502
- Rents YoY
- 4.3%
- Active inventory
- 211
- Price-to-rent
- 6.5×
Monthly cashflow live
- Estimated rent
- $1,528 medium interval (Pro) →
- Mortgage (P&I)
- −$629
- Tax est. 1.5%
- −$150 /mo · $1,798/yr
- Insurance
- −$50
- HOA
- −$0
- Vacancy / Maint / Mgmt
- −$321
- Net cashflow
- $379
Break-even live
UW: 25.0% down · 7.5% · 30yr · 1.5% tax · 5.0% vac · 8.0% maint · 8.0% mgmt
Financing live
Cash to close
- Down payment
- $29,975
- Closing costs
- $3,597
- Reserves months
- —
- Total cash needed
- —
Loan-product check · same deal, 3 products live
Conventional
25% down · 7.5% · 30yr
- Down + closing
- —
- Monthly P&I
- —
- Monthly cashflow
- —
- DSCR
- —
- Eligible?
- —
Personal DTI + credit; lowest rate.
DSCR
20% down · 8.5% · 30yr
- Down + closing
- —
- Monthly P&I
- —
- Monthly cashflow
- —
- DSCR
- —
- Eligible?
- —
No personal income docs; deal must DSCR.
Hard money
10% down · 12.0% · 12mo
- Down + closing
- —
- Monthly P&I
- —
- Monthly cashflow
- —
- DSCR
- —
- Eligible?
- —
Short-term bridge; refi at stabilization.
Rent comps 1 comps
| Address | Beds | Baths | Sqft | Rent | $/sqft | DOM | Units | Dist |
|---|---|---|---|---|---|---|---|---|
| 225 Wilson Rd Apt B Central Point, OR | 3.0 | 2.0 | 1456 | $1,850 | $1.27 | 43d | 1 | 1.46mi |
Listing history 50 events
-
2026-06-19days on market $119,900 Active 141 DOM
-
2026-06-18days on market $119,900 Active 140 DOM
-
2026-06-17days on market $119,900 Active 139 DOM
-
2026-06-16days on market $119,900 Active 138 DOM
-
2026-06-15days on market $119,900 Active 137 DOM
-
2026-06-14days on market $119,900 Active 135 DOM
-
2026-06-13days on market $119,900 Active 134 DOM
-
2026-06-10days on market $119,900 Active 132 DOM
-
2026-06-09days on market $119,900 Active 131 DOM
-
2026-06-08days on market $119,900 Active 130 DOM
-
2026-06-07days on market $119,900 Active 129 DOM
-
2026-06-02days on market $119,900 Active 124 DOM
-
2026-06-01days on market $119,900 Active 123 DOM
-
2026-05-31days on market $119,900 Active 122 DOM
-
2026-05-30days on market $119,900 Active 121 DOM
-
2026-01-29$119,900 Active 205-char remark
Show marketing remark (205 chars)
2025 Skyline Ridgewood 2 Bedrooms 2 Bathrooms Approx. 720 Square Feet 54' x 16' Vinyl Flooring Stove, Refrigerator & Dishwasher All Age Community Pet Friendly Great Location & Much More!
-
2020-04-26historical
-
2020-04-25historical
-
2020-04-25historical
-
2020-04-25historical
-
2020-04-25historical
-
2020-04-25historical
-
2020-04-25historical
-
2020-04-25historical
-
2020-04-25historical
-
2020-04-25historical
-
2020-04-25historical
-
2020-04-25historical
-
2020-04-25historical
-
2020-04-25historical
-
2020-04-25historical
-
2020-04-25historical
-
2020-04-25historical
-
2001-08-13$39,900
-
2001-08-01$48,500
-
2001-07-05soldstatus $10,500
-
2001-05-10$12,500
-
2001-04-03$43,900
-
2001-03-22$25,000
-
2001-01-23$43,900
-
2000-08-31$20,000
-
2000-08-25$44,500
-
2000-08-08$46,500
-
2000-07-18$43,900
-
2000-06-29$14,000
-
2000-06-28$14,000
-
2000-06-20soldstatus $14,000
-
2000-06-20soldstatus $14,000
-
2000-05-08$28,000
-
2000-01-26$12,000
ⓘ Source: listings_history table (triggers on properties + properties_extension) + one-shot
backfill from property_details.listing_events for pre-trigger history.
Climate risk First Street
- Flood 1/10 Low FEMA zone X (unshaded) · 0% chance over 30 yrs
- Wildfire 7/10 Severe
- Heat 6/10 Major 6 d/yr ≥100°F today · 13 d/yr by 30 yrs out
- Wind 1/10 Low
- Air quality 10/10 Extreme 31 unhealthy d/yr today · 32 by 30 yrs out
Nearby sold comps map
Loading sold comps map…
Walkable amenities ~0.75 mi
Loading nearby amenities…
Taxation est. · year 1
- Rental income
- $18,338
- − Mortgage interest
- −$6,716
- − Property taxes
- −$1,798
- − Insurance
- −$600
- − Repairs & maintenance
- −$1,467
- − Management
- −$1,467
- − Depreciation
- −$3,488
- Taxable income
- $2,802
- Est. tax owed @ 24.0%
- −$672
- After-tax cash flow
- $3,871/yr
For passive investors: Depreciation is non-cash, so a rental often shows a tax loss while cash-flowing — sheltering income. Rental losses are passive: they offset passive income freely, and up to $25,000/yr can offset ordinary (W-2) income if you actively participate and your MAGI is under $100k (phasing out to $0 by $150k); unused losses carry forward. On sale, claimed depreciation is recaptured at up to 25%, and gains may owe capital-gains tax (a 1031 exchange can defer both). Figures are a year-1 estimate at your 24.0% rate — not tax advice; consult a CPA.
Schools (NCES district)
- District
- Central Point SD 6
- NCES district ID
- 4102940
- Math proficiency
- 19% ▼ -13.00%
- Reading proficiency
- 41% ▼ -6.00%
- Median HH income
- $49,736
- Composite
- 26.09/100
- National rank
- #7290
- State rank
- #42 of 58 in OR
Livability — Medford
- Score
- 76/100
- State rank
- #78
- US rank
- #3467
Category grades
Schools grade is shown separately in the Schools card above.
Census & demographics
- County
- Jackson County · 159,661 people
- City population
- 95,759
- Metro
- Medford, OR
- Population (ZIP)
- 29,067
- Household income
- $83,488
- Rent vs Own
- Severe rent burden
- 650.0
Population outlook (Jackson County) Hauer SSP2
- Today (2025)
- 234,433 people
- By 2030
- 243,834 · +4.0%
- By 2040
- 259,717 · +10.8%
- By 2050
- 273,269 · +16.6%
- By 2075
- 300,624 · +28.2%
- By 2100
- 305,256 · +30.2%
Race, ethnicity, and origin ACS 2023
- Neighborhood character
- Predominantly White (77%)
- Race & ethnicity
- White 77% Hispanic / Latino 14% Two or more races 9%
- Hispanic origin (detail)
- Mexican 12%
- Common ancestry
- Portuguese 3% Iranian 2% Lithuanian 2%
- Foreign-born
- 5% · Canada, South Korea
- Languages at home
- 90% English-only · Spanish 8% Other Asian/Pacific 1%
Political lean MEDSL · Jackson
- 2024 margin
- Lean R (+6.4) · D 45.5% · R 51.9% · Other 2.6%
- 2008→2024 swing
- -6.5pp toward R · 2008: 0.1pp · 2024: -6.4pp
- All cycles
- 2024: R+6.4 2020: R+3.5 2016: R+9.2 2012: R+5.0 2008: D+0.1
Not yet ingested
- Civics
- —
Market trends
- HPI YoY
- ▼ -446.66%
- Current HPI
- 252.2725
- Rent YoY
- ▲ 4.33%
- Metro
- Medford, OR
- State GDP YoY
- ▲ 2.05%
- F500 in state
- 2
Industry mix (Fortune 500 HQ in OR)
| Industry | F500 HQs | Revenue |
|---|---|---|
| Consumer Goods | 1 | $51B |
|
||
Price history
-78.2% since first listed55 events — show timeline
- 2026-01-29 Listed $119,900 Zillow
- 2020-04-26 Listing Removed — MLSCO
- 2020-04-25 Listing Removed — MLSCO
- 2020-04-25 Listing Removed — MLSCO
- 2020-04-25 Listing Removed — MLSCO
- 2020-04-25 Listing Removed — MLSCO
- 2020-04-25 Listing Removed — MLSCO
- 2020-04-25 Listing Removed — MLSCO
- 2020-04-25 Listing Removed — MLSCO
- 2020-04-25 Listing Removed — MLSCO
- 2020-04-25 Listing Removed — MLSCO
- 2020-04-25 Listing Removed — MLSCO
- 2020-04-25 Listing Removed — MLSCO
- 2020-04-25 Listing Removed — MLSCO
- 2020-04-25 Listing Removed — MLSCO
- 2020-04-25 Listing Removed — MLSCO
- 2020-04-25 Listing Removed — MLSCO
- 2020-04-25 Listing Removed — MLSCO
- 2001-08-13 Listed $39,900 MLSCO
- 2001-08-01 Listed $48,500 MLSCO
- 2001-07-05 Sold (MLS) $10,500 MLSCO
- 2001-05-10 Listed $12,500 MLSCO
- 2001-04-03 Listed $43,900 MLSCO
- 2001-03-22 Listed $25,000 MLSCO
- 2001-01-23 Listed $43,900 MLSCO
- 2000-08-31 Listed $20,000 MLSCO
- 2000-08-25 Listed $44,500 MLSCO
- 2000-08-08 Listed $46,500 MLSCO
- 2000-07-18 Listed $43,900 MLSCO
- 2000-06-29 Listed $14,000 MLSCO
- 2000-06-28 Listed $14,000 MLSCO
- 2000-06-20 Sold (MLS) $14,000 MLSCO
- 2000-06-20 Sold (MLS) $14,000 MLSCO
- 2000-05-08 Listed $28,000 MLSCO
- 2000-01-26 Listed $12,000 MLSCO
- 1999-10-27 Sold (MLS) $41,500 MLSCO
- 1999-10-18 Listed $47,900 MLSCO
- 1999-05-20 Listed $26,500 MLSCO
- 1999-05-14 Sold (MLS) $38,500 MLSCO
- 1999-04-08 Listed $11,500 MLSCO
- 1999-03-29 Listed $43,900 MLSCO
- 1998-11-13 Listed $16,500 MLSCO
- 1998-08-07 Sold (MLS) $34,000 MLSCO
- 1998-07-15 Listed $38,900 MLSCO
- 1998-02-02 Listed $41,900 MLSCO
- 1997-08-27 Listed $13,950 MLSCO
- 1997-08-22 Listed $42,900 MLSCO
- 1997-07-31 Sold (MLS) $38,000 MLSCO
- 1997-07-02 Listed $45,000 MLSCO
- 1997-03-10 Sold (MLS) $17,000 MLSCO
- 1996-09-23 Listed $17,200 MLSCO
- 1996-08-12 Sold (MLS) $23,000 MLSCO
- 1996-05-13 Listed $24,500 MLSCO
- 1987-05-29 Sold (Public Records) $550,000 Public Records
- 1983-06-01 Sold (Public Records) $550,000 Public Records
Property tax history
+2.3%/yrLatest (2025): $25,434 · +2.3% YoY. Source: county tax records.
Cash-flow waterfall
monthlySold comps — $/sqft
last 12 mo · ≤1 miLoading sold comps…