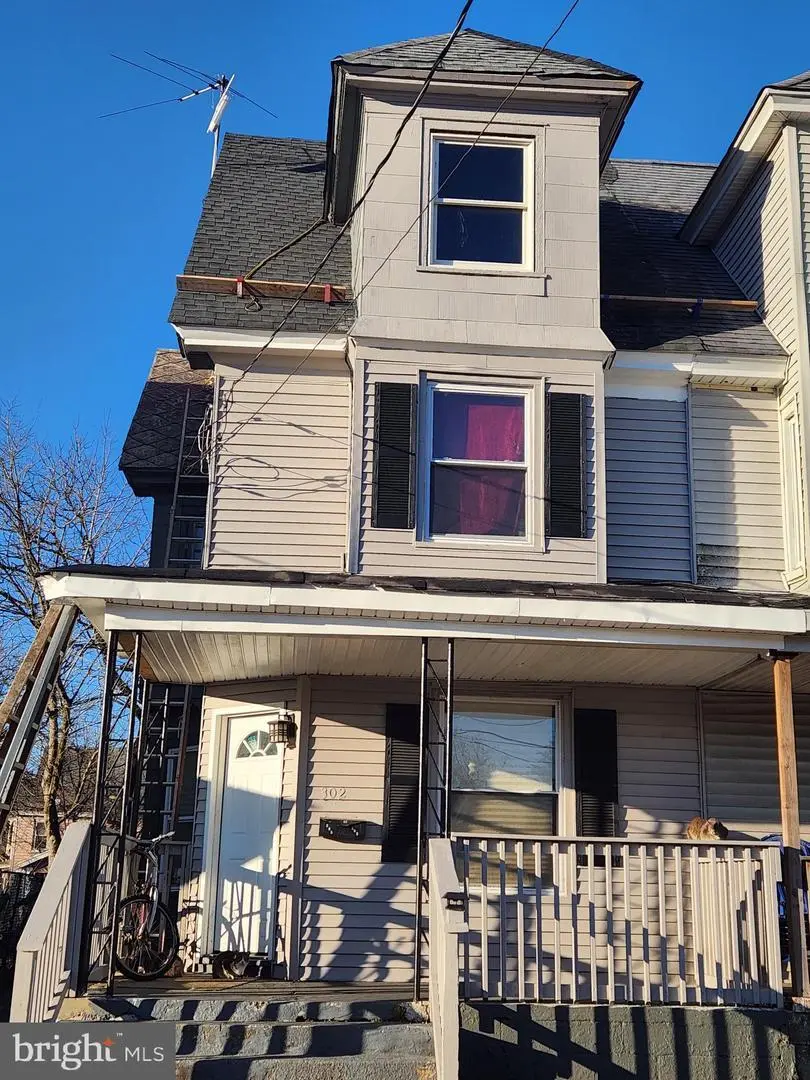
302 S 6th St S S · Millville, NJ
Flood risk 1/10 · Minimal
- FEMA flood zone
- X (unshaded)
- Chance of flooding over 30 yrs
- 0.0%
- Est. flood insurance / yr
- $507 – $1,088
Fire risk 5/10 · Moderate
- Est. fire insurance / yr
- $526 – $976
Heat risk 8/10 · Major
- Hot days now (above 103°F)
- 7 days/yr
- Hot days in 30 yrs
- 16 days/yr
Wind risk 6/10 · Moderate
- Chance of severe wind over 30 yrs
- 75.0%
Air-quality risk 3/10 · Minor
- Unhealthy air days now
- 2 days/yr
- Unhealthy air days in 30 yrs
- 4 days/yr
Risk factors via First Street. Map © Google.
Why this score? — see what drove the B- grade
The composite is a weighted blend of 9 inputs, each scored 0–100. Each bar is that input's sub-score; the figure is the points it added to the 100-point composite (weight × sub-score).
- Cash flow +26.3/30.0
- ARV discount +15.0/15.0
- DSCR +8.9/10.0
- 1% rule +7.2/10.0
- Livability +3.2/5.0
- Rent growth +3.0/5.0
- Condition / age +2.5/5.0
- Schools +1.5/10.0
- Appreciation +0.0/10.0
$139,900
🖨 Deal sheet 📄 Offer letter ✓ Due diligence
Listing remarks MLS
BACK FROM SOLD. SELLER BACKED OUT. Price reduced to $ 139,900.00. Seller wants sold. Living in a quiet neighborhood.
Key facts
- Built 1912
- Listed 95 days
Neighborhood map
What this means for you Summary
Snapshot
- This is a 3-bed/1.0-bath single-family listed at $140k.
Deal economics
- At list price, monthly cash flow is $363 ($4k/yr) — positive.
- The deal already cash-flows at list — no discount required.
- Meets the 1% rule at list price ($2k rent vs $140k).
- Recommended offer: $127k (9.0% below list) — sets the bar for market timing.
- Cap rate 9.4% vs local median 4.2% in Millville — top-decile yield for the area; either an underpriced asset or a hidden risk that comps aren't pricing in. Stress-test before assuming the spread holds.
Location & tenants
- Location reads 63/100 on livability (#431 in NJ) — a middle-class / working-renter tenant base. Strengths: housing A+, health & safety B+; Watch: schools F, crime F, amenities F.
- Millville School District (suburban): math 6% / reading 28% proficiency, ranked #447 of 472 in NJ (top 95%) — low school quality limits family demand, transient renter base, plan for 1-2y turnover; 60% free/reduced lunch — lower-income household profile, screen leases tightly.
- Market conditions: Rents rising (+1.9%/yr); 296 active listings in the ZIP; 3 comparable units currently listed for rent nearby; rentals lingering (median 44d on market — plan ~5-8 weeks vacancy on turnover, expect pricing pressure); 67% of comp listings sitting > 30 days — soft ceiling on asking rent; 216 units permitted in Cumberland County in 2024 (73 in 5+ unit buildings).
- This rent runs 30% of the median local income ($67k/yr) — at the standard rent-burdened threshold; future hikes will face affordability resistance.
Forward outlook
- Local home prices are declining (-3.0%/yr); year-one equity from $967 of loan paydown is wiped out by about $4k of value loss. Plan a longer hold.
- Cumberland County population projected to shrink 7% by 2050 — rents likely to lag national; underwrite the cash flow, not the appreciation.
Negotiation context
- It's been on market 95 days — a 9% lower offer ($127k) is reasonable based on typical stale-listing flexibility.
- 7 sale attempts since 9y ago; this cycle's ask has dropped $20k (13%) from the opening price — seller is motivated, your offer sets the floor, not the list.
- Current owner paid $12k; list at $140k implies a 1066% gain — meaningful room to come down on a strong offer.
Risks & watch-outs
- Watch-outs: built in 1912 — expect roof / HVAC / electrical / plumbing capex.
- Climate carrying-cost: major wind risk, 75% chance of damaging wind over 30y; moderate wildfire risk; extreme-heat days projected 7→16/yr by 2055 (HVAC capex compounding) — expect insurance premiums to compound above CPI over the hold.
Questions for the listing agent
- It's been on market 95 days. Have you received any prior offers? Is the seller open to a 9% concession, seller financing, or rate buy-down credit?
- Built in 1912 — when were the roof, HVAC, electrical panel, plumbing, and water heater last replaced?
- Why hasn't it sold? Are there any deal-killer items the seller is aware of (foundation, flood, title, zoning, code violations)?
- Is there a deadline driving the sale (1031 exchange, divorce, estate, relocation)? That informs how much negotiation room exists.
- Schools are F-rated, which usually means shorter tenancies and higher turnover. Who's the typical renter profile here, and what's been the actual vacancy rate?
- Crime grade is F in this area — have there been break-ins, vandalism, or insurance claims at this property in the last 3 years? What carrier currently insures it and at what premium?
- What's the average days-on-market for RENTAL listings here right now (not sales)? A rising rental-DOM trend means longer vacancies and softer asking-rent achievability than the comps imply.
- What's the recent tenant-quality profile in this submarket — average credit score on applications, eviction rate, late-payment / NSF rate, and stable-employment percentage? A property-management company in the area should have these aggregated.
- How much new for-sale + rental construction is in the pipeline within 1–3 miles? Heavy new supply typically softens prices + rents 12–24 months out; constrained supply supports both.
Investment metrics
- 1% rule
- 1.22% ✓
- Cap rate
- 9.41%
- Cash-on-cash
- 11.12%
- DSCR
- 1.49
- GRM
- 6.8
CMA / ARV
- ARV (on-the-fly)
- $241,113
- Comps found
- 12
Show comp detail 12 sales within ~0.75 mi
| Address | Dist | Beds/Ba | Sqft | Sold | Price | $/sf | Match |
|---|---|---|---|---|---|---|---|
| 16 N 5th St N | 0.21mi | 3/1.0 | 1,312 (-3%) | 5mo | $125,000 | $95 | 82 |
| 207 S 9th St | 0.25mi | 3/2.5 | 1,384 (+3%) | 0mo | $335,000 | $242 | 77 |
| 309 S 2nd St | 0.22mi | 3/1.0 | 1,406 (+4%) | 8mo | $190,000 | $135 | 76 |
| 204 N 8th St | 0.35mi | 3/1.5 | 1,300 (-4%) | 8mo | $215,000 | $165 | 70 |
| 700 Magnolia Ave | 0.52mi | 3/1.0 | 1,397 (+4%) | 3mo | $299,900 | $215 | 67 |
| 15 N 13th St | 0.53mi | 3/2.0 | 1,346 (-0%) | 7mo | $240,000 | $178 | 66 |
| 6 N 10th St | 0.34mi | 3/1.0 | 1,221 (-9%) | 6mo | $255,000 | $209 | 63 |
| 1310 E Main St | 0.54mi | 3/2.5 | 1,387 (+3%) | 2mo | $350,000 | $252 | 62 |
| 502 E Main St | 0.17mi | 2/1.0 (-1) | 1,160 (-14%) | 2mo | $129,000 | $111 | 62 |
| 909 Shar Lane Blvd | 0.71mi | 3/1.0 | 1,216 (-10%) | 2mo | $218,000 | $179 | 49 |
| 3 Madison Pl | 0.72mi | 3/2.0 | 1,280 (-5%) | 7mo | $168,000 | $131 | 48 |
| 917 Louis Dr | 0.75mi | 3/1.0 | 1,216 (-10%) | 2mo | $280,000 | $230 | 48 |
Match score weights: distance 35% · size 25% · config 20% · recency 20%. Top-matched comps best support the ARV.
Projected returns pro-forma
-3.0% appreciation · 1.94% rent growth · sell at horizon
- IRR
- -0.9%
- Equity multiple
- 0.97×
- Total profit
- $-1,314
- Equity at exit
- $20,860
- IRR
- 7.6%
- Equity multiple
- 1.55×
- Total profit
- $21,539
- Equity at exit
- $12,096
Cash invested: $39,172 (down + closing). Projections, not guarantees.
Landlord ↔ Tenant lean methodology
- Overall (STATE)
- 21 Tenant-Leaning
- State New Jersey
- 21 Tenant-Leaning · D+6
- County
- — inherits STATE
- City
- — inherits STATE
ZIP-level market 08332
- Home prices YoY
- -28.9%
- Rents YoY
- 1.9%
- Active inventory
- 296
- Price-to-rent
- 6.8×
Monthly cashflow live
- Estimated rent
- $1,708 medium interval (Pro) →
- Mortgage (P&I)
- −$734
- Tax from tax record
- −$194 /mo · $2,332/yr
- Insurance
- −$58
- HOA
- −$0
- Vacancy / Maint / Mgmt
- −$359
- Net cashflow
- $363
Break-even live
UW: 25.0% down · 7.5% · 30yr · 1.5% tax · 5.0% vac · 8.0% maint · 8.0% mgmt
Financing live
Cash to close
- Down payment
- $34,975
- Closing costs
- $4,197
- Reserves months
- —
- Total cash needed
- —
Loan-product check · same deal, 3 products live
Conventional
25% down · 7.5% · 30yr
- Down + closing
- —
- Monthly P&I
- —
- Monthly cashflow
- —
- DSCR
- —
- Eligible?
- —
Personal DTI + credit; lowest rate.
DSCR
20% down · 8.5% · 30yr
- Down + closing
- —
- Monthly P&I
- —
- Monthly cashflow
- —
- DSCR
- —
- Eligible?
- —
No personal income docs; deal must DSCR.
Hard money
10% down · 12.0% · 12mo
- Down + closing
- —
- Monthly P&I
- —
- Monthly cashflow
- —
- DSCR
- —
- Eligible?
- —
Short-term bridge; refi at stabilization.
Rent comps 3 comps
| Address | Beds | Baths | Sqft | Rent | $/sqft | DOM | Units | Dist |
|---|---|---|---|---|---|---|---|---|
| 112 W Main St Unit B Millville, NJ | 3.0 | 1.0 | 1384 | $1,500 | $1.08 | 43d | 1 | 0.66mi |
| 313 W Main St Millville, NJ | 3.0 | 1.5 | 1265 | $1,650 | $1.30 | 43d | 1 | 0.86mi |
| 301 N Wade Blvd Millville, NJ | 1.0–2.0 | 1.0 | 1005 | $1,715 | $1.71 | 13d | 10 | 0.87mi |
Listing history 23 events
-
2026-06-02days on market $139,900 Active 95 DOM
-
2026-06-01days on market $139,900 Active 94 DOM
-
2026-05-31days on market $139,900 Active 93 DOM
-
2026-05-30days on market $139,900 Active 92 DOM
-
2026-05-19price $139,900 116-char remark
Show marketing remark (116 chars)
BACK FROM SOLD. SELLER BACKED OUT. Price reduced to $ 139,900.00. Seller wants sold. Living in a quiet neighborhood.
-
2026-05-18status Active 116-char remark
Show marketing remark (116 chars)
BACK FROM SOLD. SELLER BACKED OUT. Price reduced to $ 139,900.00. Seller wants sold. Living in a quiet neighborhood.
-
2026-04-28status Pending 116-char remark
Show marketing remark (116 chars)
BACK FROM SOLD. SELLER BACKED OUT. Price reduced to $ 139,900.00. Seller wants sold. Living in a quiet neighborhood.
-
2026-04-15status Active 116-char remark
Show marketing remark (116 chars)
BACK FROM SOLD. SELLER BACKED OUT. Price reduced to $ 139,900.00. Seller wants sold. Living in a quiet neighborhood.
-
2026-04-13historical Active Under Contract 116-char remark
Show marketing remark (116 chars)
BACK FROM SOLD. SELLER BACKED OUT. Price reduced to $ 139,900.00. Seller wants sold. Living in a quiet neighborhood.
-
2026-04-10price $155,000 116-char remark
Show marketing remark (116 chars)
BACK FROM SOLD. SELLER BACKED OUT. Price reduced to $ 139,900.00. Seller wants sold. Living in a quiet neighborhood.
-
2026-02-06$160,000 Active 116-char remark
Show marketing remark (116 chars)
BACK FROM SOLD. SELLER BACKED OUT. Price reduced to $ 139,900.00. Seller wants sold. Living in a quiet neighborhood.
-
2026-01-31historical $160,000 116-char remark
Show marketing remark (116 chars)
BACK FROM SOLD. SELLER BACKED OUT. Price reduced to $ 139,900.00. Seller wants sold. Living in a quiet neighborhood.
-
2017-09-01soldstatus $12,000 21-char remark
Show marketing remark (21 chars)
Attention investors!!
-
2017-09-01soldstatus $12,000
Show marketing remark (21 chars)
Attention investors!!
-
2017-09-01soldstatus $12,000 Sold
Show marketing remark (21 chars)
Attention investors!!
-
2017-07-31historical Under Contract
-
2017-07-31historical
-
2017-07-20price $9,900
-
2017-02-11$19,900 Active
Show marketing remark (21 chars)
Attention investors!!
-
2017-02-11$12,000 21-char remark
Show marketing remark (21 chars)
Attention investors!!
-
2017-02-11
Show marketing remark (21 chars)
Attention investors!!
-
2017-02-11$19,900
Show marketing remark (21 chars)
Attention investors!!
-
1994-08-02soldstatus $41,900
ⓘ Source: listings_history table (triggers on properties + properties_extension) + one-shot
backfill from property_details.listing_events for pre-trigger history.
Tax reassessment forecast NJ · Partial reset (capped growth)
- Current annual tax
- $2,332 · $194/mo
- Projected year-2 tax
- $2,908 · $242/mo
- Expected delta
- +$576/yr (+$48/mo · 24.7%)
ⓘ Screening estimate from a state-policy table — verify with the county assessor before closing.
Climate risk First Street
- Flood 1/10 Low FEMA zone X (unshaded) · 0% chance over 30 yrs
- Wildfire 5/10 Major
- Heat 8/10 Severe 7 d/yr ≥103°F today · 16 d/yr by 30 yrs out
- Wind 6/10 Major 75% chance of damaging wind over 30 yrs
- Air quality 3/10 Moderate 2 unhealthy d/yr today · 4 by 30 yrs out
Nearby sold comps map
Loading sold comps map…
Walkable amenities ~0.75 mi
Loading nearby amenities…
Taxation est. · year 1
- Rental income
- $20,496
- − Mortgage interest
- −$7,837
- − Property taxes
- −$2,332
- − Insurance
- −$700
- − Repairs & maintenance
- −$1,640
- − Management
- −$1,640
- − Depreciation
- −$4,070
- Taxable income
- $2,278
- Est. tax owed @ 24.0%
- −$547
- After-tax cash flow
- $3,809/yr
For passive investors: Depreciation is non-cash, so a rental often shows a tax loss while cash-flowing — sheltering income. Rental losses are passive: they offset passive income freely, and up to $25,000/yr can offset ordinary (W-2) income if you actively participate and your MAGI is under $100k (phasing out to $0 by $150k); unused losses carry forward. On sale, claimed depreciation is recaptured at up to 25%, and gains may owe capital-gains tax (a 1031 exchange can defer both). Figures are a year-1 estimate at your 24.0% rate — not tax advice; consult a CPA.
Schools (NCES district)
- District
- Millville School District
- NCES district ID
- 3410320
- Math proficiency
- 6% ▼ -11.00%
- Reading proficiency
- 28% ▲ 1.00%
- Median HH income
- $48,851
- Composite
- 15.23/100
- National rank
- #9338
- State rank
- #447 of 472 in NJ
Livability — Millville
- Score
- 63/100
- State rank
- #431
- US rank
- #15561
Category grades
Schools grade is shown separately in the Schools card above.
Census & demographics
- Census place
- Millville, NJ
- County
- Cumberland County · 80,266 people
- City population
- 35,228
- Metro
- Vineland-Bridgeton, NJ
- Population (ZIP)
- 35,228
- Household income
- $67,496
- Rent vs Own
- Severe rent burden
- 1761.0
Population outlook (Cumberland County) Hauer SSP2
- Today (2025)
- 152,743 people
- By 2030
- 150,373 · -1.6%
- By 2040
- 146,881 · -3.8%
- By 2050
- 142,653 · -6.6%
- By 2075
- 129,468 · -15.2%
- By 2100
- 107,456 · -29.6%
Race, ethnicity, and origin ACS 2023
- Neighborhood character
- Diverse neighborhood (Simpson 0.60)
- Race & ethnicity
- White 59% Hispanic / Latino 17% Black 15% Two or more races 11% Asian 2%
- Hispanic origin (detail)
- Mexican 4% Puerto Rican 10%
- Common ancestry
- Romanian 4% Lithuanian 2% Slovak 1%
- Foreign-born
- 7% · Canada
- Languages at home
- 85% English-only · Spanish 11% Other Indo-European 1% Other Asian/Pacific 1%
Political lean MEDSL · Cumberland
- 2024 margin
- Toss-up / Even · D 47.6% · R 51.3% · Other 1.1%
- 2008→2024 swing
- -25.4pp toward R · 2008: 21.6pp · 2024: -3.8pp
- All cycles
- 2024: R+3.8 2020: D+6.0 2016: D+5.3 2012: D+23.1 2008: D+21.6
Not yet ingested
- Civics
- —
Market trends
- HPI YoY
- ▼ -111.45%
- Current HPI
- 274.8011
- Rent YoY
- ▲ 1.94%
- Metro
- Vineland-Bridgeton, NJ
- State GDP YoY
- ▲ 2.05%
- F500 in state
- 34
Industry mix (Fortune 500 HQ in NJ)
| Industry | F500 HQs | Revenue |
|---|---|---|
| Consumer Goods | 3 | $31B |
|
||
| Pharmaceuticals | 2 | $153B |
|
||
| Technology | 2 | $21B |
|
||
| Insurance | 2 | $20B |
|
||
| Healthcare | 2 | $19B |
|
||
| Financial Services | 1 | $70B |
|
||
Price history
+233.9% since first listed19 events — show timeline
- 2026-05-19 Price Changed $139,900 BRIGHT MLS
- 2026-05-18 Relisted — BRIGHT MLS
- 2026-04-28 Pending — BRIGHT MLS
- 2026-04-15 Relisted — BRIGHT MLS
- 2026-04-13 Contingent — BRIGHT MLS
- 2026-04-10 Price Changed $155,000 BRIGHT MLS
- 2026-02-06 Listed $160,000 BRIGHT MLS
- 2026-01-31 Coming Soon $160,000 BRIGHT MLS
- 2017-09-01 Sold (MLS) $12,000 SJSRMLS
- 2017-09-01 Sold (MLS) $12,000 TREND
- 2017-09-01 Sold (MLS) $12,000 BRIGHT MLS
- 2017-07-31 Contingent — SJSRMLS
- 2017-07-31 Listing Removed — BRIGHT MLS
- 2017-07-20 Price Changed $9,900 SJSRMLS
- 2017-02-11 Listed $19,900 SJSRMLS
- 2017-02-11 Listed $19,900 BRIGHT MLS
- 2017-02-11 Listed — TREND
- 2017-02-11 Listed $12,000 BRIGHT MLS
- 1994-08-02 Sold (Public Records) $41,900 Public Records
Property tax history
+2.1%/yrLatest (2025): $2,332 · +3.3% YoY. Source: county tax records.
Cash-flow waterfall
monthlySold comps — $/sqft
last 12 mo · ≤1 miLoading sold comps…