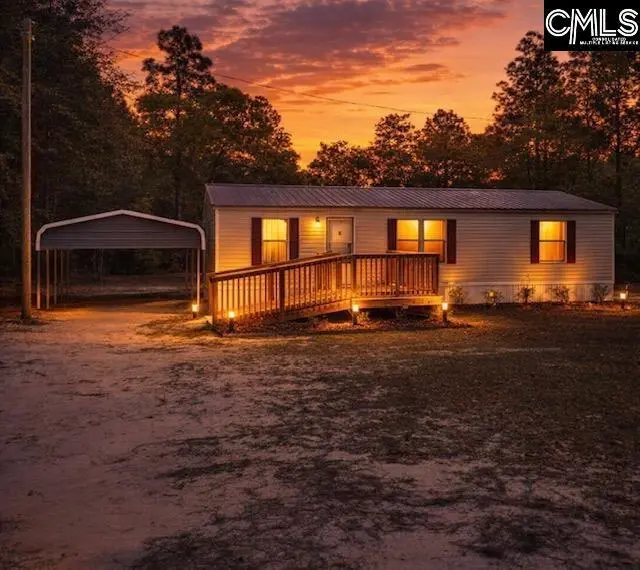
134 Wilma Ann Dr · Red Bank, SC
Flood risk 1/10 · Minimal
- FEMA flood zone
- X (unshaded)
- Chance of flooding over 30 yrs
- 0.0%
- Est. flood insurance / yr
- $507 – $1,088
Fire risk 5/10 · Moderate
- Est. fire insurance / yr
- $783 – $1,453
Heat risk 6/10 · Moderate
- Hot days now (above 108°F)
- 7 days/yr
- Hot days in 30 yrs
- 16 days/yr
Wind risk 6/10 · Moderate
- Chance of severe wind over 30 yrs
- 68.0%
Air-quality risk 3/10 · Minor
- Unhealthy air days now
- 2 days/yr
- Unhealthy air days in 30 yrs
- 2 days/yr
Risk factors via First Street. Map © Google.
Why this score? — see what drove the B- grade
The composite is a weighted blend of 9 inputs, each scored 0–100. Each bar is that input's sub-score; the figure is the points it added to the 100-point composite (weight × sub-score).
- Cash flow +28.0/30.0
- DSCR +10.0/10.0
- 1% rule +7.7/10.0
- ARV discount +7.5/15.0
- Schools +4.2/10.0
- Rent growth +3.3/5.0
- Livability +3.3/5.0
- Condition / age +2.5/5.0
- Appreciation +0.0/10.0
$129,999
🖨 Deal sheet (PDF) 📄 Offer letter ✓ Due diligence
Listing remarks
Fantastic Opportunity on a Spacious 1/2 Acre Lot! This 3 bedroom / 2 bath home offers the perfect blend of comfort, convenience, and a peaceful country feel—all while being just minutes from the highly desired White Knoll Corridor. Recent Upgrades & Features: NEW HVAC system, NEW front porch, NEW rear porch, NEW 16' x 20' carport, Newer metal roof, 10' x 10' Storage Shed and Well Water. The Open / split floor plan is ideal for modern living! The Rear Porch overlooks a Wooded flat lot offering privacy and room to enjoy the outdoors! This Prime Location offers a Quiet, country-style setting with easy access to everything you need and Minutes from Saxe Gotha Elementary, White Kn
Key facts
- New carport
- 1/2 acre lot
- New front porch
Tags
Neighborhood map
What this means for you Summary
Snapshot
- This is a 3-bed/2.0-bath manufactured listed at $130k.
Deal economics
- At list price, monthly cash flow is $406 ($5k/yr) — positive.
- The deal already cash-flows at list — no discount required.
- Meets the 1% rule at list price ($2k rent vs $130k).
Location & tenants
- Location reads 66/100 on livability (#121 in SC) — a middle-class / working-renter tenant base. Strengths: cost of living A+, housing A+, health & safety B; Watch: employment C-, crime D+, amenities F.
- Lexington 01 (suburban): math 42% / reading 53% proficiency, ranked #11 of 80 in SC (top 14%) — families likely to look elsewhere, expect single-tenant / working-renter base with shorter leases.
- Zoned schools: Saxe Gotha Elementary (math 35% / reading 40%, grade F, #311 of 597 statewide, top 53%, 686 students, 100% FRL); White Knoll High (math 47% / reading 85%, grade B, #81 of 196 statewide, top 42%, 2,204 students, 45% FRL) — zoned schools average 73% FRL vs 30% district-wide (42 pts higher); higher-poverty schools than district average — tighter screening recommended.
- Market conditions: Rents rising (+3.2%/yr); 564 active listings in the ZIP; 3 comparable units currently listed for rent nearby; rentals leasing fast (median 4d on market — plan ~1-2 weeks tenant-placement turnaround); solid renter incomes; 1,712 units permitted in Lexington County in 2024 (0 in 5+ unit buildings).
Forward outlook
- Local home prices are declining (-3.0%/yr); year-one equity from $899 of loan paydown is wiped out by about $4k of value loss. Plan a longer hold.
- Lexington County population projected at +26% by 2050 — long-run rental-demand tailwind backs the buy-and-hold thesis.
- At projected returns (-3.0% appreciation + 3.2% rent growth), your $36k cash investment doubles in ~9 years — after that, you're playing with house money.
Negotiation context
- Only 5 days on market — expect competitive offers; lowballing is unlikely to land.
Risks & watch-outs
- Climate carrying-cost: major wind risk, 68% chance of damaging wind over 30y; moderate wildfire risk; extreme-heat days projected 7→16/yr by 2055 (HVAC capex compounding) — expect insurance premiums to compound above CPI over the hold.
Questions for the listing agent
- Is there a deadline driving the sale (1031 exchange, divorce, estate, relocation)? That informs how much negotiation room exists.
- Schools are F-rated, which usually means shorter tenancies and higher turnover. Who's the typical renter profile here, and what's been the actual vacancy rate?
- Crime grade is D in this area — have there been break-ins, vandalism, or insurance claims at this property in the last 3 years? What carrier currently insures it and at what premium?
- What's the average days-on-market for RENTAL listings here right now (not sales)? A rising rental-DOM trend means longer vacancies and softer asking-rent achievability than the comps imply.
- What's the recent tenant-quality profile in this submarket — average credit score on applications, eviction rate, late-payment / NSF rate, and stable-employment percentage? A property-management company in the area should have these aggregated.
- How much new for-sale + rental construction is in the pipeline within 1–3 miles? Heavy new supply typically softens prices + rents 12–24 months out; constrained supply supports both.
Investment metrics
- 1% rule
- 1.27% ✓
- Cap rate
- 10.04%
- Cash-on-cash
- 13.40%
- DSCR
- 1.60
- GRM
- 6.6
CMA / ARV
No comps found within radius.
Projected returns pro-forma
-3.0% appreciation · 3.24% rent growth · sell at horizon
- IRR
- 3.7%
- Equity multiple
- 1.14×
- Total profit
- $5,245
- Equity at exit
- $19,383
- IRR
- 13.5%
- Equity multiple
- 2.09×
- Total profit
- $39,648
- Equity at exit
- $11,240
Cash invested: $36,400 (down + closing). Projections, not guarantees.
Landlord ↔ Tenant lean methodology
- Overall (STATE)
- 90 Strongly Landlord-Friendly
- State South Carolina
- 90 Strongly Landlord-Friendly · R+6
- County
- — inherits STATE
- City
- — inherits STATE
ZIP-level market 29073
- Home prices YoY
- -19.1%
- Rents YoY
- 3.2%
- Active inventory
- 564
- Price-to-rent
- 6.6×
Monthly cashflow live
- Estimated rent
- $1,652 medium interval (Pro) →
- Mortgage (P&I)
- −$682
- Tax est. 1.5%
- −$162 /mo · $1,950/yr
- Insurance
- −$54
- HOA
- −$0
- Vacancy / Maint / Mgmt
- −$347
- Net cashflow
- $406
Break-even live
Sensitivity live
| Price | -10% $496 | -5% $451 | +0% $406 | +5% $362 | +10% $317 |
|---|---|---|---|---|---|
| Rent | -10% $276 | -5% $341 | +0% $406 | +5% $472 | +10% $537 |
| Rate | -1.0pp $472 | -0.5pp $439 | base $406 | +0.5pp $373 | +1.0pp $338 |
UW: 25.0% down · 7.5% · 30yr · 1.5% tax · 5.0% vac · 8.0% maint · 8.0% mgmt
Financing live
Cash to close
- Down payment
- $32,500
- Closing costs
- $3,900
- Reserves months
- —
- Total cash needed
- —
Loan-product check · same deal, 3 products live
Conventional
25% down · 7.5% · 30yr
- Down + closing
- —
- Monthly P&I
- —
- Monthly cashflow
- —
- DSCR
- —
- Eligible?
- —
Personal DTI + credit; lowest rate.
DSCR
20% down · 8.5% · 30yr
- Down + closing
- —
- Monthly P&I
- —
- Monthly cashflow
- —
- DSCR
- —
- Eligible?
- —
No personal income docs; deal must DSCR.
Hard money
10% down · 12.0% · 12mo
- Down + closing
- —
- Monthly P&I
- —
- Monthly cashflow
- —
- DSCR
- —
- Eligible?
- —
Short-term bridge; refi at stabilization.
Rent comps 3 comps
| Address | Beds | Baths | Sqft | Rent | $/sqft | DOM | Units | Dist |
|---|---|---|---|---|---|---|---|---|
| 102A Wilhowie Dr Lexington, SC | 3.0 | 2.0 | 925 | $1,450 | $1.57 | 15d | 1 | 1.12mi |
| 600 Fern Hall Dr Lexington, SC | 2.0–3.0 | 2.0 | 1071 | $1,277 | $1.19 | 3d | 1 | 1.21mi |
| 123 Brevard Pkwy Lexington, SC | 1.0–3.0 | 1.0–2.0 | 1097 | $1,275 | $1.16 | 3d | 1 | 1.28mi |
Listing history 2 events
-
2026-04-07status Pending
-
2026-04-03$129,999 Active
ⓘ Source: listings_history table (triggers on properties + properties_extension) + one-shot
backfill from property_details.listing_events for pre-trigger history.
Climate risk First Street
- Flood 1/10 Low FEMA zone X (unshaded) · 0% chance over 30 yrs
- Wildfire 5/10 Major
- Heat 6/10 Major 7 d/yr ≥108°F today · 16 d/yr by 30 yrs out
- Wind 6/10 Major 68% chance of damaging wind over 30 yrs
- Air quality 3/10 Moderate 2 unhealthy d/yr today · 2 by 30 yrs out
Nearby sold comps map
Loading sold comps map…
Walkable amenities ~0.75 mi
Loading nearby amenities…
Taxation est. · year 1
- Rental income
- $19,820
- − Mortgage interest
- −$7,282
- − Property taxes
- −$1,950
- − Insurance
- −$650
- − Repairs & maintenance
- −$1,586
- − Management
- −$1,586
- − Depreciation
- −$3,782
- Taxable income
- $2,985
- Est. tax owed @ 24.0%
- −$716
- After-tax cash flow
- $4,161/yr
For passive investors: Depreciation is non-cash, so a rental often shows a tax loss while cash-flowing — sheltering income. Rental losses are passive: they offset passive income freely, and up to $25,000/yr can offset ordinary (W-2) income if you actively participate and your MAGI is under $100k (phasing out to $0 by $150k); unused losses carry forward. On sale, claimed depreciation is recaptured at up to 25%, and gains may owe capital-gains tax (a 1031 exchange can defer both). Figures are a year-1 estimate at your 24.0% rate — not tax advice; consult a CPA.
Schools (NCES district)
- District
- Lexington 01
- NCES district ID
- 4502700
- Math proficiency
- 42% ▼ -12.00%
- Reading proficiency
- 53% ▼ -2.00%
- Median HH income
- $61,298
- Composite
- 41.75/100
- National rank
- #3399
- State rank
- #11 of 80 in SC
Livability — Red Bank
- Score
- 66/100
- State rank
- #121
- US rank
- #11985
Category grades
Schools grade is shown separately in the Schools card above.
Census & demographics
- Census place
- Red Bank, SC
- County
- Lexington County · 232,571 people
- Metro
- Columbia, SC
- Population (ZIP)
- 53,156
- Household income
- $77,229
- Rent vs Own
- Severe rent burden
- 935.0
Population outlook (Lexington County) Hauer SSP2
- Today (2025)
- 322,999 people
- By 2030
- 342,356 · +6.0%
- By 2040
- 377,715 · +16.9%
- By 2050
- 406,984 · +26.0%
- By 2075
- 465,447 · +44.1%
- By 2100
- 485,674 · +50.4%
Race, ethnicity, and origin ACS 2023
- Neighborhood character
- Predominantly White (72%)
- Race & ethnicity
- White 72% Black 14% Two or more races 7% Hispanic / Latino 6% Asian 2%
- Hispanic origin (detail)
- Mexican 2% Puerto Rican 1%
- Common ancestry
- Romanian 3% Italian 2% Slovak 1%
- Foreign-born
- 4% · Canada, China
- Languages at home
- 93% English-only · Spanish 5% Other Indo-European 1%
Political lean MEDSL · Lexington
- 2024 margin
- Solid R (+33.5) · D 32.5% · R 66.0% · Other 1.4%
- 2008→2024 swing
- +4.6pp toward D · 2008: -38.0pp · 2024: -33.5pp
- All cycles
- 2024: R+33.5 2020: R+30.1 2016: R+36.7 2012: R+37.8 2008: R+38.0
Not yet ingested
- Civics
- —
Market trends
- HPI YoY
- ▼ -59.20%
- Current HPI
- 249.8957
- Rent YoY
- ▲ 3.24%
- Metro
- Columbia, SC
- State GDP YoY
- ▲ 4.51%
- F500 in state
- 2
Industry mix (Fortune 500 HQ in SC)
| Industry | F500 HQs | Revenue |
|---|---|---|
| Packaging | 1 | $7B |
|
||
Price history
2 events — show timeline
- 2026-04-07 Pending — Consolidated MLS
- 2026-04-03 Listed $129,999 Consolidated MLS
Property tax history
-42.5%/yrLatest (2016): $74 · -67.0% YoY. Source: county tax records.
Cash-flow waterfall
monthlySold comps — $/sqft
last 12 mo · ≤1 miLoading sold comps…