687 Little Rd · Rayville, LA
Flood risk 1/10 · Minimal
- FEMA flood zone
- X
- Chance of flooding over 30 yrs
- 0.0%
- Est. flood insurance / yr
- $507 – $1,088
Fire risk 3/10 · Minor
- Est. fire insurance / yr
- $1,269 – $2,357
Heat risk 7/10 · Major
- Hot days now (above 109°F)
- 7 days/yr
- Hot days in 30 yrs
- 20 days/yr
Wind risk 8/10 · Major
- Chance of severe wind over 30 yrs
- 80.0%
Air-quality risk 1/10 · Minimal
- Unhealthy air days now
- 0 days/yr
- Unhealthy air days in 30 yrs
- 0 days/yr
Risk factors via First Street. Map © Google.
Why this score? — see what drove the C+ grade
The composite is a weighted blend of 9 inputs, each scored 0–100. Each bar is that input's sub-score; the figure is the points it added to the 100-point composite (weight × sub-score).
- Cash flow +29.1/30.0
- DSCR +10.0/10.0
- ARV discount +7.5/15.0
- 1% rule +7.1/10.0
- Livability +3.2/5.0
- Rent growth +2.5/5.0
- Condition / age +2.5/5.0
- Schools +1.4/10.0
- Appreciation +0.0/10.0
$175,000
🖨 Deal sheet 📄 Offer letter ✓ Due diligence
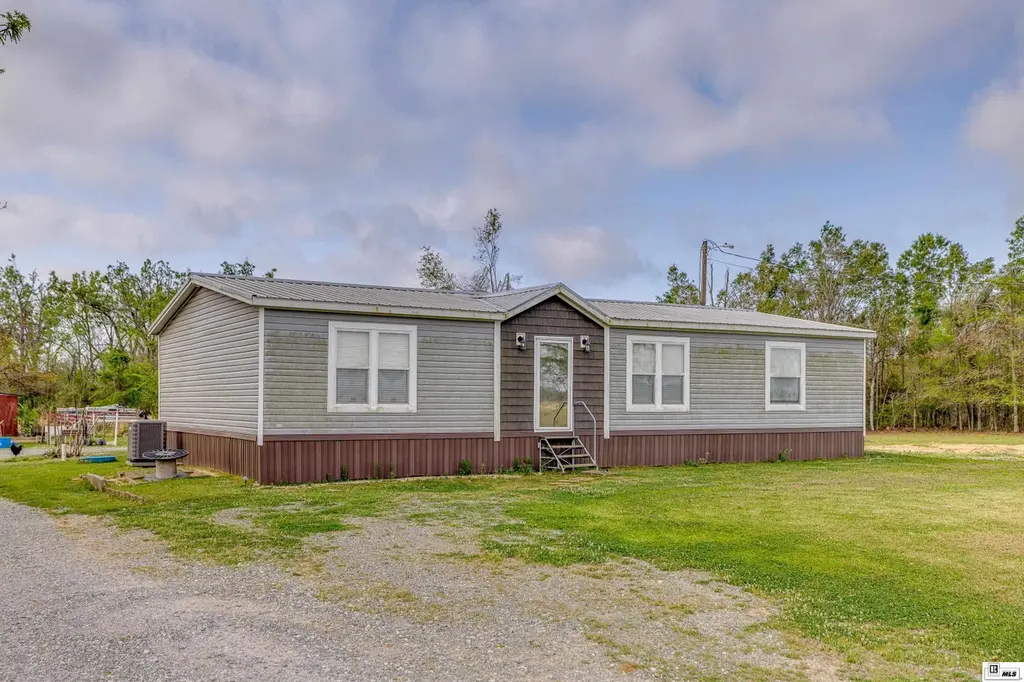
Listing remarks
Welcome to 687 Little Rd in Rayville—peaceful country living on 4.65 acres! This 3-bedroom, 2-bath manufactured home offers a comfortable layout with plenty of space both inside and out. Enjoy relaxing evenings on the screened-in back porch, perfect for taking in the surrounding property while staying protected from the elements. The home also features an attached two-car carport for convenient covered parking. With over four acres of land, there’s ample room for outdoor activities, gardening, or simply enjoying the privacy and open space. This property is a great opportunity for those seeking a quiet rural setting with room to spread out and is located only minutes from Meta.
Key facts
- Quiet rural setting
- 4.65 acres
- 4.65 acre lot
Tags
Neighborhood map
What this means for you Summary
Snapshot
- This is a 3-bed/2.0-bath manufactured listed at $175k.
Deal economics
- At list price, monthly cash flow is $602 ($7k/yr) — positive.
- The deal already cash-flows at list — no discount required.
- Meets the 1% rule at list price ($2k rent vs $175k).
Location & tenants
- Location reads 65/100 on livability (#158 in LA) — a middle-class / working-renter tenant base. Strengths: cost of living A+, health & safety A+; Watch: crime C-, schools F, amenities F.
- Richland Parish (rural): math 12% / reading 22% proficiency, ranked #73 of 98 in LA (top 74%) — low school quality limits family demand, transient renter base, plan for 1-2y turnover; 76% free/reduced lunch — lower-income household profile, screen leases tightly.
- Market conditions: 100 active listings in the ZIP; 27 units permitted in Richland Parish in 2024 (0 in 5+ unit buildings).
Forward outlook
- Local home prices are declining (-3.0%/yr); year-one equity from $1k of loan paydown is wiped out by about $5k of value loss. Plan a longer hold.
- Richland County population projected to shrink 9% by 2050 — rents likely to lag national; underwrite the cash flow, not the appreciation.
- At projected returns (-3.0% appreciation + 3.0% rent growth), your $49k cash investment doubles in ~8 years — after that, you're playing with house money.
Negotiation context
- Only 6 days on market — expect competitive offers; lowballing is unlikely to land.
Risks & watch-outs
- Climate carrying-cost: severe wind risk, 80% chance of damaging wind over 30y; extreme-heat days projected 7→20/yr by 2055 (HVAC capex compounding) — expect insurance premiums to compound above CPI over the hold.
Questions for the listing agent
- Is there a deadline driving the sale (1031 exchange, divorce, estate, relocation)? That informs how much negotiation room exists.
- Schools are F-rated, which usually means shorter tenancies and higher turnover. Who's the typical renter profile here, and what's been the actual vacancy rate?
- What's the average days-on-market for RENTAL listings here right now (not sales)? A rising rental-DOM trend means longer vacancies and softer asking-rent achievability than the comps imply.
- What's the recent tenant-quality profile in this submarket — average credit score on applications, eviction rate, late-payment / NSF rate, and stable-employment percentage? A property-management company in the area should have these aggregated.
- How much new for-sale + rental construction is in the pipeline within 1–3 miles? Heavy new supply typically softens prices + rents 12–24 months out; constrained supply supports both.
Investment metrics
- 1% rule
- 1.21% ✓
- Cap rate
- 10.42%
- Cash-on-cash
- 14.75%
- DSCR
- 1.66
- GRM
- 6.9
CMA / ARV
No comps found within radius.
Projected returns pro-forma
-3.0% appreciation · 3.0% rent growth · sell at horizon
- IRR
- 5.2%
- Equity multiple
- 1.20×
- Total profit
- $9,942
- Equity at exit
- $26,093
- IRR
- 14.6%
- Equity multiple
- 2.18×
- Total profit
- $57,830
- Equity at exit
- $15,131
Cash invested: $49,000 (down + closing). Projections, not guarantees.
Landlord ↔ Tenant lean methodology
- Overall (STATE)
- 90 Strongly Landlord-Friendly
- State Louisiana
- 90 Strongly Landlord-Friendly · R+12
- County
- — inherits STATE
- City
- — inherits STATE
ZIP-level market 71269
- Home prices YoY
- -26.4%
- Active inventory
- 100
- Price-to-rent
- 6.9×
Monthly cashflow live
- Estimated rent
- $2,120 medium interval (Pro) →
- Mortgage (P&I)
- −$918
- Tax from tax record
- −$82 /mo · $980/yr
- Insurance
- −$73
- HOA
- −$0
- Vacancy / Maint / Mgmt
- −$445
- Net cashflow
- $602
Break-even live
UW: 25.0% down · 7.5% · 30yr · 1.5% tax · 5.0% vac · 8.0% maint · 8.0% mgmt
Financing live
Cash to close
- Down payment
- $43,750
- Closing costs
- $5,250
- Reserves months
- —
- Total cash needed
- —
Loan-product check · same deal, 3 products live
Conventional
25% down · 7.5% · 30yr
- Down + closing
- —
- Monthly P&I
- —
- Monthly cashflow
- —
- DSCR
- —
- Eligible?
- —
Personal DTI + credit; lowest rate.
DSCR
20% down · 8.5% · 30yr
- Down + closing
- —
- Monthly P&I
- —
- Monthly cashflow
- —
- DSCR
- —
- Eligible?
- —
No personal income docs; deal must DSCR.
Hard money
10% down · 12.0% · 12mo
- Down + closing
- —
- Monthly P&I
- —
- Monthly cashflow
- —
- DSCR
- —
- Eligible?
- —
Short-term bridge; refi at stabilization.
Listing history 3 events
-
2026-04-09status Pending
-
2026-04-02$175,000 Active
-
2008-01-10soldstatus
ⓘ Source: listings_history table (triggers on properties + properties_extension) + one-shot
backfill from property_details.listing_events for pre-trigger history.
Tax reassessment forecast LA · Resets to sale price
- Current annual tax
- $980 · $82/mo
- Projected year-2 tax
- $980 · $82/mo
- Expected delta
- $0/yr ($0/mo · 0.0%)
ⓘ Screening estimate from a state-policy table — verify with the county assessor before closing.
Climate risk First Street
- Flood 1/10 Low FEMA zone X · 0% chance over 30 yrs
- Wildfire 3/10 Moderate
- Heat 7/10 Severe 7 d/yr ≥109°F today · 20 d/yr by 30 yrs out
- Wind 8/10 Severe 80% chance of damaging wind over 30 yrs
- Air quality 1/10 Low 0 unhealthy d/yr today · 0 by 30 yrs out
Nearby sold comps map
Loading sold comps map…
Walkable amenities ~0.75 mi
Loading nearby amenities…
Taxation est. · year 1
- Rental income
- $25,435
- − Mortgage interest
- −$9,803
- − Property taxes
- −$980
- − Insurance
- −$875
- − Repairs & maintenance
- −$2,035
- − Management
- −$2,035
- − Depreciation
- −$5,091
- Taxable income
- $4,617
- Est. tax owed @ 24.0%
- −$1,108
- After-tax cash flow
- $6,118/yr
For passive investors: Depreciation is non-cash, so a rental often shows a tax loss while cash-flowing — sheltering income. Rental losses are passive: they offset passive income freely, and up to $25,000/yr can offset ordinary (W-2) income if you actively participate and your MAGI is under $100k (phasing out to $0 by $150k); unused losses carry forward. On sale, claimed depreciation is recaptured at up to 25%, and gains may owe capital-gains tax (a 1031 exchange can defer both). Figures are a year-1 estimate at your 24.0% rate — not tax advice; consult a CPA.
Schools (NCES district)
- District
- Richland Parish
- NCES district ID
- 2201350
- Math proficiency
- 12% ▼ -36.00%
- Reading proficiency
- 22% ▼ -31.00%
- Median HH income
- $36,097
- Composite
- 14.06/100
- National rank
- #9464
- State rank
- #73 of 98 in LA
Livability — Rayville
- Score
- 65/100
- State rank
- #158
- US rank
- #13606
Category grades
Schools grade is shown separately in the Schools card above.
Census & demographics
- Population (ZIP)
- 12,475
Population outlook (Richland County) Hauer SSP2
- Today (2025)
- 20,283 people
- By 2030
- 19,990 · -1.4%
- By 2040
- 19,240 · -5.1%
- By 2050
- 18,497 · -8.8%
- By 2075
- 16,626 · -18.0%
- By 2100
- 14,204 · -30.0%
Race, ethnicity, and origin ACS 2023
- Neighborhood character
- Majority White (60%)
- Race & ethnicity
- White 60% Black 36% Two or more races 3% Hispanic / Latino 2%
- Common ancestry
- Slovak 3% Lithuanian 2% Romanian 1%
- Foreign-born
- 0% · Canada
- Languages at home
- 98% English-only · Spanish 1%
Political lean MEDSL · Richland
- 2024 margin
- Solid R (+39.4) · D 29.7% · R 69.1% · Other 1.2%
- 2008→2024 swing
- -12.8pp toward R · 2008: -26.6pp · 2024: -39.4pp
- All cycles
- 2024: R+39.4 2020: R+34.0 2016: R+32.6 2012: R+28.2 2008: R+26.6
Not yet ingested
- Civics
- —
Market trends
- HPI YoY
- ▼ -56.82%
- Current HPI
- 158.2193
- Rent YoY
- —
- Metro
- —
- State GDP YoY
- ▲ 3.29%
- F500 in state
- 10
Industry mix (Fortune 500 HQ in LA)
| Industry | F500 HQs | Revenue |
|---|---|---|
| Telecommunications | 2 | $23B |
|
||
| Utilities | 1 | $12B |
|
||
| Wholesale / Distribution | 1 | $5B |
|
||
| Advertising | 1 | $2B |
|
||
Price history
3 events — show timeline
- 2026-04-09 Pending — NELABOR
- 2026-04-02 Listed $175,000 NELABOR
- 2008-01-10 Sold (Public Records) — Public Records
Property tax history
+8.5%/yrLatest (2025): $980 · +0.1% YoY. Source: county tax records.
Cash-flow waterfall
monthlySold comps — $/sqft
last 12 mo · ≤1 miLoading sold comps…