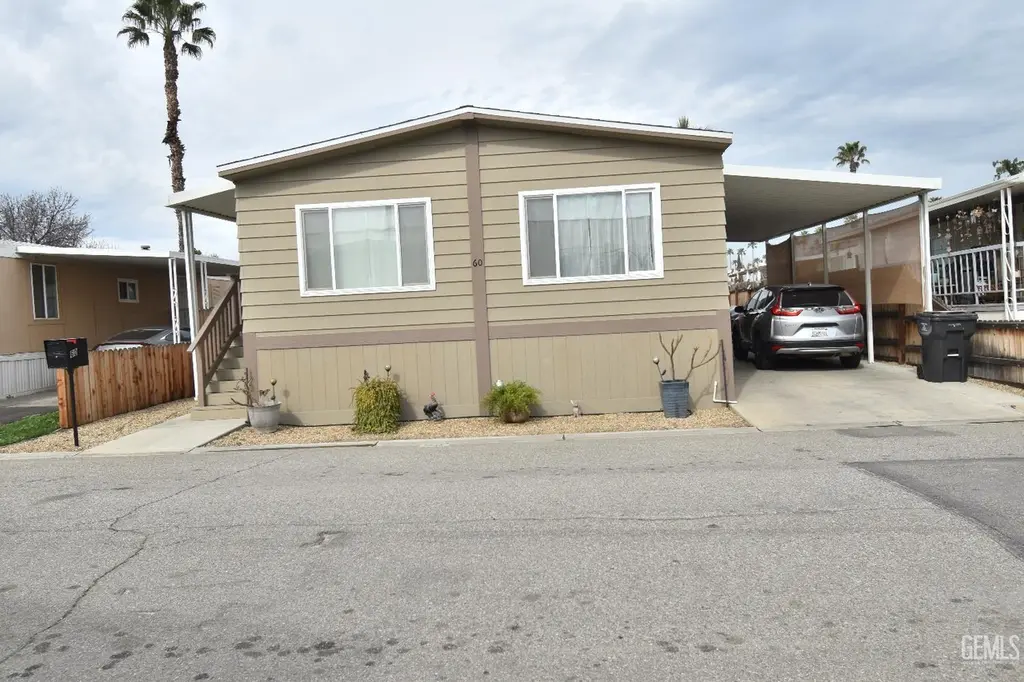
60 Cinnamon Ln · Oildale, CA
Flood risk 1/10 · Minimal
- FEMA flood zone
- X (unshaded)
- Chance of flooding over 30 yrs
- 0.0%
- Est. flood insurance / yr
- $507 – $1,088
Fire risk 2/10 · Minimal
- Est. fire insurance / yr
- $659 – $1,223
Heat risk 8/10 · Major
- Hot days now (above 105°F)
- 6 days/yr
- Hot days in 30 yrs
- 16 days/yr
Wind risk 1/10 · Minimal
- Chance of severe wind over 30 yrs
- —
Air-quality risk 10/10 · Severe
- Unhealthy air days now
- 39 days/yr
- Unhealthy air days in 30 yrs
- 45 days/yr
Risk factors via First Street. Map © Google.
Why this score? — see what drove the C+ grade
The composite is a weighted blend of 9 inputs, each scored 0–100. Each bar is that input's sub-score; the figure is the points it added to the 100-point composite (weight × sub-score).
- Cash flow +30.0/30.0
- DSCR +10.0/10.0
- 1% rule +9.4/10.0
- ARV discount +3.2/15.0
- Rent growth +3.1/5.0
- Livability +2.9/5.0
- Appreciation +2.7/10.0
- Condition / age +2.5/5.0
- Schools +1.0/10.0
$115,000
🖨 Deal sheet 📄 Offer letter ✓ Due diligence
Listing remarks MLS
Riverdale Village restored 2024 manufacture home looks like new. Moving ready. Completely remodeled 2024. It offers 1440sf, 3 bed 2 bath, open parking. This manufacture home is ready for quick sale. Enjoy Newer roof, newer dual pane windows, newer doors, newer central a/c, newer laminate flooring, newer fixtures, beautifully remodeled master bathroom, newer paint inside and out and much more. Park amenities include Sparkling Pool, billiards & game center, clubhouse kitchen, clubhouse rec room, dog pickup station & more. Buyer and buyer's agent to verify all information given.
Key facts
- 4,500 sq ft lot
- Community pool
- Built 1977
Neighborhood map
What this means for you Summary
Snapshot
- This is a 3-bed/2.0-bath manufactured listed at $115k.
Deal economics
- At list price, monthly cash flow is $572 ($7k/yr) — positive.
- The deal already cash-flows at list — no discount required.
- Meets the 1% rule at list price ($2k rent vs $115k).
- Recommended offer: $101k (12.0% below list) — sets the bar for market timing.
- Cap rate 12.3% vs local median 3.9% in Oildale — top-decile yield for the area; either an underpriced asset or a hidden risk that comps aren't pricing in. Stress-test before assuming the spread holds.
Location & tenants
- Location reads 58/100 on livability (#680 in CA) — a working-class tenant base; expect higher turnover. Strengths: housing A+, schools B+; Watch: crime F, amenities F, commute F.
- Beardsley Elementary (suburban): math 7% / reading 18% proficiency, ranked #501 of 517 in CA (top 97%) — low school quality limits family demand, transient renter base, plan for 1-2y turnover; 76% free/reduced lunch — lower-income household profile, screen leases tightly.
- Market conditions: Rents rising (+2.2%/yr); 307 active listings in the ZIP; 19 comparable units currently listed for rent nearby; rentals leasing fast (median 3d on market — plan ~1-2 weeks tenant-placement turnaround); 3,244 units permitted in Kern County in 2024 (73 in 5+ unit buildings).
- This rent runs 32% of the median local income ($62k/yr) — at the standard rent-burdened threshold; future hikes will face affordability resistance.
Forward outlook
- Local home prices are declining (-3.0%/yr); year-one equity from $795 of loan paydown is wiped out by about $3k of value loss. Plan a longer hold.
- Kern County population projected at +17% by 2050 — long-run rental-demand tailwind backs the buy-and-hold thesis.
- At projected returns (-3.0% appreciation + 2.2% rent growth), your $32k cash investment doubles in ~6 years — after that, you're playing with house money.
Negotiation context
- It's been on market 128 days — a 12% lower offer ($101k) is reasonable based on typical stale-listing flexibility.
- 3 sale attempts since 3y ago; this cycle's ask has dropped $15k (11%) from the opening price — seller is motivated, your offer sets the floor, not the list.
- Current owner paid $100k; 16% above their basis — modest negotiation headroom, anchor on the comps not their cost.
Risks & watch-outs
- Climate carrying-cost: extreme-heat days projected 6→16/yr by 2055 (HVAC capex compounding) — expect insurance premiums to compound above CPI over the hold.
Questions for the listing agent
- It's been on market 128 days. Have you received any prior offers? Is the seller open to a 12% concession, seller financing, or rate buy-down credit?
- Built in 1977 — when were the roof, HVAC, electrical panel, plumbing, and water heater last replaced?
- Why hasn't it sold? Are there any deal-killer items the seller is aware of (foundation, flood, title, zoning, code violations)?
- Is there a deadline driving the sale (1031 exchange, divorce, estate, relocation)? That informs how much negotiation room exists.
- Schools are B-rated — typically a magnet for longer-tenancy family renters. What's the average tenant stay here, and is there a school-zone premium baked into asking?
- Crime grade is F in this area — have there been break-ins, vandalism, or insurance claims at this property in the last 3 years? What carrier currently insures it and at what premium?
- What's the average days-on-market for RENTAL listings here right now (not sales)? A rising rental-DOM trend means longer vacancies and softer asking-rent achievability than the comps imply.
- What's the recent tenant-quality profile in this submarket — average credit score on applications, eviction rate, late-payment / NSF rate, and stable-employment percentage? A property-management company in the area should have these aggregated.
- How much new for-sale + rental construction is in the pipeline within 1–3 miles? Heavy new supply typically softens prices + rents 12–24 months out; constrained supply supports both.
Investment metrics
- 1% rule
- 1.44% ✓
- Cap rate
- 12.26%
- Cash-on-cash
- 21.31%
- DSCR
- 1.95
- GRM
- 5.8
CMA / ARV
- ARV (median comp)
- $104,918
- List price
- $115,000
- Delta
- 9.61%
- Verdict
- FAIR
- Comps
- 10 within 1.0 mi
Show comp detail 12 sales within ~0.75 mi
| Address | Dist | Beds/Ba | Sqft | Sold | Price | $/sf | Match |
|---|---|---|---|---|---|---|---|
| 115 Cedarwood Ln | 0.07mi | 3/2.0 | 1,440 (0%) | 8mo | $115,000 | $80 | 90 |
| 225 Vivian Ln | 0.10mi | 3/2.0 | 1,440 (0%) | 9mo | $81,000 | $56 | 88 |
| 210 Dogwood Ln | 0.14mi | 4/2.0 (+1) | 1,440 (0%) | 8mo | $112,500 | $78 | 82 |
| 156 Hickorywood Ln | 0.22mi | 3/2.0 | 1,440 (0%) | 10mo | $115,000 | $80 | 81 |
| 48 Cedarwood Ln | 0.03mi | 3/2.0 | 1,248 (-13%) | 1mo | $70,000 | $56 | 76 |
| 137 Fernwood Ln | 0.16mi | 3/2.0 | 1,524 (+6%) | 10mo | $120,000 | $79 | 75 |
| 159 Hickorywood Ln | 0.21mi | 4/2.0 (+1) | 1,344 (-7%) | 3mo | $99,000 | $74 | 72 |
| 316 Nita | 0.18mi | 4/2.0 (+1) | 1,344 (-7%) | 7mo | $82,500 | $61 | 69 |
| 256 Mary Kay Ln | 0.17mi | 3/2.0 | 1,248 (-13%) | 3mo | $130,000 | $104 | 68 |
| 153 Hickorywood Ln | 0.23mi | 2/2.0 (-1) | 1,375 (-4%) | 15mo | $38,000 | $28 | 64 |
| 131 Fernwood Ln | 0.18mi | 3/2.0 | 1,248 (-13%) | 15mo | $120,000 | $96 | 57 |
| 170 Hickorywood Ln | 0.27mi | 2/2.0 (-1) | 1,320 (-8%) | 19mo | $95,000 | $72 | 53 |
Match score weights: distance 35% · size 25% · config 20% · recency 20%. Top-matched comps best support the ARV.
Projected returns pro-forma
-3.0% appreciation · 2.22% rent growth · sell at horizon
- IRR
- 13.0%
- Equity multiple
- 1.51×
- Total profit
- $16,484
- Equity at exit
- $17,147
- IRR
- 21.2%
- Equity multiple
- 2.74×
- Total profit
- $55,993
- Equity at exit
- $9,943
Cash invested: $32,200 (down + closing). Projections, not guarantees.
Landlord ↔ Tenant lean methodology
- Overall (STATE)
- 18 Strongly Tenant-Friendly
- State California
- 18 Strongly Tenant-Friendly · D+13
- County
- — inherits STATE
- City
- — inherits STATE
ZIP-level market 93308
- Home prices YoY
- -0.5%
- Rents YoY
- 2.2%
- Active inventory
- 307
- Price-to-rent
- 5.8×
Monthly cashflow live
- Estimated rent
- $1,660 high interval (Pro) →
- Mortgage (P&I)
- −$603
- Tax from tax record
- −$89 /mo · $1,067/yr
- Insurance
- −$48
- HOA
- −$0
- Vacancy / Maint / Mgmt
- −$349
- Net cashflow
- $572
Break-even live
UW: 25.0% down · 7.5% · 30yr · 1.5% tax · 5.0% vac · 8.0% maint · 8.0% mgmt
Financing live
Cash to close
- Down payment
- $28,750
- Closing costs
- $3,450
- Reserves months
- —
- Total cash needed
- —
Loan-product check · same deal, 3 products live
Conventional
25% down · 7.5% · 30yr
- Down + closing
- —
- Monthly P&I
- —
- Monthly cashflow
- —
- DSCR
- —
- Eligible?
- —
Personal DTI + credit; lowest rate.
DSCR
20% down · 8.5% · 30yr
- Down + closing
- —
- Monthly P&I
- —
- Monthly cashflow
- —
- DSCR
- —
- Eligible?
- —
No personal income docs; deal must DSCR.
Hard money
10% down · 12.0% · 12mo
- Down + closing
- —
- Monthly P&I
- —
- Monthly cashflow
- —
- DSCR
- —
- Eligible?
- —
Short-term bridge; refi at stabilization.
Rent comps 19 comps
| Address | Beds | Baths | Sqft | Rent | $/sqft | DOM | Units | Dist |
|---|---|---|---|---|---|---|---|---|
| 627 Beardsley Ave Bakersfield, CA | 3.0 | 1.0 | 967 | $1,575 | $1.63 | 43d | 1 | 0.24mi |
| 627 Hood Dr Bakersfield, CA | 3.0 | 1.0 | 1140 | $1,795 | $1.57 | 2d | 1 | 0.29mi |
| 213 Oildale Dr Unit A Bakersfield, CA | 2.0 | 2.0 | 928 | $1,195 | $1.29 | 2d | 1 | 0.48mi |
| 448 S Oildale Dr Bakersfield, CA | 3.0 | 2.0 | 1080 | $1,500 | $1.39 | 2d | 1 | 0.51mi |
| 327 McCord Ave Unit 6 Bakersfield, CA | 3.0 | 1.0 | 1000 | $1,500 | $1.50 | 2d | 1 | 0.59mi |
| 930 Olive Dr Bakersfield, CA | 4.0 | 2.5 | 1544 | $2,250 | $1.46 | 21d | 1 | 0.60mi |
| 223 McCord Ave Bakersfield, CA | 3.0 | 2.0 | 1536 | $1,795 | $1.17 | 2d | 1 | 0.74mi |
| 222 Moneta Ave Unit 222 Bakersfield, CA | 3.0 | 2.0 | 1040 | $1,700 | $1.63 | 2d | 1 | 0.79mi |
| 222 Harding Ave Unit B Bakersfield, CA | 3.0 | 2.0 | 1100 | $1,750 | $1.59 | 2d | 1 | 0.85mi |
| 419 Washington Ave Unit 417 Bakersfield, CA | 3.0 | 2.0 | 975 | $1,500 | $1.54 | 2d | 1 | 0.87mi |
| 901 Castaic Ave Bakersfield, CA | 2.0 | 1.0 | 1076 | $1,700 | $1.58 | 2d | 1 | 0.95mi |
| 3333 El Encanto Ct Bakersfield, CA | 2.0 | 2.0 | 990 | $1,595 | $1.61 | 14d | 1 | 0.95mi |
| 3333 El Encanto Ct Bakersfield, CA | 2.0 | 1.5 | 990 | $1,495 | $1.51 | 2d | 1 | 0.95mi |
| 1207 El Tejon Ave Unit 1 Bakersfield, CA | 3.0 | 1.0 | 1212 | $1,950 | $1.61 | 2d | 1 | 1.00mi |
| 1951 Golden State Ave Bakersfield, CA | 1.0–3.0 | 1.0–2.5 | 1017 | $1,695 | $1.67 | 2d | 2 | 1.08mi |
| 106 E Warren Ave Bakersfield, CA | 3.0 | 2.0 | 1169 | $1,400 | $1.20 | 10d | 1 | 1.13mi |
| 709 Francis St Bakersfield, CA | 3.0 | 1.0 | 1300 | $1,400 | $1.08 | 43d | 1 | 1.14mi |
| 1201 40th St Bakersfield, CA | 2.0–3.0 | 1.0–2.0 | 870 | $1,219 | $1.40 | 2d | 1 | 1.40mi |
| 411 Highland Dr Bakersfield, CA | 2.0 | 1.0 | 1051 | $1,650 | $1.57 | 2d | 1 | 1.48mi |
Listing history 20 events
-
2026-06-18days on market $115,000 Active 128 DOM
-
2026-06-17days on market $115,000 Active 127 DOM
-
2026-06-16days on market $115,000 Active 126 DOM
-
2026-06-15days on market $115,000 Active 125 DOM
-
2026-06-14days on market $115,000 Active 123 DOM
-
2026-06-10days on market $115,000 Active 120 DOM
-
2026-06-09days on market $115,000 Active 119 DOM
-
2026-06-08days on market $115,000 Active 118 DOM
-
2026-06-07days on market $115,000 Active 117 DOM
-
2026-06-05days on market $115,000 Active 114 DOM
-
2026-06-03days on market $115,000 Active 113 DOM
-
2026-06-03days on market $115,000 Active 112 DOM
-
2026-06-01days on market $115,000 Active 111 DOM
-
2026-05-31days on market $115,000 Active 110 DOM
-
2026-02-10$129,900 Active 594-char remark
Show marketing remark (594 chars)
Riverdale Village restored 2024 manufacture home looks like new. Moving ready. Completely remodeled 2024. It offers 1440sf, 3 bed 2 bath, open parking. This manufacture home is ready for quick sale. Enjoy Newer roof, newer dual pane windows, newer doors, newer central a/c, newer laminate flooring, newer fixtures, beautifully remodeled master bathroom, newer paint inside and out and much more. Park amenities include Sparkling Pool, billiards & game center, clubhouse kitchen, clubhouse rec room, dog pickup station & more. Buyer and buyer's agent to verify all information given.
-
2024-02-22soldstatus $99,500 Sold 439-char remark
Show marketing remark (439 chars)
Riverdale Village restored manufacture home to look like new. Completely remodeled 1440sf 3 bed 2 bath manufacture home ready for quick sale. Enjoy New roof, new dual pane windows, new doors, new central a/c, new carpet and laminate flooring, new fixtures, new paint inside and out and much more. Park amenities include: Sparkling Pool, billiards & game center, clubhouse kitchen, clubhouse rec room, dog pickup station & more.
-
2024-01-31status Pending 439-char remark
Show marketing remark (439 chars)
Riverdale Village restored manufacture home to look like new. Completely remodeled 1440sf 3 bed 2 bath manufacture home ready for quick sale. Enjoy New roof, new dual pane windows, new doors, new central a/c, new carpet and laminate flooring, new fixtures, new paint inside and out and much more. Park amenities include: Sparkling Pool, billiards & game center, clubhouse kitchen, clubhouse rec room, dog pickup station & more.
-
2024-01-31status Active 439-char remark
Show marketing remark (439 chars)
Riverdale Village restored manufacture home to look like new. Completely remodeled 1440sf 3 bed 2 bath manufacture home ready for quick sale. Enjoy New roof, new dual pane windows, new doors, new central a/c, new carpet and laminate flooring, new fixtures, new paint inside and out and much more. Park amenities include: Sparkling Pool, billiards & game center, clubhouse kitchen, clubhouse rec room, dog pickup station & more.
-
2023-10-17status Pending 439-char remark
Show marketing remark (439 chars)
Riverdale Village restored manufacture home to look like new. Completely remodeled 1440sf 3 bed 2 bath manufacture home ready for quick sale. Enjoy New roof, new dual pane windows, new doors, new central a/c, new carpet and laminate flooring, new fixtures, new paint inside and out and much more. Park amenities include: Sparkling Pool, billiards & game center, clubhouse kitchen, clubhouse rec room, dog pickup station & more.
-
2023-08-01$99,500 Active 439-char remark
Show marketing remark (439 chars)
Riverdale Village restored manufacture home to look like new. Completely remodeled 1440sf 3 bed 2 bath manufacture home ready for quick sale. Enjoy New roof, new dual pane windows, new doors, new central a/c, new carpet and laminate flooring, new fixtures, new paint inside and out and much more. Park amenities include: Sparkling Pool, billiards & game center, clubhouse kitchen, clubhouse rec room, dog pickup station & more.
ⓘ Source: listings_history table (triggers on properties + properties_extension) + one-shot
backfill from property_details.listing_events for pre-trigger history.
Tax reassessment forecast CA · Resets to sale price
- Current annual tax
- $1,067 · $89/mo
- Projected year-2 tax
- $1,067 · $89/mo
- Expected delta
- $0/yr ($0/mo · 0.0%)
ⓘ Screening estimate from a state-policy table — verify with the county assessor before closing.
Climate risk First Street
- Flood 1/10 Low FEMA zone X (unshaded) · 0% chance over 30 yrs
- Wildfire 2/10 Low
- Heat 8/10 Severe 6 d/yr ≥105°F today · 16 d/yr by 30 yrs out
- Wind 1/10 Low
- Air quality 10/10 Extreme 39 unhealthy d/yr today · 45 by 30 yrs out
Nearby sold comps map
Loading sold comps map…
Walkable amenities ~0.75 mi
Loading nearby amenities…
Taxation est. · year 1
- Rental income
- $19,926
- − Mortgage interest
- −$6,442
- − Property taxes
- −$1,067
- − Insurance
- −$575
- − Repairs & maintenance
- −$1,594
- − Management
- −$1,594
- − Depreciation
- −$3,345
- Taxable income
- $5,308
- Est. tax owed @ 24.0%
- −$1,274
- After-tax cash flow
- $5,588/yr
For passive investors: Depreciation is non-cash, so a rental often shows a tax loss while cash-flowing — sheltering income. Rental losses are passive: they offset passive income freely, and up to $25,000/yr can offset ordinary (W-2) income if you actively participate and your MAGI is under $100k (phasing out to $0 by $150k); unused losses carry forward. On sale, claimed depreciation is recaptured at up to 25%, and gains may owe capital-gains tax (a 1031 exchange can defer both). Figures are a year-1 estimate at your 24.0% rate — not tax advice; consult a CPA.
Schools (NCES district)
- District
- Beardsley Elementary
- NCES district ID
- 0604260
- Math proficiency
- 7% ▼ -12.00%
- Reading proficiency
- 18% ▼ -16.00%
- Median HH income
- $28,808
- Composite
- 9.63/100
- National rank
- #9841
- State rank
- #501 of 517 in CA
Livability — Oildale
- Score
- 58/100
- State rank
- #680
- US rank
- #20848
Category grades
Schools grade is shown separately in the Schools card above.
Census & demographics
- Census place
- Oildale, CA
- County
- Kern County · 710,371 people
- Metro
- Bakersfield, CA
- Population (ZIP)
- 55,078
- Household income
- $62,445
- Rent vs Own
- Severe rent burden
- 2931.0
Population outlook (Kern County) Hauer SSP2
- Today (2025)
- 947,286 people
- By 2030
- 978,984 · +3.3%
- By 2040
- 1,045,018 · +10.3%
- By 2050
- 1,105,232 · +16.7%
- By 2075
- 1,229,538 · +29.8%
- By 2100
- 1,238,059 · +30.7%
Race, ethnicity, and origin ACS 2023
- Neighborhood character
- Diverse neighborhood (Simpson 0.57)
- Race & ethnicity
- White 57% Hispanic / Latino 32% Two or more races 15% Black 3% Asian 3% Native American 1%
- Hispanic origin (detail)
- Mexican 26%
- Common ancestry
- Slovak 3% Italian 1% Romanian 1%
- Foreign-born
- 8% · Canada, Vietnam
- Languages at home
- 80% English-only · Spanish 17%
Political lean MEDSL · Kern
- 2024 margin
- Strong R (+21.1) · D 38.2% · R 59.3% · Other 2.5%
- 2008→2024 swing
- -3.3pp toward R · 2008: -17.8pp · 2024: -21.1pp
- All cycles
- 2024: R+21.1 2020: R+10.2 2016: R+15.0 2012: R+20.9 2008: R+17.8
Not yet ingested
- Civics
- —
Market trends
- HPI YoY
- ▼ -4.52%
- Current HPI
- 825.65
- Rent YoY
- ▲ 2.22%
- Metro
- Bakersfield, CA
- State GDP YoY
- ▲ 3.21%
- F500 in state
- 116
Industry mix (Fortune 500 HQ in CA)
| Industry | F500 HQs | Revenue |
|---|---|---|
| Technology | 27 | $1,492B |
|
||
| Financial Services | 3 | $174B |
|
||
| Retail | 3 | $44B |
|
||
| Insurance | 3 | $26B |
|
||
| Media / Entertainment | 2 | $115B |
|
||
| Pharmaceuticals / Biotech | 2 | $62B |
|
||
Price history
+30.6% since first listed6 events — show timeline
- 2026-02-10 Listed $129,900 GEMLS
- 2024-02-22 Sold (MLS) $99,500 GEMLS
- 2024-01-31 Pending — GEMLS
- 2024-01-31 Relisted — GEMLS
- 2023-10-17 Pending — GEMLS
- 2023-08-01 Listed $99,500 GEMLS
Property tax history
+90.1%/yrLatest (2025): $1,067 · +261.6% YoY. Source: county tax records.
Cash-flow waterfall
monthlySold comps — $/sqft
last 12 mo · ≤1 miLoading sold comps…