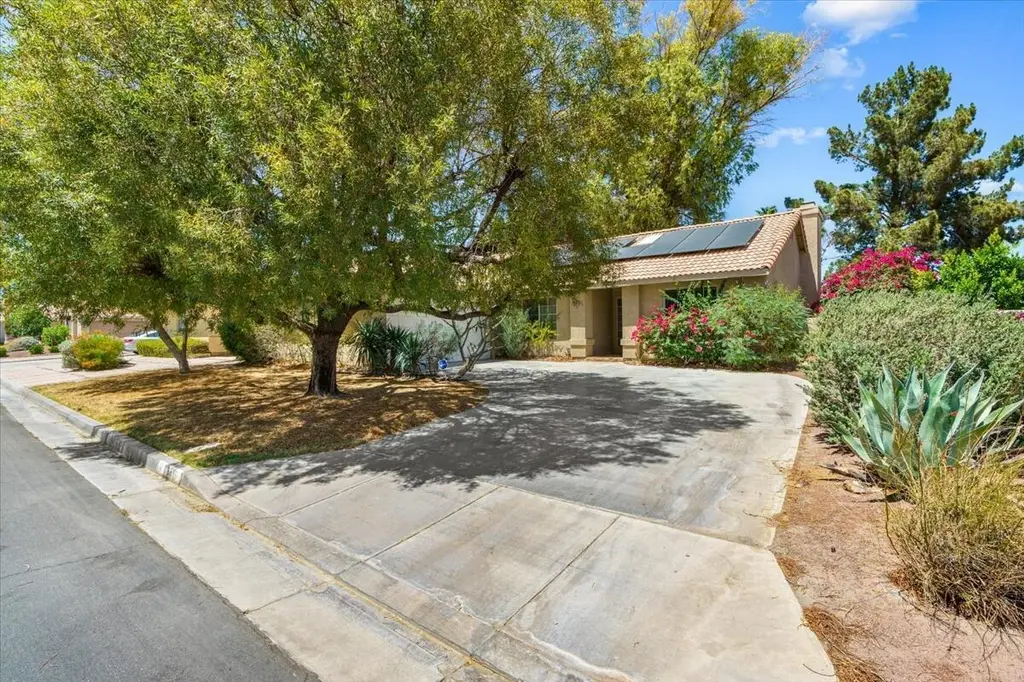
73816 White Sands Dr · Thousand Palms, CA
Flood risk 1/10 · Minimal
- FEMA flood zone
- AO
- Chance of flooding over 30 yrs
- 0.0%
- Est. flood insurance / yr
- $848 – $2,087
Fire risk 4/10 · Minor
- Est. fire insurance / yr
- $659 – $1,223
Heat risk 9/10 · Severe
- Hot days now (above 114°F)
- 7 days/yr
- Hot days in 30 yrs
- 19 days/yr
Wind risk 1/10 · Minimal
- Chance of severe wind over 30 yrs
- —
Air-quality risk 4/10 · Minor
- Unhealthy air days now
- 5 days/yr
- Unhealthy air days in 30 yrs
- 7 days/yr
Risk factors via First Street. Map © Google.
Why this score? — see what drove the C grade
The composite is a weighted blend of 9 inputs, each scored 0–100. Each bar is that input's sub-score; the figure is the points it added to the 100-point composite (weight × sub-score).
- Cash flow +21.2/30.0
- ARV discount +15.0/15.0
- DSCR +6.7/10.0
- 1% rule +6.3/10.0
- Schools +2.7/10.0
- Livability +2.7/5.0
- Rent growth +2.5/5.0
- Condition / age +2.5/5.0
- Appreciation +0.0/10.0
$312,000
🖨 Deal sheet (PDF) 📄 Offer letter ✓ Due diligence
Listing remarks
Discover a charming, HUD- Owned getaway in 55+ Tri-Palms Estates, Thousand Palms. This cozy 1,766 sqft home is CONVENTIONAL BUILT (Not a manufactured home) and offers a comfortable and relaxed lifestyle with 4 bedrooms and 2 baths that accommodate family and friends with ease. The welcoming living room features a fireplace, adding warmth and character to the space. Enjoy stunning views of the nearby golf course and the surrounding mountains, providing a serene backdrop for your everyday living. Situated right on the fairway, this home offers the perfect mix of peace and a touch of activity. Ideal for those who appreciate the balance of simplicity and natural beauty, this home provides the c
Key facts
- Golf course views
- Fireplace
- 5,663 sq ft lot
Tags
Property features AI
Finance
- Other: Property sold as Real Estate Owned; Listing accepts Conventional, FHA, and Cash financing; CC&R and Planned Development disclosures; property sold as-is
- HOA & community: HOA with monthly fee (about $284); Association amenities: Clubhouse, greenbelt/park, golf course; Senior community; Development has golf course
Exterior
- Parking: Attached 2-car garage; Direct entrance; 2 total parking spaces
- Security: Other security/safety features
- Utilities: PUD: Yes; Sewer: Unknown
- Home design: Detached single-family home; One story
- Construction: Year built (per assessor)
- Exterior features: Private portable above-ground spa/hot tub; Has view of golf course and mountains; Fee simple land
Interior
- Flooring: Carpet; Tile
- Bathrooms: 2 full bathrooms
- Heating & cooling: Central heating; Central air conditioning
- Interior features: Unfurnished; Decorative fireplace in the great room
Neighborhood map
What this means for you Summary
Snapshot
- This is a 4-bed/2.0-bath single-family listed at $312k.
Deal economics
- At list price, monthly cash flow is $327 ($4k/yr) — positive.
- The deal already cash-flows at list — no discount required.
- Meets the 1% rule at list price ($4k rent vs $312k).
- Cap rate 8.0% vs local median 5.2% in Thousand Palms — top-decile yield for the area; either an underpriced asset or a hidden risk that comps aren't pricing in. Stress-test before assuming the spread holds.
Location & tenants
- Location reads 53/100 on livability (#950 in CA) — a working-class tenant base; expect higher turnover. Strengths: housing A+; Watch: cost of living D, schools F, crime F.
- Palm Springs Unified (suburban): math 21% / reading 42% proficiency, ranked #328 of 517 in CA (top 63%) — families likely to look elsewhere, expect single-tenant / working-renter base with shorter leases; 73% free/reduced lunch — lower-income household profile, screen leases tightly.
- Market conditions: 101 active listings in the ZIP; 22 comparable units currently listed for rent nearby; rentals lingering (median 45d on market — plan ~5-8 weeks vacancy on turnover, expect pricing pressure); 50% of comp listings sitting > 30 days — soft ceiling on asking rent; 9,195 units permitted in Riverside County in 2024 (1,512 in 5+ unit buildings).
Forward outlook
- Local home prices are declining (-3.0%/yr); year-one equity from $2k of loan paydown is wiped out by about $9k of value loss. Plan a longer hold.
- Riverside County population projected at +22% by 2050 — long-run rental-demand tailwind backs the buy-and-hold thesis.
Negotiation context
- Only 10 days on market — expect competitive offers; lowballing is unlikely to land.
- 2 sale attempts with the ask held roughly flat each time — persistent listings suggest the price (not the market) is what's stuck; bring a comps-based counter.
- Current owner paid $150k; list at $312k implies a 107% gain — meaningful room to come down on a strong offer.
Risks & watch-outs
- Watch-outs: flood insurance adds $122/mo.
- Climate carrying-cost: in FEMA flood zone AO (mandatory federal flood insurance); extreme-heat days projected 7→19/yr by 2055 (HVAC capex compounding) — expect insurance premiums to compound above CPI over the hold.
Questions for the listing agent
- What's the actual annual flood-insurance premium (NFIP or private), and is the property in a SFHA with mandatory coverage?
- What does the HOA fee cover, when was the last increase, and are there any pending special assessments or reserve-fund shortfalls?
- Is there a deadline driving the sale (1031 exchange, divorce, estate, relocation)? That informs how much negotiation room exists.
- Schools are F-rated, which usually means shorter tenancies and higher turnover. Who's the typical renter profile here, and what's been the actual vacancy rate?
- Crime grade is F in this area — have there been break-ins, vandalism, or insurance claims at this property in the last 3 years? What carrier currently insures it and at what premium?
- What's the average days-on-market for RENTAL listings here right now (not sales)? A rising rental-DOM trend means longer vacancies and softer asking-rent achievability than the comps imply.
- What's the recent tenant-quality profile in this submarket — average credit score on applications, eviction rate, late-payment / NSF rate, and stable-employment percentage? A property-management company in the area should have these aggregated.
- How much new for-sale + rental construction is in the pipeline within 1–3 miles? Heavy new supply typically softens prices + rents 12–24 months out; constrained supply supports both.
Investment metrics
- 1% rule
- 1.13% ✓
- Cap rate
- 8.02%
- Cash-on-cash
- 6.17%
- DSCR
- 1.27
- GRM
- 7.3
CMA / ARV
- ARV (on-the-fly)
- $547,460
- Comps found
- 11
Show comp detail 11 sales within ~0.75 mi
| Address | Dist | Beds/Ba | Sqft | Sold | Price | $/sf | Match |
|---|---|---|---|---|---|---|---|
| 73811 Boca Chica Trl | 0.08mi | 3/2.0 (-1) | 1,622 (-8%) | 13mo | $394,000 | $243 | 67 |
| 73951 White Sands Dr | 0.15mi | 3/2.0 (-1) | 1,570 (-11%) | 9mo | $359,000 | $229 | 62 |
| 73578 Raphael Dr | 0.70mi | 3/2.0 (-1) | 1,750 (-1%) | 2mo | $571,118 | $326 | 60 |
| 33934 Palm Lake Cir | 0.06mi | 3/2.0 (-1) | 1,507 (-15%) | 12mo | $353,000 | $234 | 58 |
| 73606 Raphael Dr | 0.70mi | 3/2.0 (-1) | 1,750 (-1%) | 6mo | $615,878 | $352 | 56 |
| 73718 Raphael Dr | 0.71mi | 3/2.0 (-1) | 1,750 (-1%) | 9mo | $633,628 | $362 | 53 |
| 33859 Palm Lake Cir | 0.05mi | 3/2.0 (-1) | 1,507 (-15%) | 20mo | $370,000 | $246 | 52 |
| 73620 Raphael Dr | 0.69mi | 3/2.5 (-1) | 1,942 (+10%) | 1mo | $593,958 | $306 | 44 |
| 73693 Raphael Dr | 0.74mi | 3/2.0 (-1) | 1,757 (-0%) | 19mo | $597,770 | $340 | 43 |
| 73595 Raphael Dr | 0.72mi | 3/2.5 (-1) | 1,942 (+10%) | 1mo | $601,741 | $310 | 42 |
| 73690 Raphael Dr | 0.69mi | 3/2.5 (-1) | 1,942 (+10%) | 6mo | $686,303 | $353 | 39 |
Match score weights: distance 35% · size 25% · config 20% · recency 20%. Top-matched comps best support the ARV.
Projected returns pro-forma
-3.0% appreciation · 3.0% rent growth · sell at horizon
- IRR
- -9.2%
- Equity multiple
- 0.66×
- Total profit
- $-29,487
- Equity at exit
- $46,520
- IRR
- 0.3%
- Equity multiple
- 1.02×
- Total profit
- $2,139
- Equity at exit
- $26,976
Cash invested: $87,360 (down + closing). Projections, not guarantees.
Landlord ↔ Tenant lean methodology
- Overall (STATE)
- 18 Strongly Tenant-Friendly
- State California
- 18 Strongly Tenant-Friendly · D+13
- County
- — inherits STATE
- City
- — inherits STATE
ZIP-level market 92276
- Home prices YoY
- -10.9%
- Active inventory
- 101
- Price-to-rent
- 7.3×
Monthly cashflow live
- Estimated rent
- $3,541 high interval (Pro) →
- Mortgage (P&I)
- −$1,636
- Tax from tax record
- −$298 /mo · $3,574/yr
- Insurance
- −$130
- Flood insurance flood zone
- −$122 /mo · $1,468/yr
- HOA
- −$284
- Vacancy / Maint / Mgmt
- −$744
- Net cashflow
- $327
Break-even live
Sensitivity live
| Price | -10% $504 | -5% $415 | +0% $327 | +5% $239 | +10% $150 |
|---|---|---|---|---|---|
| Rent | -10% $47 | -5% $187 | +0% $327 | +5% $467 | +10% $607 |
| Rate | -1.0pp $484 | -0.5pp $406 | base $327 | +0.5pp $246 | +1.0pp $164 |
UW: 25.0% down · 7.5% · 30yr · 1.5% tax · 5.0% vac · 8.0% maint · 8.0% mgmt
Financing live
Cash to close
- Down payment
- $78,000
- Closing costs
- $9,360
- Reserves months
- —
- Total cash needed
- —
Loan-product check · same deal, 3 products live
Conventional
25% down · 7.5% · 30yr
- Down + closing
- —
- Monthly P&I
- —
- Monthly cashflow
- —
- DSCR
- —
- Eligible?
- —
Personal DTI + credit; lowest rate.
DSCR
20% down · 8.5% · 30yr
- Down + closing
- —
- Monthly P&I
- —
- Monthly cashflow
- —
- DSCR
- —
- Eligible?
- —
No personal income docs; deal must DSCR.
Hard money
10% down · 12.0% · 12mo
- Down + closing
- —
- Monthly P&I
- —
- Monthly cashflow
- —
- DSCR
- —
- Eligible?
- —
Short-term bridge; refi at stabilization.
Rent comps 22 comps
| Address | Beds | Baths | Sqft | Rent | $/sqft | DOM | Units | Dist |
|---|---|---|---|---|---|---|---|---|
| 73951 White Sands Dr Thousand Palms, CA | 3.0 | 2.0 | 1517 | $3,200 | $2.11 | 0d | 1 | 0.18mi |
| 32420 Sonoma Cir Thousand Palms, CA | 4.0 | 2.0 | 1368 | $2,100 | $1.54 | 45d | 1 | 0.73mi |
| 32373 Chiricahua Dr Thousand Palms, CA | 3.0 | 2.0 | 1344 | $2,500 | $1.86 | 45d | 1 | 0.74mi |
| 73757 Picasso Dr Palm Desert, CA | 4.0 | 2.5 | 2620 | $5,000 | $1.91 | 19d | 1 | 0.83mi |
| 73528 Cierra St Palm Desert, CA | 3.0 | 2.0 | 1547 | $2,995 | $1.94 | 16d | 1 | 0.95mi |
| 35515 Bains Ave Palm Desert, CA | 3.0 | 2.5 | 1705 | $3,399 | $1.99 | 45d | 1 | 1.03mi |
| 35460 Domani Dr Palm Desert, CA | 3.0 | 3.0 | 1705 | $2,800 | $1.64 | 9d | 1 | 1.04mi |
| 35751 Gateway Dr Palm Desert, CA | 1.0–3.0 | 1.0–2.0 | 1170 | $3,245 | $2.77 | 45d | 1 | 1.11mi |
| 74198 Storke Dr Palm Desert, CA | 3.0 | 2.5 | 2000 | $3,400 | $1.70 | 9d | 1 | 1.16mi |
| 74222 Storke Dr Palm Desert, CA | 4.0 | 2.5 | 2311 | $3,350 | $1.45 | 5d | 1 | 1.16mi |
| 74246 Storke Dr Palm Desert, CA | 4.0 | 3.5 | 2465 | $3,000 | $1.22 | 18d | 1 | 1.17mi |
| 74189 Storke Dr Palm Desert, CA | 3.0 | 3.0 | 1650 | $2,995 | $1.82 | 21d | 1 | 1.18mi |
| 74225 Storke Dr Palm Desert, CA | 4.0 | 3.5 | 2328 | $3,700 | $1.59 | 45d | 1 | 1.19mi |
| 35722 McCarthy St Palm Desert, CA | 4.0 | 2.0 | 2189 | $3,800 | $1.74 | 45d | 1 | 1.24mi |
| 1 Picasso Ct Rancho Mirage, CA | 3.0 | 3.0 | 2450 | $5,200 | $2.12 | 45d | 1 | 1.26mi |
| 35821 Cannon Dr Palm Desert, CA | 4.0 | 3.5 | 2343 | $5,000 | $2.13 | 9d | 1 | 1.33mi |
| 74356 Nichols Dr Palm Desert, CA | 3.0 | 2.0 | 1992 | $3,600 | $1.81 | 45d | 1 | 1.36mi |
| 162 Saint Thomas Pl Rancho Mirage, CA | 3.0 | 2.5 | 2477 | $6,000 | $2.42 | 45d | 1 | 1.43mi |
| 34 Paris Way Rancho Mirage, CA | 3.0 | 3.0 | 2101 | $6,000 | $2.86 | 45d | 1 | 1.46mi |
| 73774 Mojave Desert Dr Palm Desert, CA | 3.0 | 2.0 | 2235 | $4,950 | $2.21 | 45d | 1 | 1.47mi |
| 74699 Technology Dr Palm Desert, CA | 3.0 | 1.0–3.0 | 1057 | $3,840 | $3.63 | 0d | 24 | 1.49mi |
| 75189 Aldrich Dr Palm Desert, CA | 4.0 | 3.0 | 2362 | $3,450 | $1.46 | 9d | 1 | 1.49mi |
HOA detail
- Monthly dues
- $284 · $3,408/yr
Listing history 7 events
-
2026-06-08statusdays on market $312,000 Pending 10 DOM
-
2026-06-07days on market $312,000 Active 9 DOM
-
2026-06-04days on market $312,000 Active 6 DOM
-
2026-06-03days on market $312,000 Active 5 DOM
-
2026-06-02days on market $312,000 Active 4 DOM
-
2026-06-01days on market $312,000 Active 3 DOM
-
2026-05-31days on market $312,000 Active 2 DOM
ⓘ Source: listings_history table (triggers on properties + properties_extension) + one-shot
backfill from property_details.listing_events for pre-trigger history.
Tax reassessment forecast CA · Resets to sale price
- Current annual tax
- $3,574 · $298/mo
- Projected year-2 tax
- $3,574 · $298/mo
- Expected delta
- $0/yr ($0/mo · 0.0%)
ⓘ Screening estimate from a state-policy table — verify with the county assessor before closing.
Climate risk First Street
- Flood 1/10 Low FEMA zone AO · 0% chance over 30 yrs
- Wildfire 4/10 Moderate
- Heat 9/10 Extreme 7 d/yr ≥114°F today · 19 d/yr by 30 yrs out
- Wind 1/10 Low
- Air quality 4/10 Moderate 5 unhealthy d/yr today · 7 by 30 yrs out
Nearby sold comps map
Loading sold comps map…
Walkable amenities ~0.75 mi
Loading nearby amenities…
Taxation est. · year 1
- Rental income
- $42,490
- − Mortgage interest
- −$17,477
- − Property taxes
- −$3,574
- − Insurance
- −$3,028
- − Repairs & maintenance
- −$3,399
- − Management
- −$3,399
- − HOA
- −$3,408
- − Depreciation
- −$9,076
- Taxable loss
- −$871
- Est. tax savings @ 24.0%
- +$209
- After-tax cash flow
- $4,133/yr
For passive investors: Depreciation is non-cash, so a rental often shows a tax loss while cash-flowing — sheltering income. Rental losses are passive: they offset passive income freely, and up to $25,000/yr can offset ordinary (W-2) income if you actively participate and your MAGI is under $100k (phasing out to $0 by $150k); unused losses carry forward. On sale, claimed depreciation is recaptured at up to 25%, and gains may owe capital-gains tax (a 1031 exchange can defer both). Figures are a year-1 estimate at your 24.0% rate — not tax advice; consult a CPA.
Schools (NCES district)
- District
- Palm Springs Unified
- NCES district ID
- 0629550
- Math proficiency
- 21% ▼ -7.00%
- Reading proficiency
- 42% ▬ 0.00%
- Median HH income
- $43,638
- Composite
- 26.76/100
- National rank
- #7131
- State rank
- #328 of 517 in CA
Livability — Thousand Palms
- Score
- 53/100
- State rank
- #950
- US rank
- #24426
Category grades
Schools grade is shown separately in the Schools card above.
Census & demographics
- Census place
- Thousand Palms, CA
- City population
- 7,662
- Population (ZIP)
- 7,662
Population outlook (Riverside County) Hauer SSP2
- Today (2025)
- 2,664,475 people
- By 2030
- 2,802,692 · +5.2%
- By 2040
- 3,050,904 · +14.5%
- By 2050
- 3,256,783 · +22.2%
- By 2075
- 3,655,058 · +37.2%
- By 2100
- 3,766,594 · +41.4%
Race, ethnicity, and origin ACS 2023
- Neighborhood character
- Majority Hispanic (64%)
- Race & ethnicity
- Hispanic / Latino 64% Two or more races 43% White 32% Native American 4%
- Hispanic origin (detail)
- Mexican 62%
- Common ancestry
- Slovak 2% Lithuanian 1% Portuguese 1%
- Foreign-born
- 16% · Canada
- Languages at home
- 54% English-only · Spanish 43% German/W. Germanic 1% Other Indo-European 1%
Political lean MEDSL · Riverside
- 2024 margin
- Toss-up / Even · D 48.0% · R 49.3% · Other 2.6%
- 2008→2024 swing
- -3.6pp toward R · 2008: 2.3pp · 2024: -1.3pp
- All cycles
- 2024: R+1.3 2020: D+8.0 2016: D+4.3 2012: R+0.4 2008: D+2.3
Not yet ingested
- Civics
- —
Market trends
- HPI YoY
- ▼ -46.86%
- Current HPI
- 382.4439
- Rent YoY
- —
- Metro
- —
- State GDP YoY
- ▲ 3.21%
- F500 in state
- 116
Industry mix (Fortune 500 HQ in CA)
| Industry | F500 HQs | Revenue |
|---|---|---|
| Technology | 27 | $1,492B |
|
||
| Financial Services | 3 | $174B |
|
||
| Retail | 3 | $44B |
|
||
| Insurance | 3 | $26B |
|
||
| Media / Entertainment | 2 | $115B |
|
||
| Pharmaceuticals / Biotech | 2 | $62B |
|
||
Price history
+107.3% since first listed4 events — show timeline
- 2026-05-29 Listed $312,000 GPSMLS
- 2026-01-30 Listing Removed — CRMLS
- 2025-10-23 Listed $349,900 CRMLS
- 1991-03-19 Sold (Public Records) $150,500 Public Records
Property tax history
+2.1%/yrLatest (2025): $3,574 · -0.5% YoY. Source: county tax records.
Cash-flow waterfall
monthlySold comps — $/sqft
last 12 mo · ≤1 miLoading sold comps…