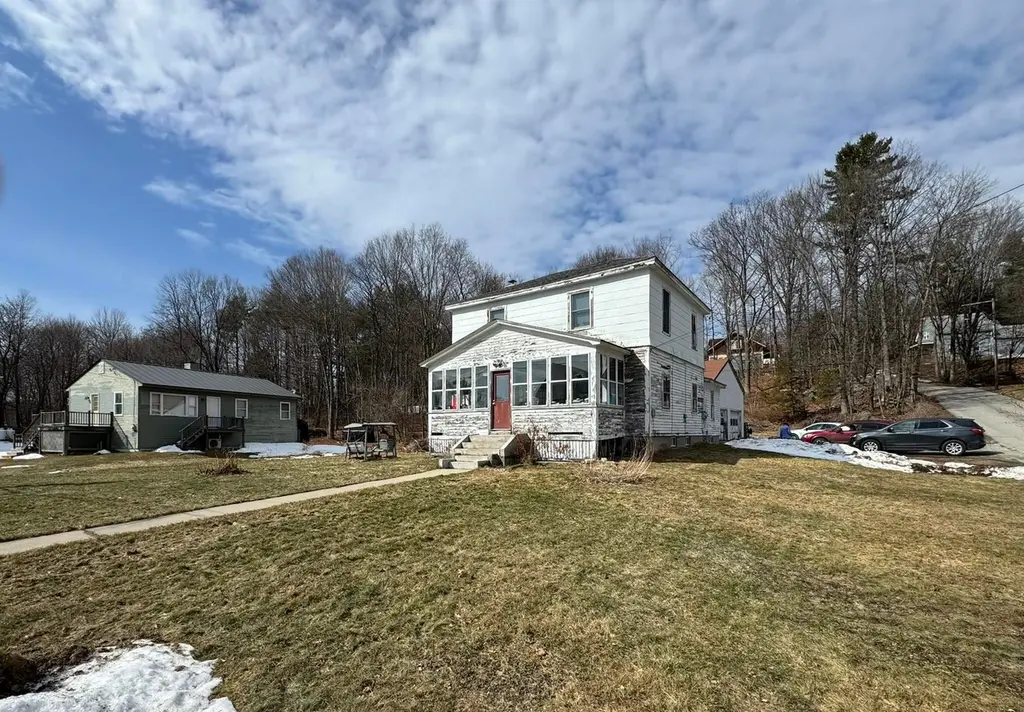
66 Winter St · Newport, NH
Flood risk 7/10 · Major
- FEMA flood zone
- X (unshaded)
- Chance of flooding over 30 yrs
- 0.75%
- Est. flood insurance / yr
- $507 – $1,088
Fire risk 1/10 · Minimal
- Est. fire insurance / yr
- $507 – $941
Heat risk 2/10 · Minimal
- Hot days now (above 91°F)
- 7 days/yr
- Hot days in 30 yrs
- 16 days/yr
Wind risk 3/10 · Minor
- Chance of severe wind over 30 yrs
- 7.0%
Air-quality risk 1/10 · Minimal
- Unhealthy air days now
- 0 days/yr
- Unhealthy air days in 30 yrs
- 0 days/yr
Risk factors via First Street. Map © Google.
Why this score? — see what drove the B- grade
The composite is a weighted blend of 9 inputs, each scored 0–100. Each bar is that input's sub-score; the figure is the points it added to the 100-point composite (weight × sub-score).
- Cash flow +30.0/30.0
- 1% rule +10.0/10.0
- DSCR +10.0/10.0
- ARV discount +7.5/15.0
- Livability +3.8/5.0
- Rent growth +2.5/5.0
- Condition / age +2.5/5.0
- Schools +1.4/10.0
- Appreciation +0.0/10.0
$119,999
🖨 Deal sheet 📄 Offer letter ✓ Due diligence
Listing remarks
Opportunity knocks!! Calling all investors and contractors!! Large 5 Bed/1 bath home with a detached 2 car garage. This is a fixer upper with a TON of potential. Buyer/Buyer agent must conduct their own due diligence, verifications, investigation, analysis, and research. SOLD in its "AS-IS WHERE-IS" CONDITION.
Key facts
- 0.81 acre lot
- 2 garage spots
- Built 1920
Neighborhood map
What this means for you Summary
Snapshot
- This is a 5-bed/1.0-bath single-family listed at $120k.
Deal economics
- At list price, monthly cash flow is $674 ($8k/yr) — positive.
- The deal already cash-flows at list — no discount required.
- Meets the 1% rule at list price ($2k rent vs $120k).
- Recommended offer: $118k (1.5% below list) — sets the bar for market timing.
- Cap rate 13.7% vs local median 3.4% in Newport — top-decile yield for the area; either an underpriced asset or a hidden risk that comps aren't pricing in. Stress-test before assuming the spread holds.
Location & tenants
- Location reads 76/100 on livability (#26 in NH, #3,805 nationally) — a middle-class / working-renter tenant base. Strengths: cost of living A+, housing A+, health & safety A+; Watch: schools D+, amenities F, commute F.
- Newport School District (town): math 10% / reading 21% proficiency, ranked #98 of 98 in NH (top 100%) — low school quality limits family demand, transient renter base, plan for 1-2y turnover.
- Market conditions: 70 active listings in the ZIP; 98 units permitted in Sullivan County in 2024 (0 in 5+ unit buildings).
Forward outlook
- Local home prices are declining (-3.0%/yr); year-one equity from $829 of loan paydown is wiped out by about $4k of value loss. Plan a longer hold.
- Sullivan County population projected at -20% by 2050 — secular population decline; favor cash flow + early exit over multi-decade hold.
- At projected returns (-3.0% appreciation + 3.0% rent growth), your $34k cash investment doubles in ~6 years — after that, you're playing with house money.
Negotiation context
- It's been on market 29 days — a 2% lower offer ($118k) is reasonable based on typical stale-listing flexibility.
Risks & watch-outs
- Watch-outs: property tax is 4.2% of price; flood insurance adds $66/mo; built in 1920 — expect roof / HVAC / electrical / plumbing capex.
- Climate carrying-cost: major flood risk — expect insurance premiums to compound above CPI over the hold.
Questions for the listing agent
- Built in 1920 — when were the roof, HVAC, electrical panel, plumbing, and water heater last replaced?
- Property tax is high relative to price — has the assessment been appealed recently, and will the sale trigger a re-assessment?
- What's the actual annual flood-insurance premium (NFIP or private), and is the property in a SFHA with mandatory coverage?
- Is there a deadline driving the sale (1031 exchange, divorce, estate, relocation)? That informs how much negotiation room exists.
- Schools are D-rated, which usually means shorter tenancies and higher turnover. Who's the typical renter profile here, and what's been the actual vacancy rate?
- What's the average days-on-market for RENTAL listings here right now (not sales)? A rising rental-DOM trend means longer vacancies and softer asking-rent achievability than the comps imply.
- What's the recent tenant-quality profile in this submarket — average credit score on applications, eviction rate, late-payment / NSF rate, and stable-employment percentage? A property-management company in the area should have these aggregated.
- How much new for-sale + rental construction is in the pipeline within 1–3 miles? Heavy new supply typically softens prices + rents 12–24 months out; constrained supply supports both.
Investment metrics
- 1% rule
- 1.94% ✓
- Cap rate
- 13.69%
- Cash-on-cash
- 26.43%
- DSCR
- 2.18
- GRM
- 4.3
CMA / ARV
- ARV (median comp)
- $334,242
- List price
- $119,999
- Delta
- -64.10%
- Verdict
- UNDERPRICED
- Comps
- 20 within 1.0 mi
Show comp detail 8 sales within ~0.75 mi
| Address | Dist | Beds/Ba | Sqft | Sold | Price | $/sf | Match |
|---|---|---|---|---|---|---|---|
| 11 Linden Ave | 0.31mi | 4/2.0 (-1) | 1,944 (+3%) | 10mo | $420,000 | $216 | 64 |
| 162 N Main St | 0.38mi | 4/2.0 (-1) | 1,920 (+2%) | 8mo | $300,000 | $156 | 64 |
| 222 N Main St | 0.52mi | 4/1.0 (-1) | 2,080 (+10%) | 1mo | $284,000 | $137 | 54 |
| 37 Oak St | 0.49mi | 4/2.0 (-1) | 1,790 (-5%) | 14mo | $350,000 | $196 | 48 |
| 47 Summer St | 0.17mi | 4/2.0 (-1) | 1,628 (-14%) | 16mo | $110,000 | $68 | 47 |
| 92 S Main St | 0.64mi | 4/2.0 (-1) | 2,028 (+7%) | 13mo | $409,000 | $202 | 38 |
| 59 Middle St | 0.50mi | 4/2.5 (-1) | 2,122 (+12%) | 14mo | $423,000 | $199 | 34 |
| 207 Maple St | 0.65mi | 4/2.5 (-1) | 1,610 (-15%) | 1mo | $335,000 | $208 | 34 |
Match score weights: distance 35% · size 25% · config 20% · recency 20%. Top-matched comps best support the ARV.
Projected returns pro-forma
-3.0% appreciation · 3.0% rent growth · sell at horizon
- IRR
- 17.4%
- Equity multiple
- 1.71×
- Total profit
- $23,695
- Equity at exit
- $17,892
- IRR
- 26.0%
- Equity multiple
- 3.29×
- Total profit
- $76,860
- Equity at exit
- $10,375
Cash invested: $33,600 (down + closing). Projections, not guarantees.
Landlord ↔ Tenant lean methodology
- Overall (STATE)
- 56 Moderately Landlord-Leaning
- State New Hampshire
- 56 Moderately Landlord-Leaning · D+1
- County
- — inherits STATE
- City
- — inherits STATE
ZIP-level market 03773
- Home prices YoY
- -6.0%
- Active inventory
- 70
- Price-to-rent
- 4.3×
Monthly cashflow live
- Estimated rent
- $2,333 medium interval (Pro) →
- Mortgage (P&I)
- −$629
- Tax from tax record
- −$424 /mo · $5,083/yr
- Insurance
- −$50
- Flood insurance flood zone
- −$66 /mo · $798/yr
- HOA
- −$0
- Vacancy / Maint / Mgmt
- −$490
- Net cashflow
- $674
Break-even live
UW: 25.0% down · 7.5% · 30yr · 1.5% tax · 5.0% vac · 8.0% maint · 8.0% mgmt
Financing live
Cash to close
- Down payment
- $30,000
- Closing costs
- $3,600
- Reserves months
- —
- Total cash needed
- —
Loan-product check · same deal, 3 products live
Conventional
25% down · 7.5% · 30yr
- Down + closing
- —
- Monthly P&I
- —
- Monthly cashflow
- —
- DSCR
- —
- Eligible?
- —
Personal DTI + credit; lowest rate.
DSCR
20% down · 8.5% · 30yr
- Down + closing
- —
- Monthly P&I
- —
- Monthly cashflow
- —
- DSCR
- —
- Eligible?
- —
No personal income docs; deal must DSCR.
Hard money
10% down · 12.0% · 12mo
- Down + closing
- —
- Monthly P&I
- —
- Monthly cashflow
- —
- DSCR
- —
- Eligible?
- —
Short-term bridge; refi at stabilization.
Listing history 1 events
-
2026-04-27$119,999 Active 321-char remark
ⓘ Source: listings_history table (triggers on properties + properties_extension) + one-shot
backfill from property_details.listing_events for pre-trigger history.
Tax reassessment forecast NH · Partial reset (capped growth)
- Current annual tax
- $5,083 · $424/mo
- Projected year-2 tax
- $5,083 · $424/mo
- Expected delta
- $0/yr ($0/mo · 0.0%)
ⓘ Screening estimate from a state-policy table — verify with the county assessor before closing.
Climate risk First Street
- Flood 7/10 Severe FEMA zone X (unshaded) · 75% chance over 30 yrs
- Wildfire 1/10 Low
- Heat 2/10 Low 7 d/yr ≥91°F today · 16 d/yr by 30 yrs out
- Wind 3/10 Moderate 7% chance of damaging wind over 30 yrs
- Air quality 1/10 Low 0 unhealthy d/yr today · 0 by 30 yrs out
Nearby sold comps map
Loading sold comps map…
Walkable amenities ~0.75 mi
Loading nearby amenities…
Taxation est. · year 1
- Rental income
- $27,992
- − Mortgage interest
- −$6,722
- − Property taxes
- −$5,083
- − Insurance
- −$1,397
- − Repairs & maintenance
- −$2,239
- − Management
- −$2,239
- − Depreciation
- −$3,491
- Taxable income
- $6,820
- Est. tax owed @ 24.0%
- −$1,637
- After-tax cash flow
- $6,445/yr
For passive investors: Depreciation is non-cash, so a rental often shows a tax loss while cash-flowing — sheltering income. Rental losses are passive: they offset passive income freely, and up to $25,000/yr can offset ordinary (W-2) income if you actively participate and your MAGI is under $100k (phasing out to $0 by $150k); unused losses carry forward. On sale, claimed depreciation is recaptured at up to 25%, and gains may owe capital-gains tax (a 1031 exchange can defer both). Figures are a year-1 estimate at your 24.0% rate — not tax advice; consult a CPA.
Schools (NCES district)
- District
- Newport School District
- NCES district ID
- 3305310
- Math proficiency
- 10% ▼ -11.00%
- Reading proficiency
- 21% ▼ -13.00%
- Median HH income
- $49,710
- Composite
- 14.12/100
- National rank
- #9459
- State rank
- #98 of 98 in NH
Livability — Newport
- Score
- 76/100
- State rank
- #26
- US rank
- #3805
Category grades
Schools grade is shown separately in the Schools card above.
Census & demographics
- Census place
- Newport, NH
- City population
- 7,905
- Population (ZIP)
- 7,905
Population outlook (Sullivan County) Hauer SSP2
- Today (2025)
- 41,322 people
- By 2030
- 39,910 · -3.4%
- By 2040
- 36,447 · -11.8%
- By 2050
- 32,917 · -20.3%
- By 2075
- 25,997 · -37.1%
- By 2100
- 19,479 · -52.9%
Race, ethnicity, and origin ACS 2023
- Neighborhood character
- Predominantly White (93%)
- Race & ethnicity
- White 93% Two or more races 5% Black 1%
- Common ancestry
- Lithuanian 14% Slovak 4% Romanian 3%
- Foreign-born
- 1%
Political lean MEDSL · Sullivan
- 2024 margin
- Toss-up / Even · D 49.1% · R 49.8% · Other 1.2%
- 2008→2024 swing
- -18.7pp toward R · 2008: 18.0pp · 2024: -0.7pp
- All cycles
- 2024: R+0.7 2020: D+3.6 2016: R+2.6 2012: D+13.3 2008: D+18.0
Not yet ingested
- Civics
- —
Market trends
- HPI YoY
- ▼ -22.59%
- Current HPI
- 352.2789
- Rent YoY
- —
- Metro
- —
- State GDP YoY
- —
- F500 in state
- 0
Property tax history
+2.6%/yrLatest (2025): $5,083 · +3.2% YoY. Source: county tax records.
Cash-flow waterfall
monthlySold comps — $/sqft
last 12 mo · ≤1 miLoading sold comps…