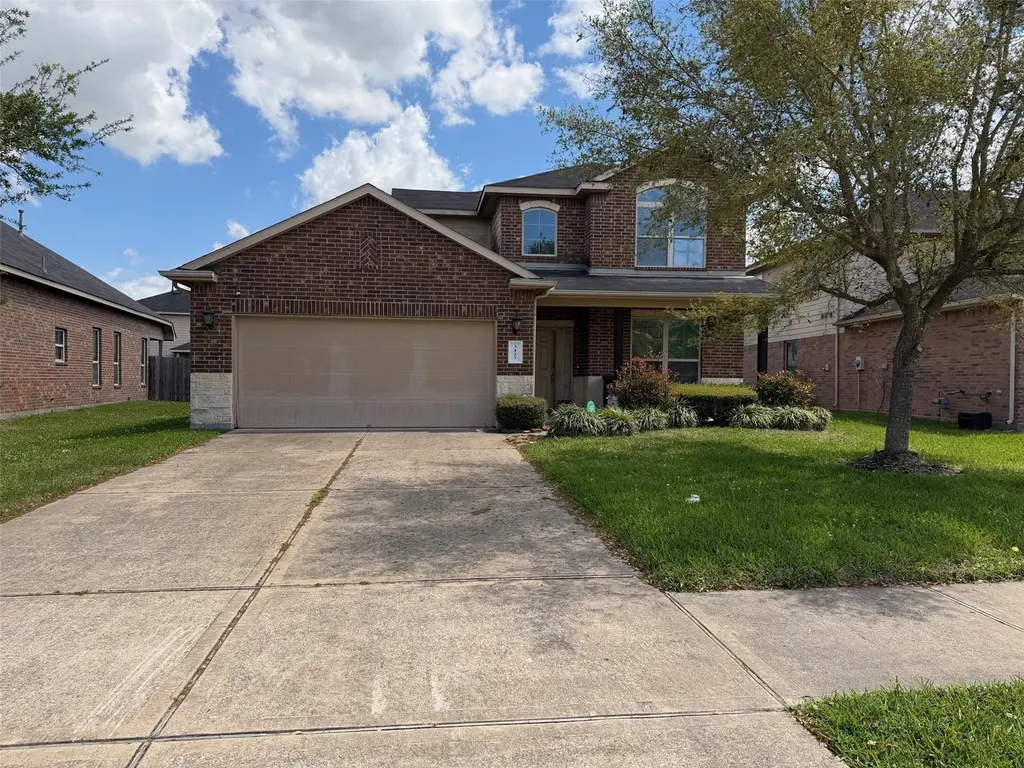
3127 Cambridge Falls Dr · Fresno, TX
Flood risk 1/10 · Minimal
- FEMA flood zone
- X (unshaded)
- Chance of flooding over 30 yrs
- 0.0%
- Est. flood insurance / yr
- $507 – $1,088
Fire risk 4/10 · Minor
- Est. fire insurance / yr
- $1,222 – $2,270
Heat risk 9/10 · Severe
- Hot days now (above 110°F)
- 7 days/yr
- Hot days in 30 yrs
- 24 days/yr
Wind risk 9/10 · Severe
- Chance of severe wind over 30 yrs
- 99.0%
Air-quality risk 2/10 · Minimal
- Unhealthy air days now
- 2 days/yr
- Unhealthy air days in 30 yrs
- 2 days/yr
Risk factors via First Street. Map © Google.
Why this score? — see what drove the D+ grade
The composite is a weighted blend of 9 inputs, each scored 0–100. Each bar is that input's sub-score; the figure is the points it added to the 100-point composite (weight × sub-score).
- Cash flow +13.4/30.0
- ARV discount +8.8/15.0
- 1% rule +4.8/10.0
- Schools +4.5/10.0
- DSCR +4.0/10.0
- Appreciation +4.0/10.0
- Livability +3.1/5.0
- Condition / age +2.5/5.0
- Rent growth +2.3/5.0
$289,000
🖨 Deal sheet 📄 Offer letter ✓ Due diligence
Listing remarks MLS
This well desired DR Horton home features 4 bedrooms, 2 1/2 bathrooms, and a game room for entertaining. The primary bedroom is conveniently located downstairs and adjacent to the family room. The kitchen is an open concept that overlooks the family room. The formal dining room is an added bonus for holiday meals and family gatherings. Retreat in the backyard for serenity and enjoy outdoor family meals on the covered patio. Visit today and make this home of endless possibilities your very own.
Key facts
- Formal dining room
- Open concept
- Covered patio
Tags
Neighborhood map
What this means for you Summary
Snapshot
- This is a 4-bed/3.0-bath single-family listed at $289k.
Deal economics
- At list price, monthly cash flow is $3 ($40/yr) — positive.
- The deal already cash-flows at list — no discount required.
- To meet the 1% rule (rent ≥ 1% of price), the offer needs to be $284k (1.8% below list).
- Recommended offer: $272k (6.0% below list) — sets the bar for market timing.
Location & tenants
- Location reads 62/100 on livability (#943 in TX) — a middle-class / working-renter tenant base. Strengths: employment A+, housing A+, cost of living A; Watch: crime C-, schools D-, amenities F.
- Fort Bend ISD (suburban): math 44% / reading 53% proficiency, ranked #140 of 826 in TX (top 17%) — families likely to look elsewhere, expect single-tenant / working-renter base with shorter leases.
- Market conditions: Rents soft (-0.9%/yr); 175 active listings in the ZIP; 6 comparable units currently listed for rent nearby; rentals lingering (median 44d on market — plan ~5-8 weeks vacancy on turnover, expect pricing pressure); 67% of comp listings sitting > 30 days — soft ceiling on asking rent; solid renter incomes; 12,093 units permitted in Fort Bend County in 2024 (815 in 5+ unit buildings).
- This rent runs 36% of the median local income ($94k/yr) — at the standard rent-burdened threshold; future hikes will face affordability resistance.
Forward outlook
- Local home prices are declining (-2.0%/yr); year-one equity from $2k of loan paydown is wiped out by about $6k of value loss. Plan a longer hold.
- Fort Bend County population projected at +75% by 2050 — long-run rental-demand tailwind backs the buy-and-hold thesis.
Negotiation context
- It's been on market 66 days — a 6% lower offer ($272k) is reasonable based on typical stale-listing flexibility.
- 7 sale attempts since 9y ago with the ask held roughly flat each time — persistent listings suggest the price (not the market) is what's stuck; bring a comps-based counter.
Risks & watch-outs
- Climate carrying-cost: severe wind risk, 99% chance of damaging wind over 30y; extreme-heat days projected 7→24/yr by 2055 (HVAC capex compounding) — expect insurance premiums to compound above CPI over the hold.
Questions for the listing agent
- It's been on market 66 days. Have you received any prior offers? Is the seller open to a 6% concession, seller financing, or rate buy-down credit?
- What does the HOA fee cover, when was the last increase, and are there any pending special assessments or reserve-fund shortfalls?
- Why hasn't it sold? Are there any deal-killer items the seller is aware of (foundation, flood, title, zoning, code violations)?
- Is there a deadline driving the sale (1031 exchange, divorce, estate, relocation)? That informs how much negotiation room exists.
- Schools are D-rated, which usually means shorter tenancies and higher turnover. Who's the typical renter profile here, and what's been the actual vacancy rate?
- The area grade is low — what's the realistic commute time and amenity access for the typical tenant pool here? Any planned neighborhood developments (good or bad) we should know about?
- What's the average days-on-market for RENTAL listings here right now (not sales)? A rising rental-DOM trend means longer vacancies and softer asking-rent achievability than the comps imply.
- What's the recent tenant-quality profile in this submarket — average credit score on applications, eviction rate, late-payment / NSF rate, and stable-employment percentage? A property-management company in the area should have these aggregated.
- How much new for-sale + rental construction is in the pipeline within 1–3 miles? Heavy new supply typically softens prices + rents 12–24 months out; constrained supply supports both.
Investment metrics
- 1% rule
- 0.98% ✗
- Cap rate
- 6.31%
- Cash-on-cash
- 0.05%
- DSCR
- 1.00
- GRM
- 8.5
CMA / ARV
- ARV (median comp)
- $297,419
- List price
- $289,000
- Delta
- -2.83%
- Verdict
- FAIR
- Comps
- 20 within 1.0 mi
Show comp detail 12 sales within ~0.75 mi
| Address | Dist | Beds/Ba | Sqft | Sold | Price | $/sf | Match |
|---|---|---|---|---|---|---|---|
| 3111 Cambridge Falls Dr | 0.04mi | 4/2.5 | 2,352 (+5%) | 3mo | $315,000 | $134 | 85 |
| 1927 Vermillion View St | 0.43mi | 4/2.5 | 2,215 (-1%) | 1mo | $277,500 | $125 | 76 |
| 2022 Wellfleet Xing | 0.27mi | 4/2.0 | 2,098 (-6%) | 0mo | $290,000 | $138 | 73 |
| 3002 Hurst Green Ln | 0.11mi | 4/2.5 | 2,566 (+15%) | 3mo | $345,000 | $134 | 66 |
| 2923 Vales Point Dr | 0.40mi | 4/2.0 | 2,079 (-7%) | 1mo | $306,900 | $148 | 65 |
| 1931 Acorn Glen Trl | 0.38mi | 4/2.5 | 2,480 (+11%) | 1mo | $279,900 | $113 | 61 |
| 2403 Tall Sequoia Dr | 0.63mi | 4/2.5 | 2,340 (+5%) | 1mo | $332,500 | $142 | 60 |
| 3007 Acacia Fair Ln | 0.62mi | 4/2.5 | 2,351 (+5%) | 1mo | $310,000 | $132 | 59 |
| 2406 Grove View Trl | 0.69mi | 4/2.0 | 2,165 (-3%) | 2mo | $297,500 | $137 | 57 |
| 2811 Darby Brook Dr | 0.61mi | 4/2.0 | 2,140 (-4%) | 4mo | $275,000 | $129 | 57 |
| 3103 Illinois St | 0.48mi | 3/2.0 (-1) | 2,007 (-10%) | 2mo | $350,000 | $174 | 50 |
| 3407 Becker Glen St | 0.49mi | 3/2.5 (-1) | 1,948 (-13%) | 0mo | $229,999 | $118 | 49 |
Match score weights: distance 35% · size 25% · config 20% · recency 20%. Top-matched comps best support the ARV.
Projected returns pro-forma
-1.98% appreciation · 0.0% rent growth · sell at horizon
- IRR
- -13.6%
- Equity multiple
- 0.48×
- Total profit
- $-42,245
- Equity at exit
- $56,386
- IRR
- -10.6%
- Equity multiple
- 0.30×
- Total profit
- $-56,720
- Equity at exit
- $48,433
Cash invested: $80,920 (down + closing). Projections, not guarantees.
Landlord ↔ Tenant lean methodology
- Overall (STATE)
- 87 Strongly Landlord-Friendly
- State Texas
- 87 Strongly Landlord-Friendly · R+5
- County
- — inherits STATE
- City
- — inherits STATE
ZIP-level market 77545
- Home prices YoY
- -0.8%
- Rents YoY
- -0.9%
- Active inventory
- 175
- Price-to-rent
- 8.5×
Monthly cashflow live
- Estimated rent
- $2,838 high interval (Pro) →
- Mortgage (P&I)
- −$1,516
- Tax from tax record
- −$549 /mo · $6,584/yr
- Insurance
- −$120
- HOA
- −$54
- Vacancy / Maint / Mgmt
- −$596
- Net cashflow
- $3
Break-even live
UW: 25.0% down · 7.5% · 30yr · 1.5% tax · 5.0% vac · 8.0% maint · 8.0% mgmt
Financing live
Cash to close
- Down payment
- $72,250
- Closing costs
- $8,670
- Reserves months
- —
- Total cash needed
- —
Loan-product check · same deal, 3 products live
Conventional
25% down · 7.5% · 30yr
- Down + closing
- —
- Monthly P&I
- —
- Monthly cashflow
- —
- DSCR
- —
- Eligible?
- —
Personal DTI + credit; lowest rate.
DSCR
20% down · 8.5% · 30yr
- Down + closing
- —
- Monthly P&I
- —
- Monthly cashflow
- —
- DSCR
- —
- Eligible?
- —
No personal income docs; deal must DSCR.
Hard money
10% down · 12.0% · 12mo
- Down + closing
- —
- Monthly P&I
- —
- Monthly cashflow
- —
- DSCR
- —
- Eligible?
- —
Short-term bridge; refi at stabilization.
Rent comps 6 comps
| Address | Beds | Baths | Sqft | Rent | $/sqft | DOM | Units | Dist |
|---|---|---|---|---|---|---|---|---|
| 3623 Elmwood Dale Dr Fresno, TX | 3.0 | 2.0 | 1545 | $1,765 | $1.14 | 43d | 1 | 0.57mi |
| 3806 Teal Maple Ct Fresno, TX | 4.0 | 3.5 | 2318 | $2,146 | $0.93 | 2d | 1 | 0.72mi |
| 3932 Teal Run Place Ct Fresno, TX | 4.0 | 2.0 | 1914 | $2,150 | $1.12 | 43d | 1 | 0.79mi |
| 2403 Orchard Run Fresno, TX | 3.0 | 2.0 | 1459 | $2,800 | $1.92 | 3d | 1 | 0.94mi |
| 2642 Sunlit Meadow Trl Fresno, TX | 5.0 | 3.5 | 2785 | $4,000 | $1.44 | 43d | 1 | 1.06mi |
| 3314 Dry Creek Dr Missouri City, TX | 4.0 | 3.0 | 2600 | $4,200 | $1.62 | 43d | 1 | 1.48mi |
HOA detail
- Monthly dues
- $54 · $648/yr
Listing history 37 events
-
2026-06-18days on market $289,000 Active 66 DOM
-
2026-06-17days on market $289,000 Active 65 DOM
-
2026-06-16days on market $289,000 Active 64 DOM
-
2026-06-15days on market $289,000 Active 63 DOM
-
2026-06-13days on market $289,000 Active 61 DOM
-
2026-06-09days on market $289,000 Active 57 DOM
-
2026-06-07days on market $289,000 Active 55 DOM
-
2026-06-04days on market $289,000 Active 52 DOM
-
2026-06-03days on market $289,000 Active 51 DOM
-
2026-06-02days on market $289,000 Active 50 DOM
-
2026-06-01days on market $289,000 Active 49 DOM
-
2026-05-31days on market $289,000 Active 48 DOM
-
2026-04-17price $289,000 498-char remark
Show marketing remark (498 chars)
This well desired DR Horton home features 4 bedrooms, 2 1/2 bathrooms, and a game room for entertaining. The primary bedroom is conveniently located downstairs and adjacent to the family room. The kitchen is an open concept that overlooks the family room. The formal dining room is an added bonus for holiday meals and family gatherings. Retreat in the backyard for serenity and enjoy outdoor family meals on the covered patio. Visit today and make this home of endless possibilities your very own.
-
2026-04-13$299,000 Active 498-char remark
Show marketing remark (498 chars)
This well desired DR Horton home features 4 bedrooms, 2 1/2 bathrooms, and a game room for entertaining. The primary bedroom is conveniently located downstairs and adjacent to the family room. The kitchen is an open concept that overlooks the family room. The formal dining room is an added bonus for holiday meals and family gatherings. Retreat in the backyard for serenity and enjoy outdoor family meals on the covered patio. Visit today and make this home of endless possibilities your very own.
-
2024-03-07status Option Pending
-
2024-03-06historical
-
2024-02-28status Active
-
2023-12-27historical
-
2023-12-27$299,900 Active
-
2020-05-21historical
-
2020-04-29price $219,990
-
2020-04-11price $224,990
-
2020-02-14price $229,990
-
2019-12-20price $232,500
-
2019-12-17$242,500 Active
-
2019-11-18status Pending
-
2019-11-04status Option Pending
-
2019-11-04historical
-
2019-10-23price $209,990
-
2019-10-18price $214,990
-
2019-10-14$230,000 Active
-
2017-12-22status Pending
-
2017-12-19historical
-
2017-11-27status Active
-
2017-11-17price $207,200
-
2017-11-17historical
-
2017-11-14$202,700 Active
ⓘ Source: listings_history table (triggers on properties + properties_extension) + one-shot
backfill from property_details.listing_events for pre-trigger history.
Tax reassessment forecast TX · Resets to sale price
- Current annual tax
- $6,584 · $549/mo
- Projected year-2 tax
- $6,584 · $549/mo
- Expected delta
- $0/yr ($0/mo · 0.0%)
ⓘ Screening estimate from a state-policy table — verify with the county assessor before closing.
Climate risk First Street
- Flood 1/10 Low FEMA zone X (unshaded) · 0% chance over 30 yrs
- Wildfire 4/10 Moderate
- Heat 9/10 Extreme 7 d/yr ≥110°F today · 24 d/yr by 30 yrs out
- Wind 9/10 Extreme 99% chance of damaging wind over 30 yrs
- Air quality 2/10 Low 2 unhealthy d/yr today · 2 by 30 yrs out
Nearby sold comps map
Loading sold comps map…
Walkable amenities ~0.75 mi
Loading nearby amenities…
Taxation est. · year 1
- Rental income
- $34,055
- − Mortgage interest
- −$16,188
- − Property taxes
- −$6,584
- − Insurance
- −$1,445
- − Repairs & maintenance
- −$2,724
- − Management
- −$2,724
- − HOA
- −$648
- − Depreciation
- −$8,407
- Taxable loss
- −$4,666
- Est. tax savings @ 24.0%
- +$1,120
- After-tax cash flow
- $1,160/yr
For passive investors: Depreciation is non-cash, so a rental often shows a tax loss while cash-flowing — sheltering income. Rental losses are passive: they offset passive income freely, and up to $25,000/yr can offset ordinary (W-2) income if you actively participate and your MAGI is under $100k (phasing out to $0 by $150k); unused losses carry forward. On sale, claimed depreciation is recaptured at up to 25%, and gains may owe capital-gains tax (a 1031 exchange can defer both). Figures are a year-1 estimate at your 24.0% rate — not tax advice; consult a CPA.
Schools (NCES district)
- District
- Fort Bend ISD
- NCES district ID
- 4819650
- Math proficiency
- 44% ▼ -15.00%
- Reading proficiency
- 53% ▼ -4.00%
- Median HH income
- $82,360
- Composite
- 44.61/100
- National rank
- #2779
- State rank
- #140 of 826 in TX
Livability — Fresno
- Score
- 62/100
- State rank
- #943
- US rank
- #16815
Category grades
Schools grade is shown separately in the Schools card above.
Census & demographics
- Census place
- Fresno, TX
- County
- Fort Bend County · 836,777 people
- City population
- 26,236
- Metro
- Houston-The Woodlands-Sugar Land, TX
- Population (ZIP)
- 26,236
- Household income
- $94,474
- Rent vs Own
- Severe rent burden
- 360.0
Population outlook (Fort Bend County) Hauer SSP2
- Today (2025)
- 1,004,526 people
- By 2030
- 1,153,104 · +14.8%
- By 2040
- 1,453,718 · +44.7%
- By 2050
- 1,753,781 · +74.6%
- By 2075
- 2,455,772 · +144.5%
- By 2100
- 2,930,528 · +191.7%
Race, ethnicity, and origin ACS 2023
- Neighborhood character
- Diverse neighborhood (Simpson 0.61)
- Race & ethnicity
- Black 51% Hispanic / Latino 34% Two or more races 12% White 8% Asian 2%
- Hispanic origin (detail)
- Mexican 29%
- Common ancestry
- Portuguese 1%
- Foreign-born
- 18% · Canada
- Languages at home
- 67% English-only · Spanish 29% Other Asian/Pacific 1% Other Indo-European 1%
Political lean MEDSL · Fort Bend
- 2024 margin
- Toss-up / Even · D 49.5% · R 47.9% · Other 2.6%
- 2008→2024 swing
- +4.0pp toward D · 2008: -2.4pp · 2024: 1.6pp
- All cycles
- 2024: D+1.6 2020: D+10.6 2016: D+6.6 2012: R+6.8 2008: R+2.4
Not yet ingested
- Civics
- —
Market trends
- HPI YoY
- ▼ -1.98%
- Current HPI
- 231.3921
- Rent YoY
- ▼ -0.95%
- Metro
- Houston-The Woodlands-Sugar Land, TX
- State GDP YoY
- ▲ 3.95%
- F500 in state
- 110
Industry mix (Fortune 500 HQ in TX)
| Industry | F500 HQs | Revenue |
|---|---|---|
| Energy | 16 | $1,198B |
|
||
| Technology | 5 | $198B |
|
||
| Engineering / Construction | 4 | $72B |
|
||
| Energy Services | 3 | $60B |
|
||
| Utilities | 3 | $41B |
|
||
| Healthcare | 2 | $330B |
|
||
Price history
+42.6% since first listed25 events — show timeline
- 2026-04-17 Price Changed $289,000 HARMLS
- 2026-04-13 Listed $299,000 HARMLS
- 2024-03-07 Pending — HARMLS
- 2024-03-06 Listing Removed — HARMLS
- 2024-02-28 Relisted — HARMLS
- 2023-12-27 Listed $299,900 HARMLS
- 2023-12-27 Listing Removed — HARMLS
- 2020-05-21 Listing Removed — HARMLS
- 2020-04-29 Price Changed $219,990 HARMLS
- 2020-04-11 Price Changed $224,990 HARMLS
- 2020-02-14 Price Changed $229,990 HARMLS
- 2019-12-20 Price Changed $232,500 HARMLS
- 2019-12-17 Listed $242,500 HARMLS
- 2019-11-18 Pending — HARMLS
- 2019-11-04 Pending — HARMLS
- 2019-11-04 Listing Removed — HARMLS
- 2019-10-23 Price Changed $209,990 HARMLS
- 2019-10-18 Price Changed $214,990 HARMLS
- 2019-10-14 Listed $230,000 HARMLS
- 2017-12-22 Pending — HARMLS
- 2017-12-19 Listing Removed — HARMLS
- 2017-11-27 Relisted — HARMLS
- 2017-11-17 Listing Removed — HARMLS
- 2017-11-17 Price Changed $207,200 HARMLS
- 2017-11-14 Listed $202,700 HARMLS
Property tax history
+25.6%/yrLatest (2025): $6,584 · +0.3% YoY. Source: county tax records.
Cash-flow waterfall
monthlySold comps — $/sqft
last 12 mo · ≤1 miLoading sold comps…