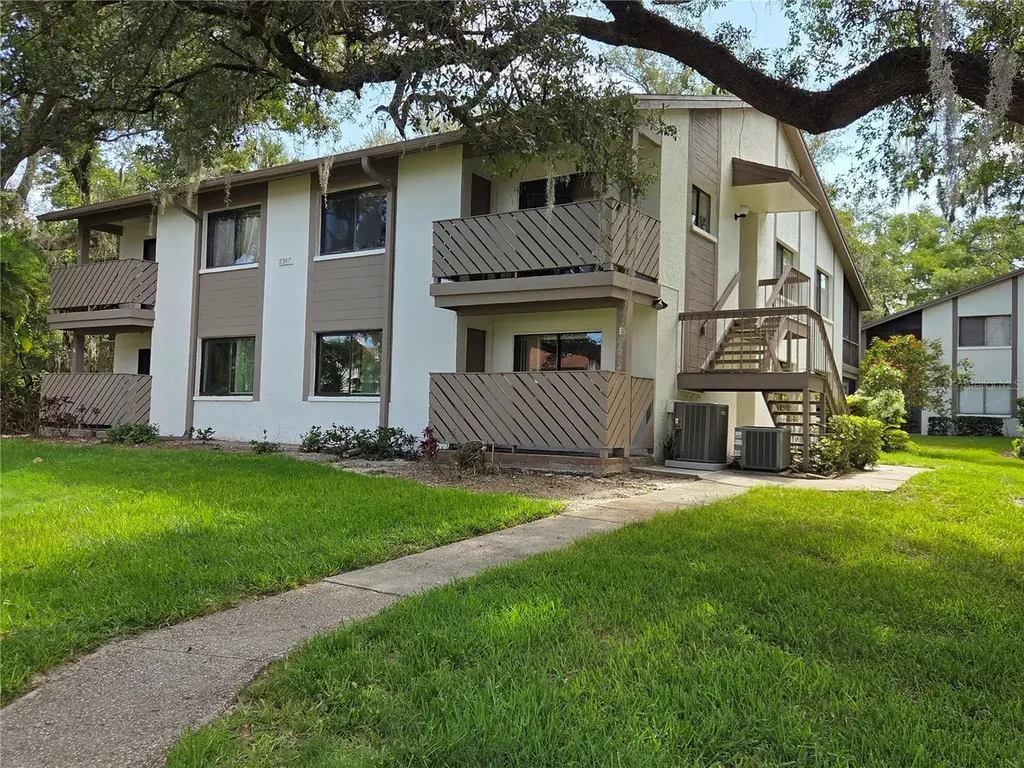
2367 Flanders Way Unit D · Safety Harbor, FL
Flood risk 4/10 · Minor
- FEMA flood zone
- X (unshaded)
- Chance of flooding over 30 yrs
- 0.22%
- Est. flood insurance / yr
- $507 – $1,088
Fire risk 1/10 · Minimal
- Est. fire insurance / yr
- $947 – $1,759
Heat risk 10/10 · Severe
- Hot days now (above 107°F)
- 7 days/yr
- Hot days in 30 yrs
- 29 days/yr
Wind risk 10/10 · Severe
- Chance of severe wind over 30 yrs
- 99.0%
Air-quality risk 3/10 · Minor
- Unhealthy air days now
- 3 days/yr
- Unhealthy air days in 30 yrs
- 3 days/yr
Risk factors via First Street. Map © Google.
Why this score? — see what drove the D grade
The composite is a weighted blend of 9 inputs, each scored 0–100. Each bar is that input's sub-score; the figure is the points it added to the 100-point composite (weight × sub-score).
- Cash flow +9.9/30.0
- ARV discount +7.5/15.0
- 1% rule +6.6/10.0
- Livability +4.4/5.0
- Rent growth +4.3/5.0
- Schools +4.3/10.0
- DSCR +2.8/10.0
- Condition / age +2.5/5.0
- Appreciation +0.0/10.0
$199,000
🖨 Deal sheet (PDF) 📄 Offer letter ✓ Due diligence
Listing remarks MLS
SAFETY HARBOR !! Gleaming hardwood floors greet you in this 3 bedroom 2 bathroom totally remodeled condo. There are 2 spacious balconies , one fully screened. Convenient ensuite bathroom and walk-in closet in master bedroom. There is a full size laundry room. 2 storage unit, 1 covered parking space, community pool and clubhouse are just some of the amenities!! Enjoy a stroll to Philippe Park or a bike ride to downtown Safety Harbor for a great dinner !! Tennis and basketball courts also just down the street !!
Key facts
- Mature oak trees
- Spacious kitchen
- Large pantry
Tags
Property features AI
Finance
- Other: Association contact listed as Suzanne MacDonald
- Financial info: Monthly fees total $674; total annual fees $8,088; Lease restrictions apply
- HOA & community: Monthly HOA fee of $674 covering cable TV, common area taxes, pool, escrow reserves fund, insurance, internet, structure maintenance, grounds maintenance, recreational facilities, sewer, trash and water; Association required with buyer approval required; Community clubhouse, pool, sidewalks, street lights, community mailbox, deed restrictions, association-owned recreation; Pets allowed (max ~25 lbs)
Exterior
- Parking: Has carport (1 space)
- Security: Smoke detectors
- Utilities: Public water; Public sewer; Electricity connected; Cable available; Water connected
- Home design: Residential condominium; 2-story building; unit on 2nd floor; Faces west; Completed condition
- Construction: Block foundation; Block and stucco construction; Shingle roof; Built with building number 2367
- Exterior features: Covered, enclosed and screened patio/porch; Balcony; Sliding doors; Outdoor storage; Paved road access; Mature landscaping
Interior
- Kitchen: Dishwasher; Microwave; Range; Refrigerator; Electric water heater
- Bedrooms: 3 bedrooms
- Flooring: Tile; Wood
- Bathrooms: 2 full bathrooms
- Heating & cooling: Central heating (electric); Central air conditioning
- Interior features: Ceiling fans; Living room/dining room combo; Thermostat; Walk-in closet(s); Aluminum-framed windows; Smoke detector(s)
- Laundry & utility: Inside laundry room
Neighborhood map
What this means for you Summary
Snapshot
- This is a 3-bed/2.0-bath condo listed at $199k.
Deal economics
- At list price, monthly cash flow is $-124 ($-1k/yr) — negative.
- To cash-flow at today's rent, offer at most $177k (11.0% below list).
- Meets the 1% rule at list price ($2k rent vs $199k).
- Recommended offer: $177k (11.0% below list) — sets the bar for cash-flow.
- Cap rate 5.5% vs local median 2.7% in Safety Harbor — top-decile yield for the area; either an underpriced asset or a hidden risk that comps aren't pricing in. Stress-test before assuming the spread holds.
Location & tenants
- Location reads 87/100 on livability (#8 in FL, #296 nationally) — a professional / high-income tenant draw. Strengths: crime A+, commute A+, employment A+; Watch: amenities F.
- Pinellas (suburban): math 51% / reading 51% proficiency, ranked #31 of 73 in FL (top 42%) — acceptable for families but not a draw, mixed tenant base, ~2y average lease.
- Zoned schools: Safety Harbor Elementary School (math 63% / reading 66%, grade B, #525 of 2,144 statewide, top 26%, 657 students, 49% FRL); Safety Harbor Middle School (math 45% / reading 43%, grade D, #327 of 571 statewide, top 57%, 974 students, 50% FRL); Countryside High School (math 25% / reading 45%, grade F, #379 of 667 statewide, top 58%, 1,741 students, 44% FRL) — zoned schools at 47% FRL track the district average.
- Market conditions: Rents rising fast (+7.3%/yr); 171 active listings in the ZIP; 24 comparable units currently listed for rent nearby; rentals at typical pace (median 20d on market — plan ~3-4 weeks tenant-placement turnaround); solid renter incomes; 2,676 units permitted in Pinellas County in 2024 (1,422 in 5+ unit buildings).
Forward outlook
- Local home prices are declining (-3.0%/yr); year-one equity from $1k of loan paydown is wiped out by about $6k of value loss. Plan a longer hold.
- Pinellas County population projected at +14% by 2050 — modest demand growth; plan on rents tracking national, not racing it.
Negotiation context
- Only 11 days on market — expect competitive offers; lowballing is unlikely to land.
- 3 sale attempts since 14y ago with the ask held roughly flat each time — persistent listings suggest the price (not the market) is what's stuck; bring a comps-based counter.
- Current owner paid $135k; 47% above their basis — modest negotiation headroom, anchor on the comps not their cost.
Risks & watch-outs
- Watch-outs: HOA is 29% of rent.
- Climate carrying-cost: severe wind risk, 99% chance of damaging wind over 30y; extreme-heat days projected 7→29/yr by 2055 (HVAC capex compounding) — expect insurance premiums to compound above CPI over the hold.
Questions for the listing agent
- What do current leases actually rent for vs. the listed asking? Can we see a recent rent roll and the last 12 months of T-12 income?
- What does the HOA fee cover, when was the last increase, and are there any pending special assessments or reserve-fund shortfalls?
- Any open or pending special assessments — roof, HVAC, plumbing, elevator, façade? What's the per-unit balance and payoff schedule, and is the seller paying it off at close or rolling it to the buyer?
- Is there a deadline driving the sale (1031 exchange, divorce, estate, relocation)? That informs how much negotiation room exists.
- Schools are B-rated — typically a magnet for longer-tenancy family renters. What's the average tenant stay here, and is there a school-zone premium baked into asking?
- The area grade is low — what's the realistic commute time and amenity access for the typical tenant pool here? Any planned neighborhood developments (good or bad) we should know about?
- What's the average days-on-market for RENTAL listings here right now (not sales)? A rising rental-DOM trend means longer vacancies and softer asking-rent achievability than the comps imply.
- What's the recent tenant-quality profile in this submarket — average credit score on applications, eviction rate, late-payment / NSF rate, and stable-employment percentage? A property-management company in the area should have these aggregated.
- How much new apartment / multifamily construction is in the pipeline within 1–3 miles? Heavy new supply (>2% of stock underway) typically softens rents 12–24 months out; light construction supports rent growth.
Investment metrics
- 1% rule
- 1.16% ✓
- Cap rate
- 5.55%
- Cash-on-cash
- -2.66%
- DSCR
- 0.88
- GRM
- 7.2
CMA / ARV
No comps found within radius.
Projected returns pro-forma
-3.0% appreciation · 7.34% rent growth · sell at horizon
- IRR
- -13.8%
- Equity multiple
- 0.48×
- Total profit
- $-29,173
- Equity at exit
- $29,672
- IRR
- 2.7%
- Equity multiple
- 1.24×
- Total profit
- $13,438
- Equity at exit
- $17,206
Cash invested: $55,720 (down + closing). Projections, not guarantees.
Landlord ↔ Tenant lean methodology
- Overall (STATE)
- 87 Strongly Landlord-Friendly
- State Florida
- 87 Strongly Landlord-Friendly · R+3
- County
- — inherits STATE
- City
- — inherits STATE
ZIP-level market 34695
- Home prices YoY
- -30.2%
- Rents YoY
- 7.3%
- Active inventory
- 171
- Price-to-rent
- 7.2×
Monthly cashflow live
- Estimated rent
- $2,317 high interval (Pro) →
- Mortgage (P&I)
- −$1,044
- Tax from tax record
- −$154 /mo · $1,843/yr
- Insurance
- −$83
- HOA
- −$674
- Vacancy / Maint / Mgmt
- −$487
- Net cashflow
- $-124
Break-even live
Sensitivity live
| Price | -10% $-11 | -5% $-67 | +0% $-124 | +5% $-180 | +10% $-236 |
|---|---|---|---|---|---|
| Rent | -10% $-307 | -5% $-215 | +0% $-124 | +5% $-32 | +10% $59 |
| Rate | -1.0pp $-23 | -0.5pp $-73 | base $-124 | +0.5pp $-175 | +1.0pp $-228 |
UW: 25.0% down · 7.5% · 30yr · 1.5% tax · 5.0% vac · 8.0% maint · 8.0% mgmt
Financing live
Cash to close
- Down payment
- $49,750
- Closing costs
- $5,970
- Reserves months
- —
- Total cash needed
- —
Loan-product check · same deal, 3 products live
Conventional
25% down · 7.5% · 30yr
- Down + closing
- —
- Monthly P&I
- —
- Monthly cashflow
- —
- DSCR
- —
- Eligible?
- —
Personal DTI + credit; lowest rate.
DSCR
20% down · 8.5% · 30yr
- Down + closing
- —
- Monthly P&I
- —
- Monthly cashflow
- —
- DSCR
- —
- Eligible?
- —
No personal income docs; deal must DSCR.
Hard money
10% down · 12.0% · 12mo
- Down + closing
- —
- Monthly P&I
- —
- Monthly cashflow
- —
- DSCR
- —
- Eligible?
- —
Short-term bridge; refi at stabilization.
Rent comps 24 comps
| Address | Beds | Baths | Sqft | Rent | $/sqft | DOM | Units | Dist |
|---|---|---|---|---|---|---|---|---|
| 600 Summerhill Ct Unit A Safety Harbor, FL | 2.0 | 2.0 | 1060 | $2,450 | $2.31 | 26d | 1 | 0.09mi |
| 115 Coral Dr Safety Harbor, FL | 3.0 | 2.0 | 1241 | $3,000 | $2.42 | 6d | 1 | 0.45mi |
| 2035 Philippe Pkwy Safety Harbor, FL | 1.0–2.0 | 1.0–2.0 | 718 | $1,920 | $2.67 | 5d | 11 | 0.55mi |
| 300 Kent Pl Safety Harbor, FL | 2.0 | 1.0 | 939 | $1,795 | $1.91 | 22d | 1 | 0.78mi |
| 313 Bay Pl Safety Harbor, FL | 2.0 | 1.0 | 939 | $1,695 | $1.81 | 13d | 1 | 0.84mi |
| 310 7th St N Unit A Safety Harbor, FL | 2.0 | 2.0 | 1250 | $2,250 | $1.80 | 26d | 1 | 0.85mi |
| 625 4th Ave N Safety Harbor, FL | 2.0 | 1.0 | 786 | $2,000 | $2.54 | 26d | 1 | 0.86mi |
| 1135 7th St N Safety Harbor, FL | 3.0 | 1.0 | 1125 | $2,195 | $1.95 | 16d | 1 | 0.87mi |
| 1135 Dover Ct Safety Harbor, FL | 2.0 | 2.0 | 1013 | $2,290 | $2.26 | 16d | 1 | 0.88mi |
| 1155 Thayer St Safety Harbor, FL | 2.0 | 2.0 | 1013 | $2,050 | $2.02 | 18d | 1 | 0.89mi |
| 285 Rogers Ct Safety Harbor, FL | 2.0 | 2.0 | 1013 | $1,795 | $1.77 | 26d | 1 | 0.90mi |
| 1066 Philippe Pkwy Unit 2 Safety Harbor, FL | 2.0 | 1.0 | 700 | $1,595 | $2.28 | 26d | 1 | 0.94mi |
| 1723 Cypress Trace Dr Safety Harbor, FL | 2.0 | 2.0 | 1415 | $2,395 | $1.69 | 0d | 1 | 1.03mi |
| 3062 Eastland Blvd #202 Clearwater, FL | 2.0 | 2.0 | 1250 | $2,300 | $1.84 | 26d | 1 | 1.10mi |
| 3042 Eastland Blvd Unit H110 Clearwater, FL | 2.0 | 2.0 | 1030 | $1,700 | $1.65 | 26d | 1 | 1.19mi |
| 3038 Eastland Blvd Unit F101 Clearwater, FL | 2.0 | 2.0 | 1030 | $1,775 | $1.72 | 6d | 1 | 1.21mi |
| 2652 N McMullen Booth Rd Clearwater, FL | 1.0–3.0 | 1.0–2.0 | 1037 | $2,156 | $2.08 | 0d | 15 | 1.22mi |
| 337 McMullen Booth Rd Clearwater, FL | 2.0 | 1.0 | 1087 | $1,800 | $1.66 | 10d | 1 | 1.23mi |
| 2941 Shore Dr Safety Harbor, FL | 2.0 | 1.0 | 1055 | $1,825 | $1.73 | 6d | 1 | 1.35mi |
| 247 Short St Safety Harbor, FL | 2.0 | 1.0 | 808 | $1,900 | $2.35 | 6d | 1 | 1.36mi |
| 2955 Bay View Dr Safety Harbor, FL | 2.0 | 1.0 | 1047 | $2,150 | $2.05 | 26d | 1 | 1.38mi |
| 380 3rd St S Unit 4A Safety Harbor, FL | 2.0 | 1.0 | 700 | $2,395 | $3.42 | 20d | 1 | 1.39mi |
| 500 9th Ave S Apt C1 Safety Harbor, FL | 3.0 | 2.0 | 1182 | $2,195 | $1.86 | 26d | 1 | 1.48mi |
| 500 9th Ave S Apt B3 Safety Harbor, FL | 2.0 | 2.0 | 893 | $1,795 | $2.01 | 26d | 1 | 1.48mi |
HOA detail condo
- Monthly dues
- $674 · $8,088/yr
- Likely covers
- pool
- Assessments
- None detected in remarks — confirm with the listing agent.
Listing history 7 events
-
2026-06-22days on market $199,000 Active 11 DOM
-
2026-06-18days on market $199,000 Active 8 DOM
-
2026-06-17days on market $199,000 Active 7 DOM
-
2026-06-16days on market $199,000 Active 6 DOM
-
2026-06-15days on market $199,000 Active 5 DOM
-
2026-06-13remarks 693-char remark
-
2026-06-13$199,000 Active 3 DOM
ⓘ Source: listings_history table (triggers on properties + properties_extension) + one-shot
backfill from property_details.listing_events for pre-trigger history.
Tax reassessment forecast FL · Resets to sale price
- Current annual tax
- $1,843 · $154/mo
- Projected year-2 tax
- $1,843 · $154/mo
- Expected delta
- $0/yr ($0/mo · 0.0%)
ⓘ Screening estimate from a state-policy table — verify with the county assessor before closing.
Climate risk First Street
- Flood 4/10 Moderate FEMA zone X (unshaded) · 22% chance over 30 yrs
- Wildfire 1/10 Low
- Heat 10/10 Extreme 7 d/yr ≥107°F today · 29 d/yr by 30 yrs out
- Wind 10/10 Extreme 99% chance of damaging wind over 30 yrs
- Air quality 3/10 Moderate 3 unhealthy d/yr today · 3 by 30 yrs out
Nearby sold comps map
Loading sold comps map…
Walkable amenities ~0.75 mi
Loading nearby amenities…
Taxation est. · year 1
- Rental income
- $27,804
- − Mortgage interest
- −$11,147
- − Property taxes
- −$1,843
- − Insurance
- −$995
- − Repairs & maintenance
- −$2,224
- − Management
- −$2,224
- − HOA
- −$8,088
- − Depreciation
- −$5,789
- Taxable loss
- −$4,507
- Est. tax savings @ 24.0%
- +$1,082
- After-tax cash flow
- $-402/yr
For passive investors: Depreciation is non-cash, so a rental often shows a tax loss while cash-flowing — sheltering income. Rental losses are passive: they offset passive income freely, and up to $25,000/yr can offset ordinary (W-2) income if you actively participate and your MAGI is under $100k (phasing out to $0 by $150k); unused losses carry forward. On sale, claimed depreciation is recaptured at up to 25%, and gains may owe capital-gains tax (a 1031 exchange can defer both). Figures are a year-1 estimate at your 24.0% rate — not tax advice; consult a CPA.
Schools (NCES district)
- District
- Pinellas
- NCES district ID
- 1201560
- Math proficiency
- 51% ▼ -5.00%
- Reading proficiency
- 51% ▼ -3.00%
- Median HH income
- $46,270
- Composite
- 43.27/100
- National rank
- #3046
- State rank
- #31 of 73 in FL
Livability — Safety Harbor
- Score
- 87/100
- State rank
- #8
- US rank
- #296
Category grades
Schools grade is shown separately in the Schools card above.
Census & demographics
- Census place
- Safety Harbor, FL
- County
- Pinellas County · 939,478 people
- City population
- 18,098
- Metro
- Tampa-St. Petersburg-Clearwater, FL
- Population (ZIP)
- 18,098
- Household income
- $95,238
- Rent vs Own
- Severe rent burden
- 103.0
Population outlook (Pinellas County) Hauer SSP2
- Today (2025)
- 1,027,532 people
- By 2030
- 1,063,586 · +3.5%
- By 2040
- 1,125,020 · +9.5%
- By 2050
- 1,168,637 · +13.7%
- By 2075
- 1,265,188 · +23.1%
- By 2100
- 1,260,357 · +22.7%
Race, ethnicity, and origin ACS 2023
- Neighborhood character
- Predominantly White (75%)
- Race & ethnicity
- White 75% Hispanic / Latino 11% Black 7% Two or more races 7% Asian 2%
- Hispanic origin (detail)
- Puerto Rican 4% Cuban 3%
- Common ancestry
- Romanian 4% Lithuanian 3% Slovak 2%
- Foreign-born
- 10% · Canada, Jamaica, Vietnam
- Languages at home
- 91% English-only · Spanish 6% Other Indo-European 1% German/W. Germanic 1%
Political lean MEDSL · Pinellas
- 2024 margin
- Lean R (+5.2) · D 46.9% · R 52.1%
- 2008→2024 swing
- -13.5pp toward R · 2008: 8.3pp · 2024: -5.2pp
- All cycles
- 2024: R+5.2 2020: D+0.2 2016: R+1.1 2012: D+5.6 2008: D+8.3
Not yet ingested
- Civics
- —
Market trends
- HPI YoY
- ▼ -144.72%
- Current HPI
- 335.0437
- Rent YoY
- ▲ 7.34%
- Metro
- Tampa-St. Petersburg-Clearwater, FL
- State GDP YoY
- ▲ 3.28%
- F500 in state
- 36
Industry mix (Fortune 500 HQ in FL)
| Industry | F500 HQs | Revenue |
|---|---|---|
| Industrial Technology | 2 | $29B |
|
||
| Insurance | 2 | $17B |
|
||
| Retail | 1 | $60B |
|
||
| Technology Distribution | 1 | $58B |
|
||
| Homebuilding | 1 | $35B |
|
||
| Technology Manufacturing | 1 | $35B |
|
||
Price history
+193.5% since first listed10 events — show timeline
- 2026-06-10 Listed $199,000 Stellar MLS as Distributed by MLS Grid
- 2017-06-09 Sold (Public Records) $135,000 Public Records
- 2017-06-02 Sold (MLS) $135,000 Stellar MLS as Distributed by MLS Grid
- 2017-04-20 Pending — Stellar MLS as Distributed by MLS Grid
- 2017-04-18 Price Changed $149,900 Stellar MLS as Distributed by MLS Grid
- 2017-04-06 Listed $159,900 Stellar MLS as Distributed by MLS Grid
- 2012-08-08 Sold (MLS) $87,500 Stellar MLS as Distributed by MLS Grid
- 2012-07-19 Listed $87,500 Stellar MLS as Distributed by MLS Grid
- 1992-04-22 Sold (Public Records) $64,000 Public Records
- 1984-02-01 Sold (Public Records) $67,800 Public Records
Property tax history
+2.1%/yrLatest (2025): $1,843 · +6.6% YoY. Source: county tax records.
Cash-flow waterfall
monthlySold comps — $/sqft
last 12 mo · ≤1 miLoading sold comps…