1228 Balsam Rd · Hutchins, TX
Flood risk No data
- FEMA flood zone
- —
- Chance of flooding over 30 yrs
- —
- Est. flood insurance / yr
- —
Fire risk No data
- Est. fire insurance / yr
- —
Heat risk No data
- Hot days now (above threshold)
- —
- Hot days in 30 yrs
- —
Wind risk No data
- Chance of severe wind over 30 yrs
- —
Air-quality risk No data
- Unhealthy air days now
- —
- Unhealthy air days in 30 yrs
- —
Risk factors via First Street. Map © Google.
Why this score? — see what drove the D+ grade
The composite is a weighted blend of 9 inputs, each scored 0–100. Each bar is that input's sub-score; the figure is the points it added to the 100-point composite (weight × sub-score).
- Cash flow +15.6/30.0
- ARV discount +6.9/15.0
- Appreciation +5.6/10.0
- DSCR +4.8/10.0
- 1% rule +4.3/10.0
- Condition / age +4.0/5.0
- Livability +3.0/5.0
- Schools +2.8/10.0
- Rent growth +2.5/5.0
$236,999
🖨 Deal sheet (PDF) 📄 Offer letter ✓ Due diligence
Listing remarks
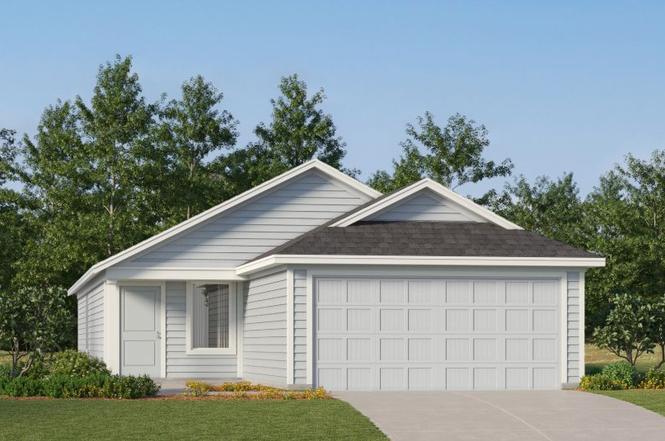
This single-level home showcases a spacious open floorplan shared between the kitchen, dining area and family room for easy entertaining during gatherings. An owner's suite enjoys a private location in a rear corner of the home, complemented by an en-suite bathroom and walk-in closet. There are two secondary bedrooms along the side of the home, which are comfortable spaces for household members and overnight guests.
Key facts
- Walk-in closet
- Open floorplan
- Secondary bedrooms
Tags
Property features AI
Finance
- Other: Virtual tour available
- Financial info: List price $236,999
Exterior
- Parking: 2 total parking spaces; 2-car garage
- Home design: Single-family home, Kitson plan; Active listing
- Exterior features: Address: 1228 Balsam Rd, Hutchins, TX 75141
Interior
- Bedrooms: 3 bedrooms
- Bathrooms: 2 full bathrooms
- Interior features: Spec new construction (Kitson plan); Living area approximately 1,402
Neighborhood map
What this means for you Summary
Snapshot
- This is a 3-bed/2.0-bath single-family listed at $237k. Condition is rated good.
Deal economics
- At list price, monthly cash flow is $100 ($1k/yr) — positive.
- The deal already cash-flows at list — no discount required.
- To meet the 1% rule (rent ≥ 1% of price), the offer needs to be $220k (7.2% below list).
- Recommended offer: $220k (7.2% below list) — sets the bar for 1% rule.
- Cap rate 6.8% vs local median 3.8% in Hutchins — top-decile yield for the area; either an underpriced asset or a hidden risk that comps aren't pricing in. Stress-test before assuming the spread holds.
Location & tenants
- Location reads 60/100 on livability (#1,096 in TX) — a middle-class / working-renter tenant base. Strengths: cost of living A+, housing A; Watch: schools F, crime F, amenities F.
- Dallas ISD (urban): math 31% / reading 36% proficiency, ranked #559 of 826 in TX (top 68%) — families likely to look elsewhere, expect single-tenant / working-renter base with shorter leases; 83% free/reduced lunch — lower-income household profile, screen leases tightly.
- Market conditions: 85 active listings in the ZIP; 1 comparable units currently listed for rent nearby; 12,577 units permitted in Dallas County in 2024 (6,829 in 5+ unit buildings).
Forward outlook
- In year one you build about $5k of equity ($2k loan paydown + $3k appreciation (1.2% local appreciation)).
- Dallas County population projected at +35% by 2050 — long-run rental-demand tailwind backs the buy-and-hold thesis.
- At projected returns (1.2% appreciation + 3.0% rent growth), your $66k cash investment doubles in ~9 years — after that, you're playing with house money.
- By year 7, paydown + projected appreciation supports a ~$30k cash-out refi (75% LTV) — recoverable capital for the next deal without selling this one.
Negotiation context
- Only 2 days on market — expect competitive offers; lowballing is unlikely to land.
Questions for the listing agent
- Is there a deadline driving the sale (1031 exchange, divorce, estate, relocation)? That informs how much negotiation room exists.
- Schools are F-rated, which usually means shorter tenancies and higher turnover. Who's the typical renter profile here, and what's been the actual vacancy rate?
- Crime grade is F in this area — have there been break-ins, vandalism, or insurance claims at this property in the last 3 years? What carrier currently insures it and at what premium?
- The area grade is low — what's the realistic commute time and amenity access for the typical tenant pool here? Any planned neighborhood developments (good or bad) we should know about?
- What's the average days-on-market for RENTAL listings here right now (not sales)? A rising rental-DOM trend means longer vacancies and softer asking-rent achievability than the comps imply.
- What's the recent tenant-quality profile in this submarket — average credit score on applications, eviction rate, late-payment / NSF rate, and stable-employment percentage? A property-management company in the area should have these aggregated.
- How much new for-sale + rental construction is in the pipeline within 1–3 miles? Heavy new supply typically softens prices + rents 12–24 months out; constrained supply supports both.
Investment metrics
- 1% rule
- 0.93% ✗
- Cap rate
- 6.80%
- Cash-on-cash
- 1.81%
- DSCR
- 1.08
- GRM
- 9.0
CMA / ARV
- ARV (on-the-fly)
- $234,134
- Comps found
- 11
Show comp detail 11 sales within ~0.75 mi
| Address | Dist | Beds/Ba | Sqft | Sold | Price | $/sf | Match |
|---|---|---|---|---|---|---|---|
| 1645 Woodbrook Ln | 0.21mi | 3/2.0 | 1,325 (-6%) | 1mo | $279,000 | $211 | 80 |
| 1117 Skyline Dr | 0.44mi | 3/2.0 | 1,290 (-8%) | 6mo | $259,000 | $201 | 61 |
| 1041 Crestview Dr | 0.43mi | 3/2.0 | 1,520 (+8%) | 9mo | $250,000 | $164 | 58 |
| 1121 Crestview Dr | 0.38mi | 3/2.0 | 1,520 (+8%) | 20mo | $274,000 | $180 | 52 |
| 1200 Ridgewood Ln | 0.57mi | 4/2.0 (+1) | 1,274 (-9%) | 2mo | $215,000 | $169 | 51 |
| 1209 Ridgewood Ln | 0.59mi | 3/2.0 | 1,316 (-6%) | 16mo | $209,990 | $160 | 49 |
| 1121 Skyline Dr | 0.43mi | 3/2.0 | 1,535 (+10%) | 22mo | $275,000 | $179 | 46 |
| 1200 Timberview Dr | 0.51mi | 3/2.0 | 1,604 (+14%) | 12mo | $266,000 | $166 | 42 |
| 1113 Glenhaven Dr | 0.50mi | 4/2.0 (+1) | 1,588 (+13%) | 11mo | $260,000 | $164 | 41 |
| 1204 Bluff View Dr | 0.57mi | 3/2.0 | 1,604 (+14%) | 11mo | $267,900 | $167 | 40 |
| 1007 Timberview Dr | 0.61mi | 3/2.0 | 1,604 (+14%) | 22mo | $259,000 | $161 | 29 |
Match score weights: distance 35% · size 25% · config 20% · recency 20%. Top-matched comps best support the ARV.
Projected returns pro-forma
1.21% appreciation · 3.0% rent growth · sell at horizon
- IRR
- 3.9%
- Equity multiple
- 1.20×
- Total profit
- $13,291
- Equity at exit
- $83,511
- IRR
- 8.2%
- Equity multiple
- 2.02×
- Total profit
- $67,467
- Equity at exit
- $113,019
Cash invested: $66,360 (down + closing). Projections, not guarantees.
Landlord ↔ Tenant lean methodology
- Overall (STATE)
- 87 Strongly Landlord-Friendly
- State Texas
- 87 Strongly Landlord-Friendly · R+5
- County
- — inherits STATE
- City
- — inherits STATE
ZIP-level market 75141
- Home prices YoY
- 0.3%
- Active inventory
- 85
- Price-to-rent
- 9.0×
Monthly cashflow live
- Estimated rent
- $2,200 medium interval (Pro) →
- Mortgage (P&I)
- −$1,243
- Tax est. 1.5%
- −$296 /mo · $3,555/yr
- Insurance
- −$99
- HOA
- −$0
- Vacancy / Maint / Mgmt
- −$462
- Net cashflow
- $100
Break-even live
Sensitivity live
| Price | -10% $264 | -5% $182 | +0% $100 | +5% $18 | +10% $-64 |
|---|---|---|---|---|---|
| Rent | -10% $-74 | -5% $13 | +0% $100 | +5% $187 | +10% $274 |
| Rate | -1.0pp $220 | -0.5pp $160 | base $100 | +0.5pp $39 | +1.0pp $-24 |
UW: 25.0% down · 7.5% · 30yr · 1.5% tax · 5.0% vac · 8.0% maint · 8.0% mgmt
Financing live
Cash to close
- Down payment
- $59,250
- Closing costs
- $7,110
- Reserves months
- —
- Total cash needed
- —
Loan-product check · same deal, 3 products live
Conventional
25% down · 7.5% · 30yr
- Down + closing
- —
- Monthly P&I
- —
- Monthly cashflow
- —
- DSCR
- —
- Eligible?
- —
Personal DTI + credit; lowest rate.
DSCR
20% down · 8.5% · 30yr
- Down + closing
- —
- Monthly P&I
- —
- Monthly cashflow
- —
- DSCR
- —
- Eligible?
- —
No personal income docs; deal must DSCR.
Hard money
10% down · 12.0% · 12mo
- Down + closing
- —
- Monthly P&I
- —
- Monthly cashflow
- —
- DSCR
- —
- Eligible?
- —
Short-term bridge; refi at stabilization.
Rent comps 1 comps
| Address | Beds | Baths | Sqft | Rent | $/sqft | DOM | Units | Dist |
|---|---|---|---|---|---|---|---|---|
| 1653 Bluff View Dr Hutchins, TX | 3.0 | 2.0 | 1325 | $2,200 | $1.66 | 9d | 1 | 0.28mi |
Listing history 3 events
-
2026-06-18days on market $236,999 Active 2 DOM
-
2026-06-17remarks 419-char remark
-
2026-06-17$236,999 Active 1 DOM
ⓘ Source: listings_history table (triggers on properties + properties_extension) + one-shot
backfill from property_details.listing_events for pre-trigger history.
Nearby sold comps map
Loading sold comps map…
Walkable amenities ~0.75 mi
Loading nearby amenities…
Taxation est. · year 1
- Rental income
- $26,400
- − Mortgage interest
- −$13,276
- − Property taxes
- −$3,555
- − Insurance
- −$1,185
- − Repairs & maintenance
- −$2,112
- − Management
- −$2,112
- − Depreciation
- −$6,895
- Taxable loss
- −$2,734
- Est. tax savings @ 24.0%
- +$656
- After-tax cash flow
- $1,858/yr
For passive investors: Depreciation is non-cash, so a rental often shows a tax loss while cash-flowing — sheltering income. Rental losses are passive: they offset passive income freely, and up to $25,000/yr can offset ordinary (W-2) income if you actively participate and your MAGI is under $100k (phasing out to $0 by $150k); unused losses carry forward. On sale, claimed depreciation is recaptured at up to 25%, and gains may owe capital-gains tax (a 1031 exchange can defer both). Figures are a year-1 estimate at your 24.0% rate — not tax advice; consult a CPA.
Condition & rehab AI · 12 photos
This single-level home features a spacious open floorplan with modern finishes and a good condition. Minor touch-ups and updates can significantly enhance its value for both resale and rental.
Value-add opportunities
- Both Paint touch-ups — Fresh paint enhances curb appeal and interior aesthetics
- Both Landscaping improvements — Enhances curb appeal and adds value
- Both New flooring in high-traffic areas — Improves durability and appearance
- Both New kitchen appliances — Modernizes the kitchen and adds value
- Both New bathroom fixtures — Enhances functionality and aesthetics
Renovation cost estimate screening
Value-add ROI direction
- Both Paint touch-ups — Fresh paint enhances curb appeal and interior aesthetics ↑
- Both Landscaping improvements — Enhances curb appeal and adds value ↑
- Both New flooring in high-traffic areas — Improves durability and appearance ↑
- Both New kitchen appliances — Modernizes the kitchen and adds value ↑
- Both New bathroom fixtures — Enhances functionality and aesthetics ↑
ⓘ Cost ranges are severity-bucket heuristics (US national rule-of-thumb). Get contractor quotes + a written scope before underwriting a rehab budget.
Schools (NCES district)
- District
- Dallas ISD
- NCES district ID
- 4816230
- Math proficiency
- 31% ▼ -16.00%
- Reading proficiency
- 36% ▼ -4.00%
- Median HH income
- $42,881
- Composite
- 28.41/100
- National rank
- #6763
- State rank
- #559 of 826 in TX
Livability — Hutchins
- Score
- 60/100
- State rank
- #1096
- US rank
- #19422
Category grades
Schools grade is shown separately in the Schools card above.
Census & demographics
- Census place
- Hutchins, TX
- City population
- 4,686
- Population (ZIP)
- 4,686
Population outlook (Dallas County) Hauer SSP2
- Today (2025)
- 2,979,839 people
- By 2030
- 3,191,823 · +7.1%
- By 2040
- 3,619,611 · +21.5%
- By 2050
- 4,026,915 · +35.1%
- By 2075
- 4,957,073 · +66.4%
- By 2100
- 5,508,725 · +84.9%
Race, ethnicity, and origin ACS 2023
- Neighborhood character
- Diverse neighborhood (Simpson 0.56)
- Race & ethnicity
- Hispanic / Latino 53% Black 39% Two or more races 24% White 6%
- Hispanic origin (detail)
- Mexican 46% Puerto Rican 3%
- Common ancestry
- Slovak 1% American 1% Russian 1%
- Foreign-born
- 23% · Canada
- Languages at home
- 51% English-only · Spanish 49% Other Indo-European 1%
Political lean MEDSL · Dallas
- 2024 margin
- Strong D (+22.2) · D 60.2% · R 38.0% · Other 1.8%
- 2008→2024 swing
- +6.9pp toward D · 2008: 15.3pp · 2024: 22.2pp
- All cycles
- 2024: D+22.2 2020: D+31.6 2016: D+26.2 2012: D+15.4 2008: D+15.3
Not yet ingested
- Civics
- —
Market trends
- HPI YoY
- ▲ 1.21%
- Current HPI
- 382.1182
- Rent YoY
- —
- Metro
- —
- State GDP YoY
- ▲ 3.95%
- F500 in state
- 110
Industry mix (Fortune 500 HQ in TX)
| Industry | F500 HQs | Revenue |
|---|---|---|
| Energy | 16 | $1,198B |
|
||
| Technology | 5 | $198B |
|
||
| Engineering / Construction | 4 | $72B |
|
||
| Energy Services | 3 | $60B |
|
||
| Utilities | 3 | $41B |
|
||
| Healthcare | 2 | $330B |
|
||
Cash-flow waterfall
monthlySold comps — $/sqft
last 12 mo · ≤1 miLoading sold comps…