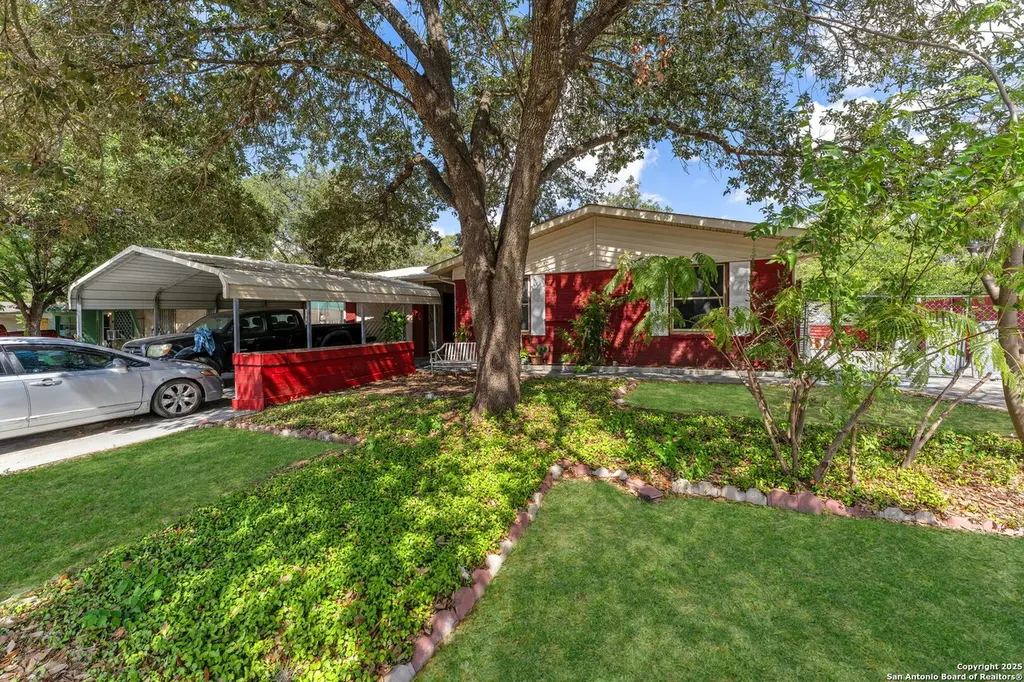
4219 Moana Dr · San Antonio, TX
Flood risk 1/10 · Minimal
- FEMA flood zone
- X (unshaded)
- Chance of flooding over 30 yrs
- 0.0%
- Est. flood insurance / yr
- $507 – $1,088
Fire risk 1/10 · Minimal
- Est. fire insurance / yr
- $1,222 – $2,270
Heat risk 8/10 · Major
- Hot days now (above 108°F)
- 7 days/yr
- Hot days in 30 yrs
- 22 days/yr
Wind risk 8/10 · Major
- Chance of severe wind over 30 yrs
- 80.0%
Air-quality risk 2/10 · Minimal
- Unhealthy air days now
- 0 days/yr
- Unhealthy air days in 30 yrs
- 1 days/yr
Risk factors via First Street. Map © Google.
Why this score? — see what drove the D grade
The composite is a weighted blend of 9 inputs, each scored 0–100. Each bar is that input's sub-score; the figure is the points it added to the 100-point composite (weight × sub-score).
- ARV discount +13.4/15.0
- Cash flow +10.8/30.0
- 1% rule +4.7/10.0
- Livability +4.0/5.0
- Schools +3.8/10.0
- DSCR +3.1/10.0
- Condition / age +2.5/5.0
- Rent growth +1.1/5.0
- Appreciation +0.0/10.0
$190,000
🖨 Deal sheet (PDF) 📄 Offer letter ✓ Due diligence
Listing remarks MLS
Owner financing available! Charming & situated in a highly convenient location, this one-story style home has been converted into multi-family living. Dividing walls separate the property into 3 units, with one meter. Enjoy the upside potential of separate dwelling units through converted living spaces, each with kitchenette and bath. Notice plenty of parking space with pavement on both sides, ensuring easy RV/Boat storage. Interior features include the living/dining room with separate kitchen and eating bar. The family room boasts a skylight. The backyard offers a covered porch, gazebo, and flexibility, all fenced and gated. Moments from Fort Sam, I-35, 410 & surrounded by amenities, this property presents an excellent opportunity for home-buyers and investors alike. Property IS currently tenant occupied, please do not disturb tenants.
Key facts
- Separate kitchen
- Easy rv boat storage
- Living dining room
Tags
Neighborhood map
What this means for you Summary
Snapshot
- This is a 3-bed/2.0-bath single-family listed at $190k.
Deal economics
- At list price, monthly cash flow is $-86 ($-1k/yr) — negative.
- To cash-flow at today's rent, offer at most $175k (8.0% below list).
- To meet the 1% rule (rent ≥ 1% of price), the offer needs to be $185k (2.6% below list).
- Recommended offer: $167k (12.0% below list) — sets the bar for market timing.
- Cap rate 5.7% vs local median 3.8% in San Antonio — top-decile yield for the area; either an underpriced asset or a hidden risk that comps aren't pricing in. Stress-test before assuming the spread holds.
Location & tenants
- Location reads 80/100 on livability (#31 in TX, #1,616 nationally) — a professional / high-income tenant draw. Strengths: amenities A+, commute A+, cost of living A+; Watch: crime F.
- North East ISD (urban): math 38% / reading 49% proficiency, ranked #276 of 826 in TX (top 33%) — families likely to look elsewhere, expect single-tenant / working-renter base with shorter leases.
- Zoned schools: East Terrell Hills El (math 19% / reading 38%, grade F, #2,706 of 4,322 statewide, top 63%, 601 students, 92% FRL); Krueger Middle (math 37% / reading 34%, grade F, #827 of 1,662 statewide, top 51%, 813 students, 77% FRL); Roosevelt H S (math 20% / reading 40%, grade F, #1,096 of 1,632 statewide, top 68%, 2,599 students, 72% FRL) — zoned schools average 80% FRL vs 41% district-wide (39 pts higher); higher-poverty schools than district average — tighter screening recommended.
- Zoned-school proficiency averages 31% at this address vs 44% district-wide (-12 pts) — the specific schools serving this property underperform the North East ISD average; the district grade overstates school quality for this exact location.
- Market conditions: Rents falling (-5.6%/yr); 135 active listings in the ZIP; 22 comparable units currently listed for rent nearby; rentals at typical pace (median 21d on market — plan ~3-4 weeks tenant-placement turnaround); 8,308 units permitted in Bexar County in 2024 (2,506 in 5+ unit buildings).
- This rent runs 39% of the median local income ($57k/yr) — at the standard rent-burdened threshold; future hikes will face affordability resistance.
Forward outlook
- Local home prices are declining (-3.0%/yr); year-one equity from $1k of loan paydown is wiped out by about $6k of value loss. Plan a longer hold.
- Bexar County population projected at +50% by 2050 — long-run rental-demand tailwind backs the buy-and-hold thesis.
Negotiation context
- It's been on market 247 days — a 12% lower offer ($167k) is reasonable based on typical stale-listing flexibility.
- 6 sale attempts since 8y ago; this cycle's ask has dropped $10k (5%) from the opening price — seller is motivated, your offer sets the floor, not the list.
Risks & watch-outs
- Watch-outs: property tax is 3.0% of price.
- Climate carrying-cost: severe wind risk, 80% chance of damaging wind over 30y; extreme-heat days projected 7→22/yr by 2055 (HVAC capex compounding) — expect insurance premiums to compound above CPI over the hold.
Questions for the listing agent
- What do current leases actually rent for vs. the listed asking? Can we see a recent rent roll and the last 12 months of T-12 income?
- It's been on market 247 days. Have you received any prior offers? Is the seller open to a 12% concession, seller financing, or rate buy-down credit?
- Built in 1960 — when were the roof, HVAC, electrical panel, plumbing, and water heater last replaced?
- Property tax is high relative to price — has the assessment been appealed recently, and will the sale trigger a re-assessment?
- Why hasn't it sold? Are there any deal-killer items the seller is aware of (foundation, flood, title, zoning, code violations)?
- Is there a deadline driving the sale (1031 exchange, divorce, estate, relocation)? That informs how much negotiation room exists.
- Crime grade is F in this area — have there been break-ins, vandalism, or insurance claims at this property in the last 3 years? What carrier currently insures it and at what premium?
- The area grade is low — what's the realistic commute time and amenity access for the typical tenant pool here? Any planned neighborhood developments (good or bad) we should know about?
- What's the average days-on-market for RENTAL listings here right now (not sales)? A rising rental-DOM trend means longer vacancies and softer asking-rent achievability than the comps imply.
- What's the recent tenant-quality profile in this submarket — average credit score on applications, eviction rate, late-payment / NSF rate, and stable-employment percentage? A property-management company in the area should have these aggregated.
- How much new for-sale + rental construction is in the pipeline within 1–3 miles? Heavy new supply typically softens prices + rents 12–24 months out; constrained supply supports both.
Investment metrics
- 1% rule
- 0.97% ✗
- Cap rate
- 5.75%
- Cash-on-cash
- -1.94%
- DSCR
- 0.91
- GRM
- 8.6
CMA / ARV
- ARV (median comp)
- $218,689
- List price
- $190,000
- Delta
- -13.12%
- Verdict
- UNDERPRICED
- Comps
- 20 within 1.0 mi
Show comp detail 12 sales within ~0.75 mi
| Address | Dist | Beds/Ba | Sqft | Sold | Price | $/sf | Match |
|---|---|---|---|---|---|---|---|
| 4307 Judivan | 0.26mi | 3/2.0 | 1,808 (+1%) | 3mo | $220,000 | $122 | 83 |
| 226 Covina | 0.26mi | 3/2.0 | 1,879 (+5%) | 1mo | $165,000 | $88 | 78 |
| 4407 Bikini Dr | 0.23mi | 4/2.0 (+1) | 1,685 (-6%) | 10mo | $240,000 | $142 | 66 |
| 231 Cicero | 0.53mi | 4/2.0 (+1) | 1,781 (-0%) | 11mo | $264,900 | $149 | 60 |
| 4427 Monaco | 0.55mi | 4/2.0 (+1) | 1,796 (+1%) | 11mo | $225,000 | $125 | 59 |
| 4531 Eisenhauer Rd | 0.50mi | 4/1.0 (+1) | 1,677 (-6%) | 0mo | $197,500 | $118 | 58 |
| 4051 Tallulah | 0.29mi | 4/3.0 (+1) | 1,640 (-8%) | 8mo | $255,999 | $156 | 58 |
| 4110 Waikiki | 0.20mi | 3/2.0 | 1,527 (-14%) | 14mo | $179,900 | $118 | 55 |
| 4538 Waikiki | 0.46mi | 3/2.0 | 1,524 (-15%) | 0mo | $220,000 | $144 | 54 |
| 347 Blaze Ave | 0.53mi | 3/2.0 | 1,610 (-10%) | 9mo | $149,500 | $93 | 51 |
| 4339 Renault | 0.73mi | 4/2.0 (+1) | 1,767 (-1%) | 14mo | $210,000 | $119 | 48 |
| 4130 Modena | 0.58mi | 4/2.0 (+1) | 1,635 (-8%) | 12mo | $233,000 | $143 | 44 |
Match score weights: distance 35% · size 25% · config 20% · recency 20%. Top-matched comps best support the ARV.
Projected returns pro-forma
-3.0% appreciation · 0.0% rent growth · sell at horizon
- IRR
- -23.5%
- Equity multiple
- 0.22×
- Total profit
- $-41,524
- Equity at exit
- $28,330
- IRR
- -32.5%
- Equity multiple
- -0.19×
- Total profit
- $-63,482
- Equity at exit
- $16,428
Cash invested: $53,200 (down + closing). Projections, not guarantees.
Landlord ↔ Tenant lean methodology
- Overall (STATE)
- 87 Strongly Landlord-Friendly
- State Texas
- 87 Strongly Landlord-Friendly · R+5
- County
- — inherits STATE
- City
- — inherits STATE
ZIP-level market 78218
- Home prices YoY
- -16.1%
- Rents YoY
- -5.6%
- Active inventory
- 135
- Price-to-rent
- 8.6×
Monthly cashflow live
- Estimated rent
- $1,851 high interval (Pro) →
- Mortgage (P&I)
- −$996
- Tax from tax record
- −$473 /mo · $5,673/yr
- Insurance
- −$79
- HOA
- −$0
- Vacancy / Maint / Mgmt
- −$389
- Net cashflow
- $-86
Break-even live
Sensitivity live
| Price | -10% $21 | -5% $-32 | +0% $-86 | +5% $-140 | +10% $-194 |
|---|---|---|---|---|---|
| Rent | -10% $-232 | -5% $-159 | +0% $-86 | +5% $-13 | +10% $60 |
| Rate | -1.0pp $10 | -0.5pp $-38 | base $-86 | +0.5pp $-135 | +1.0pp $-185 |
UW: 25.0% down · 7.5% · 30yr · 1.5% tax · 5.0% vac · 8.0% maint · 8.0% mgmt
Financing live
Cash to close
- Down payment
- $47,500
- Closing costs
- $5,700
- Reserves months
- —
- Total cash needed
- —
Loan-product check · same deal, 3 products live
Conventional
25% down · 7.5% · 30yr
- Down + closing
- —
- Monthly P&I
- —
- Monthly cashflow
- —
- DSCR
- —
- Eligible?
- —
Personal DTI + credit; lowest rate.
DSCR
20% down · 8.5% · 30yr
- Down + closing
- —
- Monthly P&I
- —
- Monthly cashflow
- —
- DSCR
- —
- Eligible?
- —
No personal income docs; deal must DSCR.
Hard money
10% down · 12.0% · 12mo
- Down + closing
- —
- Monthly P&I
- —
- Monthly cashflow
- —
- DSCR
- —
- Eligible?
- —
Short-term bridge; refi at stabilization.
Rent comps 22 comps
| Address | Beds | Baths | Sqft | Rent | $/sqft | DOM | Units | Dist |
|---|---|---|---|---|---|---|---|---|
| 6347 Kingston Dr San Antonio, TX | 3.0 | 2.0 | 1672 | $1,800 | $1.08 | 5d | 1 | 0.13mi |
| 4310 Judivan San Antonio, TX | 3.0 | 2.0 | 1859 | $2,300 | $1.24 | 21d | 1 | 0.27mi |
| 206 Covina Ave San Antonio, TX | 3.0 | 2.0 | 1332 | $2,000 | $1.50 | 25d | 1 | 0.29mi |
| 106 Covina Ave San Antonio, TX | 3.0 | 2.0 | 1421 | $2,000 | $1.41 | 3d | 1 | 0.36mi |
| 4511 Diamondhead Dr San Antonio, TX | 4.0 | 2.5 | 1829 | $2,050 | $1.12 | 9d | 1 | 0.37mi |
| 343 Blaze Ave San Antonio, TX | 3.0 | 2.0 | 1438 | $1,750 | $1.22 | 18d | 1 | 0.55mi |
| 547 Cicero Ave Unit NA San Antonio, TX | 3.0 | 2.0 | 1500 | $1,525 | $1.02 | 45d | 1 | 0.56mi |
| 143 Huxley Dr San Antonio, TX | 3.0 | 2.0 | 1290 | $2,000 | $1.55 | 25d | 1 | 0.71mi |
| 3730 La Sabre Dr San Antonio, TX | 4.0 | 2.0 | 1434 | $1,900 | $1.32 | 45d | 1 | 0.74mi |
| 842 Corinne Dr #21 San Antonio, TX | 3.0 | 2.0 | 1248 | $49,000 | $39.26 | 23d | 1 | 0.81mi |
| 258 Antrim Dr San Antonio, TX | 3.0 | 2.0 | 1252 | $1,595 | $1.27 | 45d | 1 | 0.83mi |
| 3623 Invicta Dr San Antonio, TX | 3.0 | 2.0 | 1688 | $1,695 | $1.00 | 3d | 1 | 0.88mi |
| 1006 Sumner Dr San Antonio, TX | 3.0 | 2.0 | 1314 | $1,697 | $1.29 | 25d | 1 | 0.90mi |
| 3615 Electra Dr San Antonio, TX | 4.0 | 2.0 | 1992 | $2,299 | $1.15 | 12d | 1 | 0.95mi |
| 258 Cresham Dr San Antonio, TX | 3.0 | 2.0 | 1383 | $1,650 | $1.19 | 45d | 1 | 0.95mi |
| 4811 Village Vw San Antonio, TX | 3.0 | 2.0 | 1288 | $1,450 | $1.13 | 9d | 1 | 1.10mi |
| 5014 Galahad Dr San Antonio, TX | 4.0 | 2.0 | 1400 | $1,900 | $1.36 | 3d | 1 | 1.16mi |
| 5031 Lancelot Dr San Antonio, TX | 3.0 | 2.0 | 1340 | $1,395 | $1.04 | 46d | 1 | 1.17mi |
| 2530 Harry Wurzbach Rd San Antonio, TX | 1.0–3.0 | 1.0–2.0 | 950 | $1,420 | $1.49 | 0d | 11 | 1.24mi |
| 5130 Village Green San Antonio, TX | 3.0 | 1.0 | 1620 | $1,350 | $0.83 | 18d | 1 | 1.29mi |
| 742 Olney Dr San Antonio, TX | 3.0 | 2.0 | 1469 | $1,445 | $0.98 | 45d | 1 | 1.33mi |
| 5134 Gawain Dr San Antonio, TX | 3.0 | 2.0 | 1488 | $1,750 | $1.18 | 19d | 1 | 1.50mi |
Listing history 34 events
-
2026-06-17days on market $190,000 Active 247 DOM
-
2026-06-16days on market $190,000 Active 246 DOM
-
2026-06-13days on market $190,000 Active 243 DOM
-
2026-06-13days on market $190,000 Active 242 DOM
-
2026-06-09days on market $190,000 Active 239 DOM
-
2026-06-08days on market $190,000 Active 238 DOM
-
2026-06-07days on market $190,000 Active 237 DOM
-
2026-06-04days on market $190,000 Active 234 DOM
-
2026-06-03days on market $190,000 Active 233 DOM
-
2026-06-02days on market $190,000 Active 232 DOM
-
2026-06-01days on market $190,000 Active 231 DOM
-
2026-05-31days on market $190,000 Active 230 DOM
-
2026-02-19price $190,000 856-char remark
Show marketing remark (856 chars)
Owner financing available! Charming & situated in a highly convenient location, this one-story style home has been converted into multi-family living. Dividing walls separate the property into 3 units, with one meter. Enjoy the upside potential of separate dwelling units through converted living spaces, each with kitchenette and bath. Notice plenty of parking space with pavement on both sides, ensuring easy RV/Boat storage. Interior features include the living/dining room with separate kitchen and eating bar. The family room boasts a skylight. The backyard offers a covered porch, gazebo, and flexibility, all fenced and gated. Moments from Fort Sam, I-35, 410 & surrounded by amenities, this property presents an excellent opportunity for home-buyers and investors alike. Property IS currently tenant occupied, please do not disturb tenants.
-
2025-10-13$200,000 New 856-char remark
Show marketing remark (856 chars)
Owner financing available! Charming & situated in a highly convenient location, this one-story style home has been converted into multi-family living. Dividing walls separate the property into 3 units, with one meter. Enjoy the upside potential of separate dwelling units through converted living spaces, each with kitchenette and bath. Notice plenty of parking space with pavement on both sides, ensuring easy RV/Boat storage. Interior features include the living/dining room with separate kitchen and eating bar. The family room boasts a skylight. The backyard offers a covered porch, gazebo, and flexibility, all fenced and gated. Moments from Fort Sam, I-35, 410 & surrounded by amenities, this property presents an excellent opportunity for home-buyers and investors alike. Property IS currently tenant occupied, please do not disturb tenants.
-
2023-09-13soldstatus
-
2023-09-07historical
-
2023-08-10price $225,000
-
2023-06-01$239,500 New
-
2023-04-05soldstatus
-
2022-07-28historical
-
2022-07-06price $202,000
-
2022-05-27price $210,000
-
2022-04-30status Back on Market
-
2022-04-28historical Active Option
-
2022-04-21$221,000 New
-
2018-12-28soldstatus Sold
-
2018-12-28soldstatus
-
2018-12-04historical Active Option
-
2018-10-17price $165,000
-
2018-10-05price $175,000
-
2018-09-11$185,950 New
-
2018-08-29historical
-
2018-08-23$175,000 New
-
2018-08-23soldstatus
ⓘ Source: listings_history table (triggers on properties + properties_extension) + one-shot
backfill from property_details.listing_events for pre-trigger history.
Tax reassessment forecast TX · Resets to sale price
- Current annual tax
- $5,673 · $473/mo
- Projected year-2 tax
- $5,673 · $473/mo
- Expected delta
- $0/yr ($0/mo · 0.0%)
ⓘ Screening estimate from a state-policy table — verify with the county assessor before closing.
Climate risk First Street
- Flood 1/10 Low FEMA zone X (unshaded) · 0% chance over 30 yrs
- Wildfire 1/10 Low
- Heat 8/10 Severe 7 d/yr ≥108°F today · 22 d/yr by 30 yrs out
- Wind 8/10 Severe 80% chance of damaging wind over 30 yrs
- Air quality 2/10 Low 0 unhealthy d/yr today · 1 by 30 yrs out
Nearby sold comps map
Loading sold comps map…
Walkable amenities ~0.75 mi
Loading nearby amenities…
Taxation est. · year 1
- Rental income
- $22,210
- − Mortgage interest
- −$10,643
- − Property taxes
- −$5,673
- − Insurance
- −$950
- − Repairs & maintenance
- −$1,777
- − Management
- −$1,777
- − Depreciation
- −$5,527
- Taxable loss
- −$4,136
- Est. tax savings @ 24.0%
- +$993
- After-tax cash flow
- $-41/yr
For passive investors: Depreciation is non-cash, so a rental often shows a tax loss while cash-flowing — sheltering income. Rental losses are passive: they offset passive income freely, and up to $25,000/yr can offset ordinary (W-2) income if you actively participate and your MAGI is under $100k (phasing out to $0 by $150k); unused losses carry forward. On sale, claimed depreciation is recaptured at up to 25%, and gains may owe capital-gains tax (a 1031 exchange can defer both). Figures are a year-1 estimate at your 24.0% rate — not tax advice; consult a CPA.
Schools (NCES district)
- District
- North East ISD
- NCES district ID
- 4832940
- Math proficiency
- 38% ▼ -14.00%
- Reading proficiency
- 49% ▼ -4.00%
- Median HH income
- $57,715
- Composite
- 38.1/100
- National rank
- #4276
- State rank
- #276 of 826 in TX
Livability — San Antonio
- Score
- 80/100
- State rank
- #31
- US rank
- #1616
Category grades
Schools grade is shown separately in the Schools card above.
Census & demographics
- Census place
- San Antonio, TX
- County
- Bexar County · 1,990,555 people
- City population
- 1,806,925
- Metro
- San Antonio-New Braunfels, TX
- Population (ZIP)
- 39,428
- Household income
- $57,285
- Rent vs Own
- Severe rent burden
- 2508.0
Population outlook (Bexar County) Hauer SSP2
- Today (2025)
- 2,336,851 people
- By 2030
- 2,560,728 · +9.6%
- By 2040
- 3,020,569 · +29.3%
- By 2050
- 3,493,522 · +49.5%
- By 2075
- 4,668,459 · +99.8%
- By 2100
- 5,533,242 · +136.8%
Race, ethnicity, and origin ACS 2023
- Neighborhood character
- Diverse neighborhood (Simpson 0.64)
- Race & ethnicity
- Hispanic / Latino 53% Two or more races 26% White 25% Black 14% Asian 3% Native American 2%
- Hispanic origin (detail)
- Mexican 41% Puerto Rican 3%
- Common ancestry
- Serbian 2% Italian 1% Romanian 1%
- Foreign-born
- 18% · Canada, Vietnam, China
- Languages at home
- 60% English-only · Spanish 34% Vietnamese 1% Other Asian/Pacific 1%
Political lean MEDSL · Bexar
- 2024 margin
- Lean D (+9.8) · D 54.3% · R 44.6% · Other 1.1%
- 2008→2024 swing
- +4.2pp toward D · 2008: 5.6pp · 2024: 9.8pp
- All cycles
- 2024: D+9.8 2020: D+18.2 2016: D+13.5 2012: D+4.6 2008: D+5.6
Not yet ingested
- Civics
- —
Market trends
- HPI YoY
- ▼ -52.17%
- Current HPI
- 271.2807
- Rent YoY
- ▼ -5.56%
- Metro
- San Antonio-New Braunfels, TX
- State GDP YoY
- ▲ 3.95%
- F500 in state
- 110
Industry mix (Fortune 500 HQ in TX)
| Industry | F500 HQs | Revenue |
|---|---|---|
| Energy | 16 | $1,198B |
|
||
| Technology | 5 | $198B |
|
||
| Engineering / Construction | 4 | $72B |
|
||
| Energy Services | 3 | $60B |
|
||
| Utilities | 3 | $41B |
|
||
| Healthcare | 2 | $330B |
|
||
Price history
+8.6% since first listed22 events — show timeline
- 2026-02-19 Price Changed $190,000 LERA
- 2025-10-13 Listed $200,000 LERA
- 2023-09-13 Sold (Public Records) — Public Records
- 2023-09-07 Listing Removed — LERA
- 2023-08-10 Price Changed $225,000 LERA
- 2023-06-01 Listed $239,500 LERA
- 2023-04-05 Sold (Public Records) — Public Records
- 2022-07-28 Listing Removed — LERA
- 2022-07-06 Price Changed $202,000 LERA
- 2022-05-27 Price Changed $210,000 LERA
- 2022-04-30 Relisted — LERA
- 2022-04-28 Contingent — LERA
- 2022-04-21 Listed $221,000 LERA
- 2018-12-28 Sold (MLS) — LERA
- 2018-12-28 Sold (Public Records) — Public Records
- 2018-12-04 Contingent — LERA
- 2018-10-17 Price Changed $165,000 LERA
- 2018-10-05 Price Changed $175,000 LERA
- 2018-09-11 Listed $185,950 LERA
- 2018-08-29 Listing Removed — LERA
- 2018-08-23 Listed $175,000 LERA
- 2018-08-23 Sold (Public Records) — Public Records
Property tax history
+6.4%/yrLatest (2025): $5,673 · -8.3% YoY. Source: county tax records.
Cash-flow waterfall
monthlySold comps — $/sqft
last 12 mo · ≤1 miLoading sold comps…