 Duplex
120-22 59th St · Birmingham, AL
Flood risk No data
- FEMA flood zone
- —
- Chance of flooding over 30 yrs
- —
- Est. flood insurance / yr
- —
Fire risk No data
- Est. fire insurance / yr
- —
Heat risk No data
- Hot days now (above threshold)
- —
- Hot days in 30 yrs
- —
Wind risk No data
- Chance of severe wind over 30 yrs
- —
Air-quality risk No data
- Unhealthy air days now
- —
- Unhealthy air days in 30 yrs
- —
Risk factors via First Street. Map © Google.
Why this score? — see what drove the B- grade
The composite is a weighted blend of 9 inputs, each scored 0–100. Each bar is that input's sub-score; the figure is the points it added to the 100-point composite (weight × sub-score).
- Cash flow +30.0/30.0
- 1% rule +10.0/10.0
- DSCR +10.0/10.0
- ARV discount +7.5/15.0
- Livability +3.4/5.0
- Rent growth +2.5/5.0
- Condition / age +2.5/5.0
- Schools +0.9/10.0
- Appreciation +0.0/10.0
$97,000
🖨 Deal sheet (PDF) 📄 Offer letter ✓ Due diligence
Multi-family units
County records classify this as Multi-Family (2-4 Unit). Listing-text estimate: 2 units. confirmed
Listing remarks
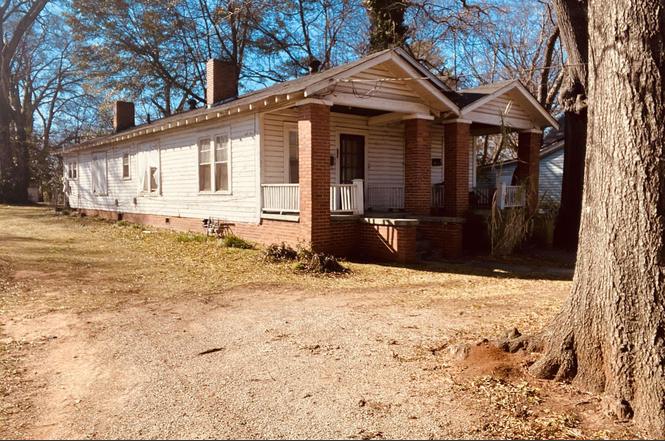
For Sale: 2-Bedroom Duplex in Prime Location – Fixer-Upper Opportunity! This 2-bedroom, 1-bathroom duplex is a diamond in the rough for the right buyer. Located in a highly sought-after neighborhood, this property offers great potential but requires major repairs and renovations. Perfect for investors, flippers, or buyers looking to create their dream home from the ground up. 120 has been torn down, use this space to custom build one more "door" to your portfolio. Key Features: Prime Location – Close to the heart of the city, great breweries, bars, and coffee shops. Spacious Layout – 2 units with separate entrances. Endless Potential – Ideal for rental in
Key facts
- Endless potential
- Spacious layout
- Built 1930
Tags
Neighborhood map
What this means for you Summary
Snapshot
- This is a 2 × 2-bed/1.0-bath units multifamily listed at $97k.
Deal economics
- At list price, monthly cash flow is $895 ($11k/yr) — positive. Per door: $447/mo.
- The deal already cash-flows at list — no discount required.
- Meets the 1% rule at list price ($2k rent vs $97k).
- Cap rate 17.4% vs local median 6.2% in Birmingham — top-decile yield for the area; either an underpriced asset or a hidden risk that comps aren't pricing in. Stress-test before assuming the spread holds.
Location & tenants
- Location reads 67/100 on livability (#78 in AL) — a middle-class / working-renter tenant base. Strengths: commute A+, cost of living A+, housing A+; Watch: amenities C-, crime F, employment F.
- Birmingham City (urban): math 4% / reading 20% proficiency, ranked #116 of 129 in AL (top 90%) — low school quality limits family demand, transient renter base, plan for 1-2y turnover; 82% free/reduced lunch — lower-income household profile, screen leases tightly.
- Zoned schools: Hayes K8 (math 0% / reading 12%, grade F, #616 of 627 statewide, top 98%, 658 students, 91% FRL); Woodlawn High Schoolmagnet (math 2% / reading 2%, grade F, #291 of 305 statewide, top 100%, 738 students, 91% FRL).
- Market conditions: 79 active listings in the ZIP; 16 comparable units currently listed for rent nearby; rentals at typical pace (median 18d on market — plan ~3-4 weeks tenant-placement turnaround); lower-income renter base — watch delinquency; 2,114 units permitted in Jefferson County in 2024 (556 in 5+ unit buildings).
- At $1,981/mo this rent would consume 65% of the median local household income ($37k/yr) (locally 798% of renters already pay >50% of income on rent) — very limited rent-growth headroom before tenants either downsize or default.
Forward outlook
- Local home prices are declining (-3.0%/yr); year-one equity from $671 of loan paydown is wiped out by about $3k of value loss. Plan a longer hold.
- Jefferson County population projected to shrink 4% by 2050 — rents likely to lag national; underwrite the cash flow, not the appreciation.
- At projected returns (-3.0% appreciation + 3.0% rent growth), your $27k cash investment doubles in ~3 years — after that, you're playing with house money.
Negotiation context
- Only 7 days on market — expect competitive offers; lowballing is unlikely to land.
Risks & watch-outs
- Watch-outs: built in 1930 — expect roof / HVAC / electrical / plumbing capex.
Questions for the listing agent
- Can we see the unit-by-unit rent roll, current vacancy, and any below-market leases? What's the average tenancy length?
- What capital expenditures (roof, boiler, parking lot, exteriors) have been made in the last 5 years, and what's planned in the next 2?
- Built in 1930 — when were the roof, HVAC, electrical panel, plumbing, and water heater last replaced?
- Is there a deadline driving the sale (1031 exchange, divorce, estate, relocation)? That informs how much negotiation room exists.
- Schools are F-rated, which usually means shorter tenancies and higher turnover. Who's the typical renter profile here, and what's been the actual vacancy rate?
- Crime grade is F in this area — have there been break-ins, vandalism, or insurance claims at this property in the last 3 years? What carrier currently insures it and at what premium?
- What's the average days-on-market for RENTAL listings here right now (not sales)? A rising rental-DOM trend means longer vacancies and softer asking-rent achievability than the comps imply.
- What's the recent tenant-quality profile in this submarket — average credit score on applications, eviction rate, late-payment / NSF rate, and stable-employment percentage? A property-management company in the area should have these aggregated.
- How much new apartment / multifamily construction is in the pipeline within 1–3 miles? Heavy new supply (>2% of stock underway) typically softens rents 12–24 months out; light construction supports rent growth.
Investment metrics
- 1% rule
- 2.04% ✓
- Cap rate
- 17.36%
- Cash-on-cash
- 39.53%
- DSCR
- 2.76
- GRM
- 4.1
CMA / ARV
No comps found within radius.
Projected returns pro-forma
-3.0% appreciation · 3.0% rent growth · sell at horizon
- IRR
- 35.8%
- Equity multiple
- 2.52×
- Total profit
- $41,292
- Equity at exit
- $14,463
- IRR
- 42.6%
- Equity multiple
- 5.03×
- Total profit
- $109,449
- Equity at exit
- $8,387
Cash invested: $27,160 (down + closing). Projections, not guarantees.
Landlord ↔ Tenant lean methodology
- Overall (STATE)
- 90 Strongly Landlord-Friendly
- State Alabama
- 90 Strongly Landlord-Friendly · R+15
- County
- — inherits STATE
- City
- — inherits STATE
ZIP-level market 35212
- Active inventory
- 79
- Price-to-rent
- 8.2×
Monthly cashflow live
- Estimated rent
- $1,981 high interval (Pro) →
- Mortgage (P&I)
- −$509
- Tax est. 1.5%
- −$121 /mo · $1,455/yr
- Insurance
- −$40
- HOA
- −$0
- Vacancy / Maint / Mgmt
- −$416
- Net cashflow
- $895
Break-even live
Sensitivity live
| Price | -10% $962 | -5% $928 | +0% $895 | +5% $861 | +10% $828 |
|---|---|---|---|---|---|
| Rent | -10% $738 | -5% $816 | +0% $895 | +5% $973 | +10% $1,051 |
| Rate | -1.0pp $943 | -0.5pp $919 | base $895 | +0.5pp $870 | +1.0pp $844 |
2-unit breakdown (identical units grouped — click to expand)
| Units | Beds | Baths | Est. rent |
|---|---|---|---|
| 2× units | 2 | 1 | $1,980 |
| #1 | 2 | 1 | $990 |
| #2 | 2 | 1 | $990 |
| Total (2 units) | $1,981 | ||
UW: 25.0% down · 7.5% · 30yr · 1.5% tax · 5.0% vac · 8.0% maint · 8.0% mgmt
Financing live
Cash to close
- Down payment
- $24,250
- Closing costs
- $2,910
- Reserves months
- —
- Total cash needed
- —
Loan-product check · same deal, 3 products live
Conventional
25% down · 7.5% · 30yr
- Down + closing
- —
- Monthly P&I
- —
- Monthly cashflow
- —
- DSCR
- —
- Eligible?
- —
Personal DTI + credit; lowest rate.
DSCR
20% down · 8.5% · 30yr
- Down + closing
- —
- Monthly P&I
- —
- Monthly cashflow
- —
- DSCR
- —
- Eligible?
- —
No personal income docs; deal must DSCR.
Hard money
10% down · 12.0% · 12mo
- Down + closing
- —
- Monthly P&I
- —
- Monthly cashflow
- —
- DSCR
- —
- Eligible?
- —
Short-term bridge; refi at stabilization.
Rent comps 16 comps
| Address | Beds | Baths | Sqft | Rent | $/sqft | DOM | Units | Dist |
|---|---|---|---|---|---|---|---|---|
| 6309 3rd Ave S Birmingham, AL | 4.0 | 2.0 | 1228 | $1,495 | $1.22 | 3d | 1 | 0.41mi |
| 5620 8th Ave S Birmingham, AL | 3.0 | 1.0 | 1508 | $2,400 | $1.59 | 13d | 1 | 0.66mi |
| 620 52nd St S Birmingham, AL | 3.0 | 2.0 | 1346 | $2,750 | $2.04 | 25d | 1 | 0.76mi |
| 821 50th St N Birmingham, AL | 3.0 | 1.5 | 1416 | $1,523 | $1.08 | 3d | 1 | 0.83mi |
| 601 Dublin Ave Birmingham, AL | 4.0 | 1.5 | 1288 | $1,050 | $0.82 | 45d | 1 | 0.89mi |
| 222 49th St N Birmingham, AL | 3.0 | 2.0 | 1556 | $1,800 | $1.16 | 25d | 1 | 0.95mi |
| 1601 48th St N Birmingham, AL | 3.0 | 1.0 | 1313 | $1,200 | $0.91 | 25d | 1 | 0.98mi |
| 236 48th St N Birmingham, AL | 3.0 | 2.0 | 1318 | $1,750 | $1.33 | 4d | 1 | 0.99mi |
| 6241 Crest Green Rd Birmingham, AL | 3.0 | 2.0 | 1380 | $1,210 | $0.88 | 25d | 1 | 1.01mi |
| 936 54th St S Birmingham, AL | 3.0 | 1.5 | 1317 | $1,950 | $1.48 | 4d | 1 | 1.02mi |
| 1101 47th St N Birmingham, AL | 3.0 | 2.0 | 1296 | $1,200 | $0.93 | 25d | 1 | 1.02mi |
| 1304 46th St N Birmingham, AL | 3.0 | 1.0 | 1683 | $670 | $0.40 | 17d | 1 | 1.18mi |
| 7129 3rd Ave S Birmingham, AL | 3.0 | 2.0 | 1264 | $1,095 | $0.87 | 4d | 1 | 1.28mi |
| 7125 6th Ave S Birmingham, AL | 3.0 | 2.0 | 1584 | $1,188 | $0.75 | 4d | 1 | 1.34mi |
| 1316 Southhall Rd Birmingham, AL | 3.0 | 2.0 | 2044 | $2,300 | $1.13 | 45d | 1 | 1.39mi |
| 7330 1st Ave S Birmingham, AL | 3.0 | 1.0 | 1299 | $1,000 | $0.77 | 3d | 1 | 1.44mi |
Listing history 2 events
-
2026-02-06status Pending
-
2026-01-29$97,000 Active
ⓘ Source: listings_history table (triggers on properties + properties_extension) + one-shot
backfill from property_details.listing_events for pre-trigger history.
Nearby sold comps map
Loading sold comps map…
Walkable amenities ~0.75 mi
Loading nearby amenities…
Taxation est. · year 1
- Rental income
- $23,772
- − Mortgage interest
- −$5,434
- − Property taxes
- −$1,455
- − Insurance
- −$485
- − Repairs & maintenance
- −$1,902
- − Management
- −$1,902
- − Depreciation
- −$2,822
- Taxable income
- $9,773
- Est. tax owed @ 24.0%
- −$2,346
- After-tax cash flow
- $8,390/yr
For passive investors: Depreciation is non-cash, so a rental often shows a tax loss while cash-flowing — sheltering income. Rental losses are passive: they offset passive income freely, and up to $25,000/yr can offset ordinary (W-2) income if you actively participate and your MAGI is under $100k (phasing out to $0 by $150k); unused losses carry forward. On sale, claimed depreciation is recaptured at up to 25%, and gains may owe capital-gains tax (a 1031 exchange can defer both). Figures are a year-1 estimate at your 24.0% rate — not tax advice; consult a CPA.
Schools (NCES district)
- District
- Birmingham City
- NCES district ID
- 0100390
- Math proficiency
- 4% ▼ -17.00%
- Reading proficiency
- 20% ▼ -4.00%
- Median HH income
- $31,988
- Composite
- 9.49/100
- National rank
- #9850
- State rank
- #116 of 129 in AL
Livability — Birmingham
- Score
- 67/100
- State rank
- #78
- US rank
- #10412
Category grades
Schools grade is shown separately in the Schools card above.
Census & demographics
- Census place
- Birmingham, AL
- County
- Jefferson County · 527,445 people
- City population
- 210,422
- Metro
- Birmingham-Hoover, AL
- Population (ZIP)
- 10,160
- Household income
- $36,633
- Rent vs Own
- Severe rent burden
- 798.0
Population outlook (Jefferson County) Hauer SSP2
- Today (2025)
- 669,185 people
- By 2030
- 669,694 · +0.1%
- By 2040
- 661,388 · -1.2%
- By 2050
- 643,086 · -3.9%
- By 2075
- 577,267 · -13.7%
- By 2100
- 474,758 · -29.1%
Race, ethnicity, and origin ACS 2023
- Neighborhood character
- Predominantly Black (68%)
- Race & ethnicity
- Black 68% White 24% Hispanic / Latino 6% Two or more races 3% Asian 1%
- Hispanic origin (detail)
- Mexican 3%
- Common ancestry
- Italian 2% Slovak 2% Hispanic 1%
- Foreign-born
- 3% · Canada
- Languages at home
- 95% English-only · Spanish 3% French/Haitian/Cajun 1%
Political lean MEDSL · Jefferson
- 2024 margin
- D (+10.4) · D 54.6% · R 44.2% · Other 1.2%
- 2008→2024 swing
- +5.4pp toward D · 2008: 5.1pp · 2024: 10.4pp
- All cycles
- 2024: D+10.4 2020: D+13.2 2016: D+7.2 2012: D+6.0 2008: D+5.1
Not yet ingested
- Civics
- —
Market trends
- HPI YoY
- ▼ -190.24%
- Current HPI
- 120.1264
- Rent YoY
- —
- Metro
- Birmingham-Hoover, AL
- State GDP YoY
- ▲ 2.94%
- F500 in state
- 4
Industry mix (Fortune 500 HQ in AL)
| Industry | F500 HQs | Revenue |
|---|---|---|
| Financial Services | 1 | $8B |
|
||
| Healthcare | 1 | $5B |
|
||
Price history
2 events — show timeline
- 2026-02-06 Pending — Greater Alabama MLS
- 2026-01-29 Listed $97,000 Greater Alabama MLS
Cash-flow waterfall
monthlySold comps — $/sqft
last 12 mo · ≤1 miLoading sold comps…