 🏗️ New Construction
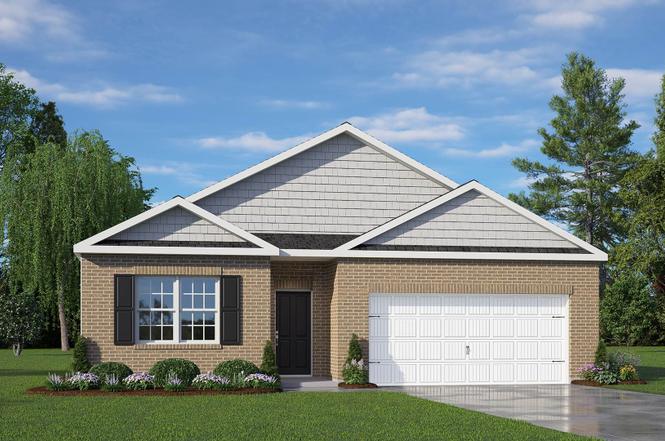
CALI Plan · Mocksville, NC
Flood risk No data
- FEMA flood zone
- —
- Chance of flooding over 30 yrs
- —
- Est. flood insurance / yr
- —
Fire risk No data
- Est. fire insurance / yr
- —
Heat risk No data
- Hot days now (above threshold)
- —
- Hot days in 30 yrs
- —
Wind risk No data
- Chance of severe wind over 30 yrs
- —
Air-quality risk No data
- Unhealthy air days now
- —
- Unhealthy air days in 30 yrs
- —
Risk factors via First Street. Map © Google.
Why this score? — see what drove the D grade
The composite is a weighted blend of 9 inputs, each scored 0–100. Each bar is that input's sub-score; the figure is the points it added to the 100-point composite (weight × sub-score).
- Cash flow +12.3/30.0
- ARV discount +7.5/15.0
- Schools +4.4/10.0
- Livability +3.7/5.0
- DSCR +3.6/10.0
- 1% rule +3.5/10.0
- Rent growth +2.5/5.0
- Condition / age +2.5/5.0
- Appreciation +0.0/10.0
$300,990
🖨 Deal sheet (PDF) 📄 Offer letter ✓ Due diligence
Key facts
- Open concept living
- Large island
- Breakfast bar
Tags
Property features AI
Finance
- Financial info: List price $300,990
Exterior
- Home design: Single-family plan; Located in Mocksville, NC
- Exterior features: Living area approximately 1764
Interior
- Bedrooms: 4 bedrooms
- Bathrooms: 2 bathrooms (full)
- Interior features: Plan CALI (new construction plan)
Neighborhood map
What this means for you Summary
Snapshot
- This is a 4-bed/2.0-bath single-family listed at $301k.
Deal economics
- At list price, monthly cash flow is $-56 ($-674/yr) — negative.
- To cash-flow at today's rent, offer at most $295k (1.9% below list).
- To meet the 1% rule (rent ≥ 1% of price), the offer needs to be $258k (14.2% below list).
- Recommended offer: $258k (14.2% below list) — sets the bar for 1% rule.
- Cap rate 6.1% vs local median 4.0% in Mocksville — top-decile yield for the area; either an underpriced asset or a hidden risk that comps aren't pricing in. Stress-test before assuming the spread holds.
Location & tenants
- Location reads 73/100 on livability (#68 in NC) — a middle-class / working-renter tenant base. Strengths: cost of living A+, housing A+, health & safety A+; Watch: crime C-, employment D, amenities F.
- Davie County Schools (rural): math 51% / reading 52% proficiency, ranked #57 of 178 in NC (top 32%) — acceptable for families but not a draw, mixed tenant base, ~2y average lease.
- Zoned schools: Cornatzer Elementary (math 57% / reading 52%, grade C, #302 of 1,410 statewide, top 23%, 350 students, 58% FRL); William Ellis Middle (math 48% / reading 59%, grade C+, #87 of 475 statewide, top 19%, 452 students, 31% FRL); Davie County High (math 62% / reading 62%, grade B-, #184 of 535 statewide, top 37%, 1,770 students, 42% FRL).
- Market conditions: 221 active listings in the ZIP; 2 comparable units currently listed for rent nearby; 250 units permitted in Davie County in 2024 (65 in 5+ unit buildings).
- This rent runs 45% of the median local income ($69k/yr) — at the standard rent-burdened threshold; future hikes will face affordability resistance.
Forward outlook
- Local home prices are declining (-3.0%/yr); year-one equity from $2k of loan paydown is wiped out by about $9k of value loss. Plan a longer hold.
- Davie County population projected to shrink 5% by 2050 — rents likely to lag national; underwrite the cash flow, not the appreciation.
Negotiation context
- It's been on market 396 days — a 12% lower offer ($265k) is reasonable based on typical stale-listing flexibility.
Questions for the listing agent
- What do current leases actually rent for vs. the listed asking? Can we see a recent rent roll and the last 12 months of T-12 income?
- It's been on market 396 days. Have you received any prior offers? Is the seller open to a 14% concession, seller financing, or rate buy-down credit?
- Why hasn't it sold? Are there any deal-killer items the seller is aware of (foundation, flood, title, zoning, code violations)?
- Is there a deadline driving the sale (1031 exchange, divorce, estate, relocation)? That informs how much negotiation room exists.
- Schools are D-rated, which usually means shorter tenancies and higher turnover. Who's the typical renter profile here, and what's been the actual vacancy rate?
- The area grade is low — what's the realistic commute time and amenity access for the typical tenant pool here? Any planned neighborhood developments (good or bad) we should know about?
- What's the average days-on-market for RENTAL listings here right now (not sales)? A rising rental-DOM trend means longer vacancies and softer asking-rent achievability than the comps imply.
- What's the recent tenant-quality profile in this submarket — average credit score on applications, eviction rate, late-payment / NSF rate, and stable-employment percentage? A property-management company in the area should have these aggregated.
- How much new for-sale + rental construction is in the pipeline within 1–3 miles? Heavy new supply typically softens prices + rents 12–24 months out; constrained supply supports both.
Investment metrics
- 1% rule
- 0.85% ✗
- Cap rate
- 6.07%
- Cash-on-cash
- -0.79%
- DSCR
- 0.96
- GRM
- 9.8
CMA / ARV
- ARV (on-the-fly)
- $303,408
- Comps found
- 12
Show comp detail 12 sales within ~0.75 mi
| Address | Dist | Beds/Ba | Sqft | Sold | Price | $/sf | Match |
|---|---|---|---|---|---|---|---|
| 107 Big Laurel Dr | 0.00mi | 4/2.0 | 1,764 (0%) | 1mo | $295,000 | $167 | 99 |
| 177 Big Laurel Dr | 0.09mi | 4/2.0 | 1,764 (0%) | 8mo | $304,000 | $172 | 89 |
| 172 Big Laurel Dr | 0.11mi | 4/2.0 | 1,764 (0%) | 9mo | $299,000 | $170 | 88 |
| 180 Big Laurel Dr | 0.13mi | 4/2.0 | 1,764 (0%) | 8mo | $310,115 | $176 | 87 |
| 186 Big Laurel Dr | 0.22mi | 4/2.0 | 1,764 (0%) | 7mo | $299,990 | $170 | 84 |
| 193 Big Laurel Dr | 0.24mi | 4/2.0 | 1,764 (0%) | 6mo | $306,990 | $174 | 83 |
| 173 Big Laurel Dr | 0.12mi | 4/2.5 | 1,991 (+13%) | 7mo | $295,000 | $148 | 65 |
| 149 Elberon Ct | 0.51mi | 4/2.0 | 1,835 (+4%) | 6mo | $410,000 | $223 | 65 |
| 166 Chessie Rd | 0.14mi | 4/2.5 | 1,991 (+13%) | 7mo | $290,000 | $146 | 64 |
| 185 Big Laurel Dr | 0.21mi | 4/2.5 | 1,991 (+13%) | 7mo | $290,000 | $146 | 61 |
| 577 John Crotts Rd | 0.71mi | 3/2.0 (-1) | 1,569 (-11%) | 3mo | $315,000 | $201 | 41 |
| 109 Marbrook Dr | 0.66mi | 3/2.5 (-1) | 2,028 (+15%) | 1mo | $393,000 | $194 | 36 |
Match score weights: distance 35% · size 25% · config 20% · recency 20%. Top-matched comps best support the ARV.
Projected returns pro-forma
-3.0% appreciation · 3.0% rent growth · sell at horizon
- IRR
- -17.6%
- Equity multiple
- 0.38×
- Total profit
- $-52,702
- Equity at exit
- $45,239
- IRR
- -9.6%
- Equity multiple
- 0.41×
- Total profit
- $-50,338
- Equity at exit
- $26,233
Cash invested: $84,954 (down + closing). Projections, not guarantees.
Landlord ↔ Tenant lean methodology
- Overall (STATE)
- 85 Strongly Landlord-Friendly
- State North Carolina
- 85 Strongly Landlord-Friendly · R+3
- County
- — inherits STATE
- City
- — inherits STATE
ZIP-level market 27028
- Home prices YoY
- -23.8%
- Active inventory
- 221
- Price-to-rent
- 9.7×
Monthly cashflow live
- Estimated rent
- $2,583 medium interval (Pro) →
- Mortgage (P&I)
- −$1,591
- Tax est. 1.5%
- −$379 /mo · $4,551/yr
- Insurance
- −$126
- HOA
- −$0
- Vacancy / Maint / Mgmt
- −$542
- Net cashflow
- $-56
Break-even live
Sensitivity live
| Price | -10% $154 | -5% $49 | +0% $-56 | +5% $-161 | +10% $-266 |
|---|---|---|---|---|---|
| Rent | -10% $-260 | -5% $-158 | +0% $-56 | +5% $46 | +10% $148 |
| Rate | -1.0pp $97 | -0.5pp $21 | base $-56 | +0.5pp $-135 | +1.0pp $-215 |
UW: 25.0% down · 7.5% · 30yr · 1.5% tax · 5.0% vac · 8.0% maint · 8.0% mgmt
Financing live
Cash to close
- Down payment
- $75,852
- Closing costs
- $9,102
- Reserves months
- —
- Total cash needed
- —
Loan-product check · same deal, 3 products live
Conventional
25% down · 7.5% · 30yr
- Down + closing
- —
- Monthly P&I
- —
- Monthly cashflow
- —
- DSCR
- —
- Eligible?
- —
Personal DTI + credit; lowest rate.
DSCR
20% down · 8.5% · 30yr
- Down + closing
- —
- Monthly P&I
- —
- Monthly cashflow
- —
- DSCR
- —
- Eligible?
- —
No personal income docs; deal must DSCR.
Hard money
10% down · 12.0% · 12mo
- Down + closing
- —
- Monthly P&I
- —
- Monthly cashflow
- —
- DSCR
- —
- Eligible?
- —
Short-term bridge; refi at stabilization.
Rent comps 2 comps
| Address | Beds | Baths | Sqft | Rent | $/sqft | DOM | Units | Dist |
|---|---|---|---|---|---|---|---|---|
| 119 W Carmel Cove Dr Mocksville, NC | 4.0 | 3.0 | 2405 | $2,350 | $0.98 | 25d | 1 | 1.37mi |
| 204 Spring St Mocksville, NC | 3.0 | 2.0 | 1405 | $1,750 | $1.25 | 25d | 1 | 1.49mi |
Listing history 15 events
-
2026-06-22days on market $300,990 Active 396 DOM
-
2026-06-18days on market $300,990 Active 393 DOM
-
2026-06-17days on market $300,990 Active 392 DOM
-
2026-06-16days on market $300,990 Active 391 DOM
-
2026-06-15days on market $300,990 Active 390 DOM
-
2026-06-14days on market $300,990 Active 388 DOM
-
2026-06-10days on market $300,990 Active 385 DOM
-
2026-06-09days on market $300,990 Active 384 DOM
-
2026-06-08days on market $300,990 Active 383 DOM
-
2026-06-07days on market $300,990 Active 382 DOM
-
2026-06-03days on market $300,990 Active 378 DOM
-
2026-06-02days on market $300,990 Active 377 DOM
-
2026-06-01days on market $300,990 Active 376 DOM
-
2026-05-31days on market $300,990 Active 375 DOM
-
2026-05-31days on market $300,990 Active 374 DOM
ⓘ Source: listings_history table (triggers on properties + properties_extension) + one-shot
backfill from property_details.listing_events for pre-trigger history.
Nearby sold comps map
Loading sold comps map…
Walkable amenities ~0.75 mi
Loading nearby amenities…
Taxation est. · year 1
- Rental income
- $30,997
- − Mortgage interest
- −$16,996
- − Property taxes
- −$4,551
- − Insurance
- −$1,517
- − Repairs & maintenance
- −$2,480
- − Management
- −$2,480
- − Depreciation
- −$8,826
- Taxable loss
- −$5,853
- Est. tax savings @ 24.0%
- +$1,405
- After-tax cash flow
- $731/yr
For passive investors: Depreciation is non-cash, so a rental often shows a tax loss while cash-flowing — sheltering income. Rental losses are passive: they offset passive income freely, and up to $25,000/yr can offset ordinary (W-2) income if you actively participate and your MAGI is under $100k (phasing out to $0 by $150k); unused losses carry forward. On sale, claimed depreciation is recaptured at up to 25%, and gains may owe capital-gains tax (a 1031 exchange can defer both). Figures are a year-1 estimate at your 24.0% rate — not tax advice; consult a CPA.
Schools (NCES district)
- District
- Davie County Schools
- NCES district ID
- 3701170
- Math proficiency
- 51% ▲ 2.00%
- Reading proficiency
- 52% ▲ 2.00%
- Median HH income
- $51,331
- Composite
- 44.16/100
- National rank
- #2860
- State rank
- #57 of 178 in NC
Livability — Mocksville
- Score
- 73/100
- State rank
- #68
- US rank
- #5153
Category grades
Schools grade is shown separately in the Schools card above.
Census & demographics
- County
- Davie County · 42,813 people
- City population
- 26,566
- Metro
- Winston-Salem, NC
- Population (ZIP)
- 26,566
- Household income
- $69,137
- Rent vs Own
- Severe rent burden
- 512.0
Population outlook (Davie County) Hauer SSP2
- Today (2025)
- 42,613 people
- By 2030
- 42,691 · +0.2%
- By 2040
- 42,137 · -1.1%
- By 2050
- 40,445 · -5.1%
- By 2075
- 35,939 · -15.7%
- By 2100
- 29,103 · -31.7%
Race, ethnicity, and origin ACS 2023
- Neighborhood character
- Predominantly White (79%)
- Race & ethnicity
- White 79% Hispanic / Latino 11% Two or more races 11% Black 4%
- Hispanic origin (detail)
- Mexican 9%
- Common ancestry
- Slovak 4% Italian 2% Serbian 2%
- Foreign-born
- 5% · Canada
- Languages at home
- 89% English-only · Spanish 9% German/W. Germanic 1%
Political lean MEDSL · Davie
- 2024 margin
- Solid R (+46.5) · D 26.2% · R 72.6% · Other 1.2%
- 2008→2024 swing
- -8.2pp toward R · 2008: -38.3pp · 2024: -46.5pp
- All cycles
- 2024: R+46.5 2020: R+45.5 2016: R+48.1 2012: R+43.7 2008: R+38.3
Not yet ingested
- Civics
- —
Market trends
- HPI YoY
- ▼ -59.58%
- Current HPI
- 191.2464
- Rent YoY
- —
- Metro
- Winston-Salem, NC
- State GDP YoY
- ▲ 3.28%
- F500 in state
- 26
Industry mix (Fortune 500 HQ in NC)
| Industry | F500 HQs | Revenue |
|---|---|---|
| Financial Services | 2 | $213B |
|
||
| Retail | 2 | $95B |
|
||
| Industrial Conglomerate | 1 | $38B |
|
||
| Metals / Steel | 1 | $35B |
|
||
| Utilities | 1 | $30B |
|
||
| Industrial Machinery | 1 | $19B |
|
||
Cash-flow waterfall
monthlySold comps — $/sqft
last 12 mo · ≤1 miLoading sold comps…