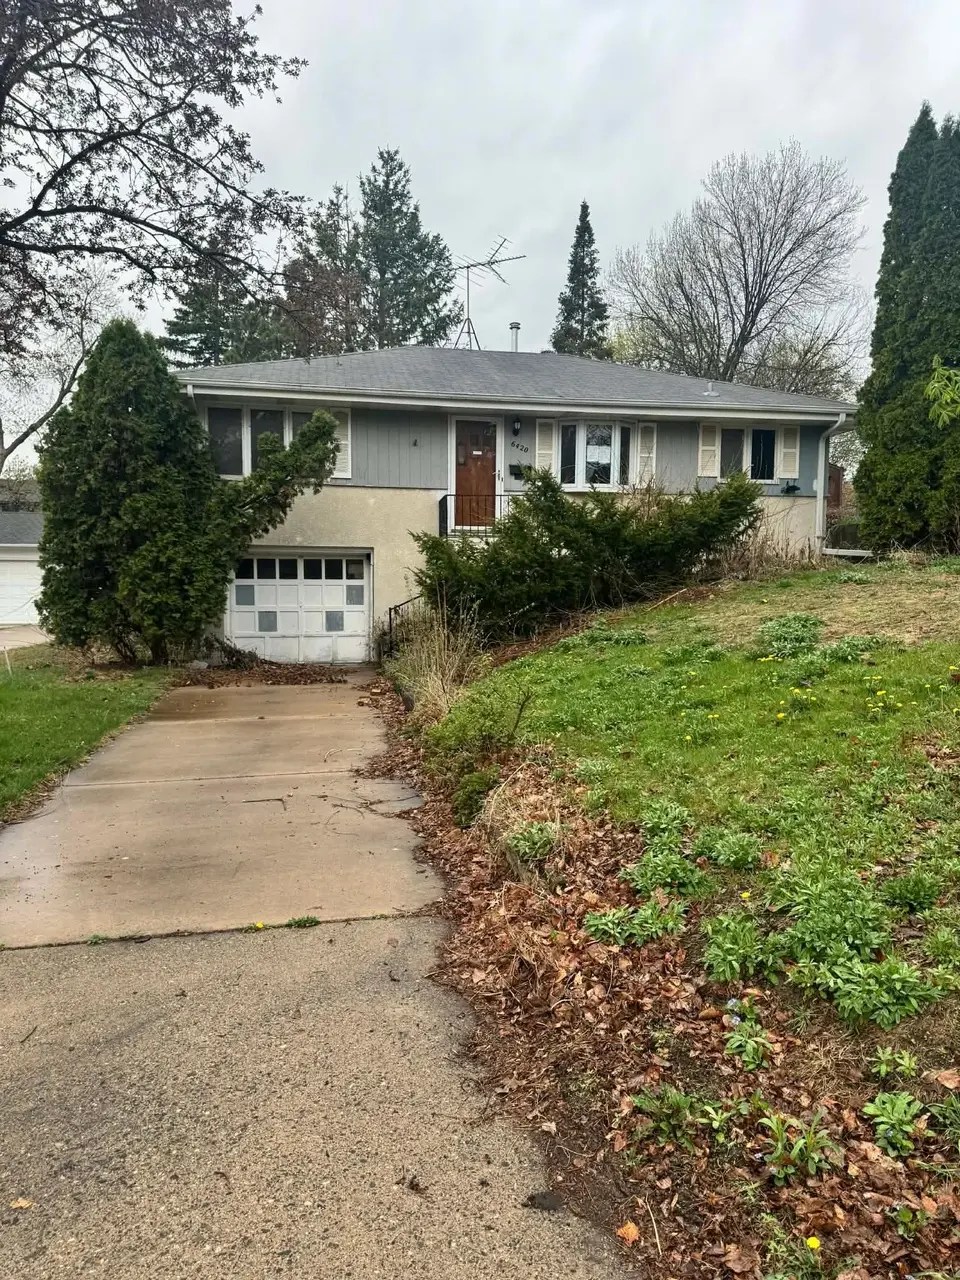
6420 Newton Ave S · Richfield, MN
Flood risk 1/10 · Minimal
- FEMA flood zone
- X (unshaded)
- Chance of flooding over 30 yrs
- 0.0%
- Est. flood insurance / yr
- $473 – $860
Fire risk 1/10 · Minimal
- Est. fire insurance / yr
- $888 – $1,650
Heat risk 2/10 · Minimal
- Hot days now (above 99°F)
- 7 days/yr
- Hot days in 30 yrs
- 14 days/yr
Wind risk 2/10 · Minimal
- Chance of severe wind over 30 yrs
- —
Air-quality risk 2/10 · Minimal
- Unhealthy air days now
- 1 days/yr
- Unhealthy air days in 30 yrs
- 1 days/yr
Risk factors via First Street. Map © Google.
Why this score? — see what drove the D+ grade
The composite is a weighted blend of 9 inputs, each scored 0–100. Each bar is that input's sub-score; the figure is the points it added to the 100-point composite (weight × sub-score).
- ARV discount +15.0/15.0
- Cash flow +13.6/30.0
- Livability +4.2/5.0
- DSCR +4.1/10.0
- 1% rule +3.9/10.0
- Rent growth +3.2/5.0
- Schools +2.9/10.0
- Condition / age +2.5/5.0
- Appreciation +0.0/10.0
$258,000
🖨 Deal sheet (PDF) 📄 Offer letter ✓ Due diligence
Listing remarks
Charming home in a prime Richfield location! This well-positioned property offers a great opportunity for homeowners and investors alike. Featuring a functional layout, spacious living areas, and plenty of natural light throughout. The home sits on a desirable lot with room to enjoy the outdoors, entertain, or add future value. Conveniently located near parks, shopping, restaurants, and major highways, making commuting to Minneapolis and surrounding areas quick and easy. Whether you’re looking to move in, update, or invest, this property offers solid potential in a high-demand area. Don’t miss your chance to own in one of Richfield’s most convenient neighborhoods—sch
Key facts
- Functional layout
- Desirable lot
- 8,276 sq ft lot
Tags
Property features AI
Finance
- Financial info: Mortgage type: Other
Exterior
- Parking: Tuck-under garage with 1 garage space
- Utilities: City water (in street); City sewer (in street); Natural gas
- Home design: Residential property; One level (with lower level/basement)
- Construction: Concrete construction materials; Asphalt roof; Foundation area noted
- Exterior features: Stucco exterior; Chain link fencing; Light tree coverage on lot; Lot dimensions approximately 135 x 65 x 135 x 65
Interior
- Kitchen: Dishwasher; Range; Refrigerator
- Bedrooms: 3 bedrooms (two on main level, one in lower level)
- Bathrooms: 1 full bathroom; 1 half bathroom
- Heating & cooling: Forced air heating; Central air conditioning
- Interior features: Partially finished basement; Living/Dining room configuration
- Laundry & utility: Laundry in basement
Neighborhood map
What this means for you Summary
Snapshot
- This is a 4-bed/1.0-bath single-family listed at $258k.
Deal economics
- At list price, monthly cash flow is $13 ($154/yr) — positive.
- The deal already cash-flows at list — no discount required.
- To meet the 1% rule (rent ≥ 1% of price), the offer needs to be $230k (10.7% below list).
- Recommended offer: $230k (10.7% below list) — sets the bar for 1% rule.
- Cap rate 6.4% vs local median 3.6% in Richfield — top-decile yield for the area; either an underpriced asset or a hidden risk that comps aren't pricing in. Stress-test before assuming the spread holds.
Location & tenants
- Location reads 85/100 on livability (#22 in MN, #599 nationally) — a professional / high-income tenant draw. Strengths: commute A+, housing A+, employment A; Watch: crime C-.
- Richfield Public School District (suburban): math 27% / reading 38% proficiency, ranked #262 of 301 in MN (top 87%) — families likely to look elsewhere, expect single-tenant / working-renter base with shorter leases.
- Market conditions: Rents rising (+2.7%/yr); 160 active listings in the ZIP; 12 comparable units currently listed for rent nearby; rentals at typical pace (median 16d on market — plan ~3-4 weeks tenant-placement turnaround); solid renter incomes; 4,651 units permitted in Hennepin County in 2024 (2,443 in 5+ unit buildings).
- This rent runs 32% of the median local income ($85k/yr) — at the standard rent-burdened threshold; future hikes will face affordability resistance.
Forward outlook
- Local home prices are declining (-3.0%/yr); year-one equity from $2k of loan paydown is wiped out by about $8k of value loss. Plan a longer hold.
- Hennepin County population projected at +30% by 2050 — long-run rental-demand tailwind backs the buy-and-hold thesis.
Negotiation context
- It's been on market 34 days — a 3% lower offer ($250k) is reasonable based on typical stale-listing flexibility.
- 2 sale attempts with the ask held roughly flat each time — persistent listings suggest the price (not the market) is what's stuck; bring a comps-based counter.
- Current owner paid $25k; list at $258k implies a 922% gain — meaningful room to come down on a strong offer.
Risks & watch-outs
- Watch-outs: built in 1954 — expect roof / HVAC / electrical / plumbing capex.
Questions for the listing agent
- It's been on market 34 days. Have you received any prior offers? Is the seller open to a 11% concession, seller financing, or rate buy-down credit?
- Built in 1954 — when were the roof, HVAC, electrical panel, plumbing, and water heater last replaced?
- Is there a deadline driving the sale (1031 exchange, divorce, estate, relocation)? That informs how much negotiation room exists.
- The area grade is low — what's the realistic commute time and amenity access for the typical tenant pool here? Any planned neighborhood developments (good or bad) we should know about?
- What's the average days-on-market for RENTAL listings here right now (not sales)? A rising rental-DOM trend means longer vacancies and softer asking-rent achievability than the comps imply.
- What's the recent tenant-quality profile in this submarket — average credit score on applications, eviction rate, late-payment / NSF rate, and stable-employment percentage? A property-management company in the area should have these aggregated.
- How much new for-sale + rental construction is in the pipeline within 1–3 miles? Heavy new supply typically softens prices + rents 12–24 months out; constrained supply supports both.
Investment metrics
- 1% rule
- 0.89% ✗
- Cap rate
- 6.35%
- Cash-on-cash
- 0.21%
- DSCR
- 1.01
- GRM
- 9.3
CMA / ARV
- ARV (median comp)
- $356,200
- List price
- $258,000
- Delta
- -27.57%
- Verdict
- UNDERPRICED
- Comps
- 7 within 1.0 mi
Projected returns pro-forma
-3.0% appreciation · 2.7% rent growth · sell at horizon
- IRR
- -16.3%
- Equity multiple
- 0.42×
- Total profit
- $-41,632
- Equity at exit
- $38,469
- IRR
- -8.5%
- Equity multiple
- 0.48×
- Total profit
- $-37,825
- Equity at exit
- $22,307
Cash invested: $72,240 (down + closing). Projections, not guarantees.
Landlord ↔ Tenant lean methodology
- Overall (STATE)
- 46 Balanced
- State Minnesota
- 46 Balanced · D+2
- County
- — inherits STATE
- City
- — inherits STATE
ZIP-level market 55423
- Rents YoY
- 2.7%
- Active inventory
- 160
- Price-to-rent
- 9.3×
Monthly cashflow live
- Estimated rent
- $2,304 high interval (Pro) →
- Mortgage (P&I)
- −$1,353
- Tax from tax record
- −$347 /mo · $4,161/yr
- Insurance
- −$108
- HOA
- −$0
- Vacancy / Maint / Mgmt
- −$484
- Net cashflow
- $13
Break-even live
Sensitivity live
| Price | -10% $159 | -5% $86 | +0% $13 | +5% $-60 | +10% $-133 |
|---|---|---|---|---|---|
| Rent | -10% $-169 | -5% $-78 | +0% $13 | +5% $104 | +10% $195 |
| Rate | -1.0pp $143 | -0.5pp $78 | base $13 | +0.5pp $-54 | +1.0pp $-122 |
UW: 25.0% down · 7.5% · 30yr · 1.5% tax · 5.0% vac · 8.0% maint · 8.0% mgmt
Financing live
Cash to close
- Down payment
- $64,500
- Closing costs
- $7,740
- Reserves months
- —
- Total cash needed
- —
Loan-product check · same deal, 3 products live
Conventional
25% down · 7.5% · 30yr
- Down + closing
- —
- Monthly P&I
- —
- Monthly cashflow
- —
- DSCR
- —
- Eligible?
- —
Personal DTI + credit; lowest rate.
DSCR
20% down · 8.5% · 30yr
- Down + closing
- —
- Monthly P&I
- —
- Monthly cashflow
- —
- DSCR
- —
- Eligible?
- —
No personal income docs; deal must DSCR.
Hard money
10% down · 12.0% · 12mo
- Down + closing
- —
- Monthly P&I
- —
- Monthly cashflow
- —
- DSCR
- —
- Eligible?
- —
Short-term bridge; refi at stabilization.
Rent comps 12 comps
| Address | Beds | Baths | Sqft | Rent | $/sqft | DOM | Units | Dist |
|---|---|---|---|---|---|---|---|---|
| 2702 W 66th St Minneapolis, MN | 3.0 | 2.0 | 1012 | $2,300 | $2.27 | 15d | 1 | 0.43mi |
| 6238 Thomas Ave S Minneapolis, MN | 4.0 | 2.0 | 1800 | $2,495 | $1.39 | 44d | 1 | 0.45mi |
| 6108 Thomas Ave S Minneapolis, MN | 4.0 | 1.0 | 1787 | $3,400 | $1.90 | 0d | 1 | 0.58mi |
| 6400 Barrie Rd Minneapolis, MN | 1.0–3.0 | 1.0–2.0 | 1015 | $2,580 | $2.54 | 3d | 13 | 0.84mi |
| 5848 Washburn Ave S Unit 5850 Minneapolis, MN | 3.0 | 1.0 | 1000 | $1,675 | $1.68 | 21d | 1 | 0.93mi |
| 5848 Washburn Ave S Unit 5848 Minneapolis, MN | 3.0 | 1.0 | 1000 | $1,795 | $1.79 | 44d | 1 | 0.93mi |
| 5846 Washburn Ave S Minneapolis, MN | 3.0 | 1.0 | 1500 | $1,850 | $1.23 | 4d | 1 | 0.94mi |
| 7201 York Ave S Minneapolis, MN | 1.0–3.0 | 1.0–3.0 | 1135 | $2,825 | $2.49 | 0d | 16 | 1.17mi |
| 7041 Garfield Ave Minneapolis, MN | 3.0 | 2.0 | 1159 | $2,236 | $1.93 | 3d | 1 | 1.22mi |
| 6050 Wentworth Ave Minneapolis, MN | 3.0 | 2.0 | 1500 | $2,195 | $1.46 | 25d | 1 | 1.31mi |
| 33 Wentworth Ct E Minneapolis, MN | 3.0 | 1.0–2.0 | 1250 | $1,921 | $1.54 | 0d | 1 | 1.34mi |
| 7241 Harriet Ave Minneapolis, MN | 3.0 | 2.0 | 1468 | $1,300 | $0.89 | 22d | 1 | 1.43mi |
Listing history 5 events
-
2026-05-07historical Contingent - Inspection 726-char remark
-
2026-04-28status Active 726-char remark
-
2026-04-27historical Contingent - Other 726-char remark
-
2026-04-24$258,000 Active 726-char remark
-
1970-03-01soldstatus $25,250
ⓘ Source: listings_history table (triggers on properties + properties_extension) + one-shot
backfill from property_details.listing_events for pre-trigger history.
Tax reassessment forecast MN · Partial reset (capped growth)
- Current annual tax
- $4,161 · $347/mo
- Projected year-2 tax
- $4,161 · $347/mo
- Expected delta
- $0/yr ($0/mo · 0.0%)
ⓘ Screening estimate from a state-policy table — verify with the county assessor before closing.
Climate risk First Street
- Flood 1/10 Low FEMA zone X (unshaded) · 0% chance over 30 yrs
- Wildfire 1/10 Low
- Heat 2/10 Low 7 d/yr ≥99°F today · 14 d/yr by 30 yrs out
- Wind 2/10 Low
- Air quality 2/10 Low 1 unhealthy d/yr today · 1 by 30 yrs out
Nearby sold comps map
Loading sold comps map…
Walkable amenities ~0.75 mi
Loading nearby amenities…
Taxation est. · year 1
- Rental income
- $27,647
- − Mortgage interest
- −$14,452
- − Property taxes
- −$4,161
- − Insurance
- −$1,290
- − Repairs & maintenance
- −$2,212
- − Management
- −$2,212
- − Depreciation
- −$7,505
- Taxable loss
- −$4,185
- Est. tax savings @ 24.0%
- +$1,004
- After-tax cash flow
- $1,159/yr
For passive investors: Depreciation is non-cash, so a rental often shows a tax loss while cash-flowing — sheltering income. Rental losses are passive: they offset passive income freely, and up to $25,000/yr can offset ordinary (W-2) income if you actively participate and your MAGI is under $100k (phasing out to $0 by $150k); unused losses carry forward. On sale, claimed depreciation is recaptured at up to 25%, and gains may owe capital-gains tax (a 1031 exchange can defer both). Figures are a year-1 estimate at your 24.0% rate — not tax advice; consult a CPA.
Schools (NCES district)
- District
- Richfield Public School District
- NCES district ID
- 2731750
- Math proficiency
- 27% ▼ -10.00%
- Reading proficiency
- 38% ▼ -6.00%
- Median HH income
- $53,367
- Composite
- 28.56/100
- National rank
- #6727
- State rank
- #262 of 301 in MN
Livability — Richfield
- Score
- 85/100
- State rank
- #22
- US rank
- #599
Category grades
Schools grade is shown separately in the Schools card above.
Census & demographics
- Census place
- Richfield, MN
- County
- Hennepin County · 1,150,272 people
- City population
- 36,724
- Metro
- Minneapolis-St. Paul-Bloomington, MN-WI
- Population (ZIP)
- 36,724
- Household income
- $85,182
- Rent vs Own
- Severe rent burden
- 1472.0
Population outlook (Hennepin County) Hauer SSP2
- Today (2025)
- 1,405,227 people
- By 2030
- 1,492,650 · +6.2%
- By 2040
- 1,660,157 · +18.1%
- By 2050
- 1,823,498 · +29.8%
- By 2075
- 2,221,283 · +58.1%
- By 2100
- 2,509,976 · +78.6%
Race, ethnicity, and origin ACS 2023
- Neighborhood character
- Diverse neighborhood (Simpson 0.58)
- Race & ethnicity
- White 61% Hispanic / Latino 18% Two or more races 10% Black 10% Asian 6%
- Hispanic origin (detail)
- Mexican 14%
- Common ancestry
- Portuguese 11% Romanian 4% Lithuanian 3%
- Foreign-born
- 17% · Canada, China, Vietnam
- Languages at home
- 76% English-only · Spanish 14% Other Asian/Pacific 2% Other Indo-European 2%
Political lean MEDSL · Hennepin
- 2024 margin
- Solid D (+42.6) · D 70.2% · R 27.5% · Other 2.3%
- 2008→2024 swing
- +14.0pp toward D · 2008: 28.6pp · 2024: 42.6pp
- All cycles
- 2024: D+42.6 2020: D+43.2 2016: D+35.3 2012: D+27.1 2008: D+28.6
Not yet ingested
- Civics
- —
Market trends
- HPI YoY
- ▼ -288.10%
- Current HPI
- 262.1432
- Rent YoY
- ▲ 2.70%
- Metro
- Minneapolis-St. Paul-Bloomington, MN-WI
- State GDP YoY
- ▲ 2.41%
- F500 in state
- 34
Industry mix (Fortune 500 HQ in MN)
| Industry | F500 HQs | Revenue |
|---|---|---|
| Healthcare | 2 | $407B |
|
||
| Retail | 2 | $150B |
|
||
| Consumer Goods | 2 | $32B |
|
||
| Industrial Machinery | 2 | $6B |
|
||
| Agriculture | 1 | $40B |
|
||
| Healthcare / Medical Devices | 1 | $32B |
|
||
Price history
+921.8% since first listed6 events — show timeline
- 2026-05-28 Pending — NORTHSTARMLS as Distributed by MLS Grid
- 2026-05-07 Contingent — NORTHSTARMLS as Distributed by MLS Grid
- 2026-04-28 Relisted — NORTHSTARMLS as Distributed by MLS Grid
- 2026-04-27 Contingent — NORTHSTARMLS as Distributed by MLS Grid
- 2026-04-24 Listed $258,000 NORTHSTARMLS as Distributed by MLS Grid
- 1970-03-01 Sold (Public Records) $25,250 Public Records
Property tax history
+3.8%/yrLatest (2025): $4,161 · +3.1% YoY. Source: county tax records.
Cash-flow waterfall
monthlySold comps — $/sqft
last 12 mo · ≤1 miLoading sold comps…