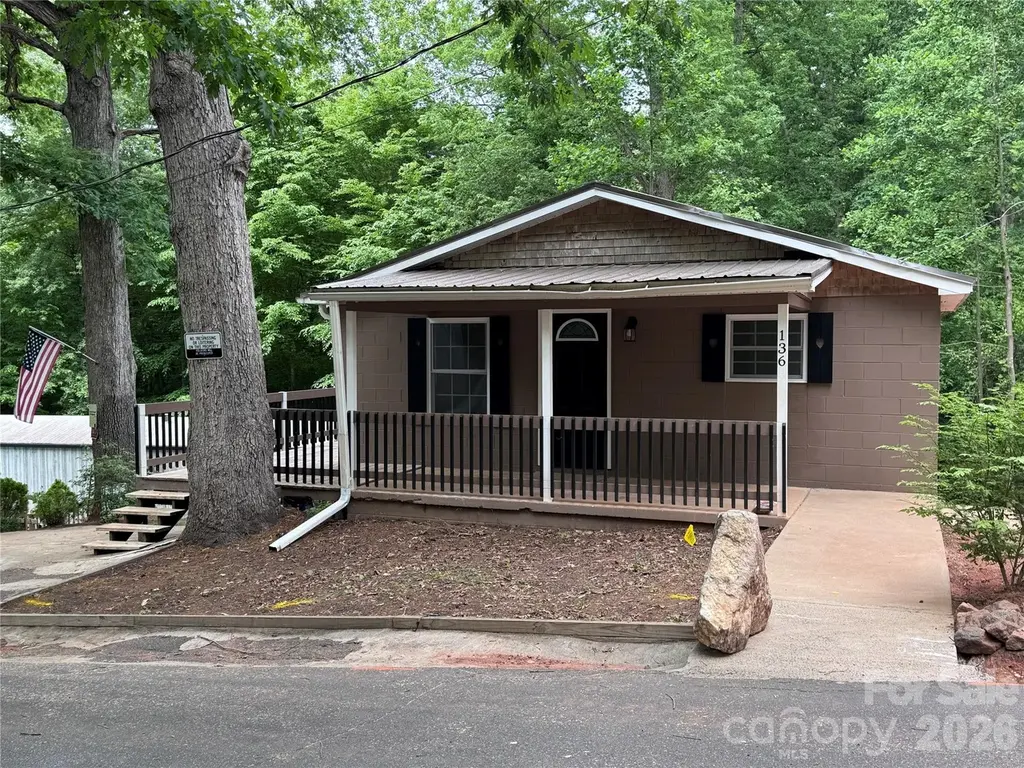
136 St John Zion Rd · Rutherfordton, NC
Flood risk 1/10 · Minimal
- FEMA flood zone
- X (unshaded)
- Chance of flooding over 30 yrs
- 0.0%
- Est. flood insurance / yr
- $507 – $1,088
Fire risk 3/10 · Minor
- Est. fire insurance / yr
- $906 – $1,684
Heat risk 5/10 · Moderate
- Hot days now (above 105°F)
- 7 days/yr
- Hot days in 30 yrs
- 16 days/yr
Wind risk 2/10 · Minimal
- Chance of severe wind over 30 yrs
- 0.0%
Air-quality risk 3/10 · Minor
- Unhealthy air days now
- 3 days/yr
- Unhealthy air days in 30 yrs
- 3 days/yr
Risk factors via First Street. Map © Google.
Why this score? — see what drove the C grade
The composite is a weighted blend of 9 inputs, each scored 0–100. Each bar is that input's sub-score; the figure is the points it added to the 100-point composite (weight × sub-score).
- Cash flow +25.6/30.0
- DSCR +8.5/10.0
- ARV discount +7.5/15.0
- 1% rule +5.4/10.0
- Livability +3.7/5.0
- Schools +3.6/10.0
- Rent growth +2.5/5.0
- Condition / age +2.5/5.0
- Appreciation +0.0/10.0
$174,900
🖨 Deal sheet 📄 Offer letter ✓ Due diligence
Listing remarks
Rare opportunity to own your own mini real estate empire in Rutherfordton. The main home features solid cinder block construction topped with a durable metal roof and has been thoughtfully updated with recent renovations. Vaulted ceilings highlight the main level, along with an open concept kitchen and living area finished with LVP flooring. Two bedrooms and a full bathroom with tile finishes are also located on the main level. Each level of the home is equipped with its own new mini split system for efficient comfort. The basement level includes a walk in laundry room and additional space that could be finished into a bedroom or second living area. A toilet is already in place in the bathr
Key facts
- Metal roof
- Open concept kitchen
- Lvp flooring
Tags
Property features AI
Finance
- HOA & community: No HOA
Exterior
- Parking: No garage; No designated parking features listed
- Utilities: Public water; Septic system installed; Electricity connected
- Home design: Single family residence; Site-built construction; One level (entry/main level living); Residential property
- Construction: Block construction; Metal roof; Basement foundation; Built on site
- Exterior features: Front porch; Lot includes level, rolling slope, sloped, and wooded areas; Road access via gravel and paved surfaces; publicly maintained road
Interior
- Kitchen: Refrigerator included
- Bedrooms: 2 bedrooms on the main level
- Flooring: Carpet; Concrete; Tile
- Bathrooms: 1 full bathroom; 1 half bathroom
- Heating & cooling: Forced air heating; Ductless heating and cooling
- Interior features: Open floorplan; 7 total rooms; Basement with interior entry, partially finished space, and walk-out access
- Laundry & utility: Washer hookup; Electric dryer hookup located in the basement
Neighborhood map
What this means for you Summary
Snapshot
- This is a 2-bed/1.0-bath single-family listed at $175k.
Deal economics
- At list price, monthly cash flow is $413 ($5k/yr) — positive.
- The deal already cash-flows at list — no discount required.
- Meets the 1% rule at list price ($2k rent vs $175k).
- Recommended offer: $170k (3.0% below list) — sets the bar for market timing.
- Cap rate 9.1% vs local median 3.0% in Rutherfordton — top-decile yield for the area; either an underpriced asset or a hidden risk that comps aren't pricing in. Stress-test before assuming the spread holds.
Location & tenants
- Location reads 73/100 on livability (#67 in NC) — a middle-class / working-renter tenant base. Strengths: cost of living A+, housing A+, health & safety A+; Watch: crime D, amenities F, commute F.
- Rutherford County Schools (rural): math 43% / reading 44% proficiency, ranked #98 of 178 in NC (top 55%) — families likely to look elsewhere, expect single-tenant / working-renter base with shorter leases; 60% free/reduced lunch — lower-income household profile, screen leases tightly.
- Zoned schools: Rutherfordton Elementary School (math 37% / reading 47%, grade F, #633 of 1,410 statewide, top 48%, 390 students, 99% FRL) — zoned schools average 99% FRL vs 60% district-wide (39 pts higher); higher-poverty schools than district average — tighter screening recommended.
- Market conditions: 312 active listings in the ZIP; 1 comparable units currently listed for rent nearby; 193 units permitted in Rutherford County in 2024 (0 in 5+ unit buildings).
Forward outlook
- Local home prices are declining (-3.0%/yr); year-one equity from $1k of loan paydown is wiped out by about $5k of value loss. Plan a longer hold.
- Rutherford County population projected at -17% by 2050 — secular population decline; favor cash flow + early exit over multi-decade hold.
Negotiation context
- It's been on market 48 days — a 3% lower offer ($170k) is reasonable based on typical stale-listing flexibility.
- 2 sale attempts since 2y ago; this cycle's ask has dropped $15k (8%) from the opening price — seller is motivated, your offer sets the floor, not the list.
Risks & watch-outs
- Watch-outs: built in 1955 — expect roof / HVAC / electrical / plumbing capex.
- Climate carrying-cost: extreme-heat days projected 7→16/yr by 2055 (HVAC capex compounding) — expect insurance premiums to compound above CPI over the hold.
Questions for the listing agent
- It's been on market 48 days. Have you received any prior offers? Is the seller open to a 3% concession, seller financing, or rate buy-down credit?
- Built in 1955 — when were the roof, HVAC, electrical panel, plumbing, and water heater last replaced?
- Is there a deadline driving the sale (1031 exchange, divorce, estate, relocation)? That informs how much negotiation room exists.
- Schools are D-rated, which usually means shorter tenancies and higher turnover. Who's the typical renter profile here, and what's been the actual vacancy rate?
- Crime grade is D in this area — have there been break-ins, vandalism, or insurance claims at this property in the last 3 years? What carrier currently insures it and at what premium?
- What's the average days-on-market for RENTAL listings here right now (not sales)? A rising rental-DOM trend means longer vacancies and softer asking-rent achievability than the comps imply.
- What's the recent tenant-quality profile in this submarket — average credit score on applications, eviction rate, late-payment / NSF rate, and stable-employment percentage? A property-management company in the area should have these aggregated.
- How much new for-sale + rental construction is in the pipeline within 1–3 miles? Heavy new supply typically softens prices + rents 12–24 months out; constrained supply supports both.
Investment metrics
- 1% rule
- 1.04% ✓
- Cap rate
- 9.13%
- Cash-on-cash
- 10.12%
- DSCR
- 1.45
- GRM
- 8.0
CMA / ARV
No comps found within radius.
Projected returns pro-forma
-3.0% appreciation · 3.0% rent growth · sell at horizon
- IRR
- -1.1%
- Equity multiple
- 0.96×
- Total profit
- $-2,125
- Equity at exit
- $26,078
- IRR
- 8.5%
- Equity multiple
- 1.65×
- Total profit
- $31,670
- Equity at exit
- $15,122
Cash invested: $48,972 (down + closing). Projections, not guarantees.
Landlord ↔ Tenant lean methodology
- Overall (STATE)
- 85 Strongly Landlord-Friendly
- State North Carolina
- 85 Strongly Landlord-Friendly · R+3
- County
- — inherits STATE
- City
- — inherits STATE
ZIP-level market 28139
- Home prices YoY
- -21.6%
- Active inventory
- 312
- Price-to-rent
- 8.0×
Monthly cashflow live
- Estimated rent
- $1,820 medium interval (Pro) →
- Mortgage (P&I)
- −$917
- Tax from tax record
- −$35 /mo · $417/yr
- Insurance
- −$73
- HOA
- −$0
- Vacancy / Maint / Mgmt
- −$382
- Net cashflow
- $413
Break-even live
UW: 25.0% down · 7.5% · 30yr · 1.5% tax · 5.0% vac · 8.0% maint · 8.0% mgmt
Financing live
Cash to close
- Down payment
- $43,725
- Closing costs
- $5,247
- Reserves months
- —
- Total cash needed
- —
Loan-product check · same deal, 3 products live
Conventional
25% down · 7.5% · 30yr
- Down + closing
- —
- Monthly P&I
- —
- Monthly cashflow
- —
- DSCR
- —
- Eligible?
- —
Personal DTI + credit; lowest rate.
DSCR
20% down · 8.5% · 30yr
- Down + closing
- —
- Monthly P&I
- —
- Monthly cashflow
- —
- DSCR
- —
- Eligible?
- —
No personal income docs; deal must DSCR.
Hard money
10% down · 12.0% · 12mo
- Down + closing
- —
- Monthly P&I
- —
- Monthly cashflow
- —
- DSCR
- —
- Eligible?
- —
Short-term bridge; refi at stabilization.
Rent comps 1 comps
| Address | Beds | Baths | Sqft | Rent | $/sqft | DOM | Units | Dist |
|---|---|---|---|---|---|---|---|---|
| 125 Central St Rutherfordton, NC | 1.0 | 1.0 | 740 | $1,820 | $2.46 | 13d | 1 | 0.52mi |
Listing history 17 events
-
2026-06-19days on market $174,900 Active 48 DOM
-
2026-06-18days on market $174,900 Active 47 DOM
-
2026-06-17days on market $174,900 Active 46 DOM
-
2026-06-16days on market $174,900 Active 45 DOM
-
2026-06-15days on market $174,900 Active 44 DOM
-
2026-06-14days on market $174,900 Active 42 DOM
-
2026-06-13days on market $174,900 Active 41 DOM
-
2026-06-10days on market $174,900 Active 39 DOM
-
2026-06-09days on market $174,900 Active 38 DOM
-
2026-06-08days on market $174,900 Active 37 DOM
-
2026-06-07pricedays on market $174,900 Active 36 DOM
-
2026-06-02days on market $189,900 Active 31 DOM
-
2026-06-01days on market $189,900 Active 30 DOM
-
2026-05-31days on market $189,900 Active 29 DOM
-
2026-05-30days on market $189,900 Active 28 DOM
-
2026-05-02$189,900 Active
-
2024-01-26$250,000 Active
ⓘ Source: listings_history table (triggers on properties + properties_extension) + one-shot
backfill from property_details.listing_events for pre-trigger history.
Tax reassessment forecast NC · Resets to sale price
- Current annual tax
- $417 · $35/mo
- Projected year-2 tax
- $1,434 · $120/mo
- Expected delta
- +$1,017/yr (+$85/mo · 243.8%)
ⓘ Screening estimate from a state-policy table — verify with the county assessor before closing.
Climate risk First Street
- Flood 1/10 Low FEMA zone X (unshaded) · 0% chance over 30 yrs
- Wildfire 3/10 Moderate
- Heat 5/10 Major 7 d/yr ≥105°F today · 16 d/yr by 30 yrs out
- Wind 2/10 Low 0% chance of damaging wind over 30 yrs
- Air quality 3/10 Moderate 3 unhealthy d/yr today · 3 by 30 yrs out
Nearby sold comps map
Loading sold comps map…
Walkable amenities ~0.75 mi
Loading nearby amenities…
Taxation est. · year 1
- Rental income
- $21,840
- − Mortgage interest
- −$9,797
- − Property taxes
- −$417
- − Insurance
- −$874
- − Repairs & maintenance
- −$1,747
- − Management
- −$1,747
- − Depreciation
- −$5,088
- Taxable income
- $2,169
- Est. tax owed @ 24.0%
- −$521
- After-tax cash flow
- $4,435/yr
For passive investors: Depreciation is non-cash, so a rental often shows a tax loss while cash-flowing — sheltering income. Rental losses are passive: they offset passive income freely, and up to $25,000/yr can offset ordinary (W-2) income if you actively participate and your MAGI is under $100k (phasing out to $0 by $150k); unused losses carry forward. On sale, claimed depreciation is recaptured at up to 25%, and gains may owe capital-gains tax (a 1031 exchange can defer both). Figures are a year-1 estimate at your 24.0% rate — not tax advice; consult a CPA.
Schools (NCES district)
- District
- Rutherford County Schools
- NCES district ID
- 3704080
- Math proficiency
- 43% ▼ -1.00%
- Reading proficiency
- 44% ▼ -2.00%
- Median HH income
- $36,490
- Composite
- 36.11/100
- National rank
- #4753
- State rank
- #98 of 178 in NC
Livability — Rutherfordton
- Score
- 73/100
- State rank
- #67
- US rank
- #5114
Category grades
Schools grade is shown separately in the Schools card above.
Census & demographics
- Population (ZIP)
- 18,887
Population outlook (Rutherford County) Hauer SSP2
- Today (2025)
- 63,695 people
- By 2030
- 61,670 · -3.2%
- By 2040
- 57,212 · -10.2%
- By 2050
- 52,763 · -17.2%
- By 2075
- 44,493 · -30.1%
- By 2100
- 38,127 · -40.1%
Race, ethnicity, and origin ACS 2023
- Neighborhood character
- Predominantly White (86%)
- Race & ethnicity
- White 86% Black 6% Two or more races 5% Hispanic / Latino 4%
- Common ancestry
- Serbian 3% Slovak 2% Lithuanian 1%
- Foreign-born
- 3% · Canada
- Languages at home
- 96% English-only · Spanish 3%
Political lean MEDSL · Rutherford
- 2024 margin
- Solid R (+47.8) · D 25.8% · R 73.6%
- 2008→2024 swing
- -16.0pp toward R · 2008: -31.8pp · 2024: -47.8pp
- All cycles
- 2024: R+47.8 2020: R+45.8 2016: R+47.9 2012: R+33.5 2008: R+31.8
Not yet ingested
- Civics
- —
Market trends
- HPI YoY
- ▼ -68.65%
- Current HPI
- 249.7007
- Rent YoY
- —
- Metro
- —
- State GDP YoY
- ▲ 3.28%
- F500 in state
- 26
Industry mix (Fortune 500 HQ in NC)
| Industry | F500 HQs | Revenue |
|---|---|---|
| Financial Services | 2 | $213B |
|
||
| Retail | 2 | $95B |
|
||
| Industrial Conglomerate | 1 | $38B |
|
||
| Metals / Steel | 1 | $35B |
|
||
| Utilities | 1 | $30B |
|
||
| Industrial Machinery | 1 | $19B |
|
||
Price history
-24.0% since first listed2 events — show timeline
- 2026-05-02 Listed $189,900 CANOPYMLS as Distributed by MLS Grid
- 2024-01-26 Listed $250,000 CANOPYMLS as Distributed by MLS Grid
Property tax history
+5.0%/yrLatest (2025): $417 · -14.0% YoY. Source: county tax records.
Cash-flow waterfall
monthlySold comps — $/sqft
last 12 mo · ≤1 miLoading sold comps…