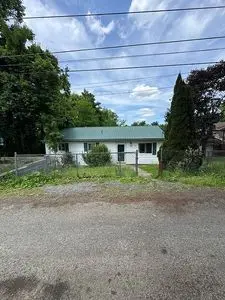
202 Haymarket Dr · MacArthur, WV
Flood risk 1/10 · Minimal
- FEMA flood zone
- X (unshaded)
- Chance of flooding over 30 yrs
- 0.0%
- Est. flood insurance / yr
- $473 – $860
Fire risk 4/10 · Minor
- Est. fire insurance / yr
- $787 – $1,461
Heat risk 2/10 · Minimal
- Hot days now (above 91°F)
- 6 days/yr
- Hot days in 30 yrs
- 16 days/yr
Wind risk 1/10 · Minimal
- Chance of severe wind over 30 yrs
- —
Air-quality risk 1/10 · Minimal
- Unhealthy air days now
- 0 days/yr
- Unhealthy air days in 30 yrs
- 0 days/yr
Risk factors via First Street. Map © Google.
Why this score? — see what drove the B- grade
The composite is a weighted blend of 9 inputs, each scored 0–100. Each bar is that input's sub-score; the figure is the points it added to the 100-point composite (weight × sub-score).
- Cash flow +30.0/30.0
- 1% rule +10.0/10.0
- DSCR +10.0/10.0
- ARV discount +7.5/15.0
- Rent growth +3.6/5.0
- Schools +3.0/10.0
- Livability +2.7/5.0
- Condition / age +2.5/5.0
- Appreciation +0.0/10.0
$80,000
🖨 Deal sheet 📄 Offer letter ✓ Due diligence
Listing remarks MLS
Now available online at AUCTION. COM This property is subject to a 5% buyer's premium pursuant to the Auction Terms & Conditions (minimums may apply). Please contact the listing agent for commission and details. This is a reserve auction and all offers are subject to seller approval. Please contact listing agent for details. ''Buyer representing self will not be paid a broker co-op commission''
Key facts
- 0.23 acre lot
- Built 1975
- Listed 12 days
Neighborhood map
What this means for you Summary
Snapshot
- This is a 2-bed/1.0-bath single-family listed at $80k.
Deal economics
- At list price, monthly cash flow is $453 ($5k/yr) — positive.
- The deal already cash-flows at list — no discount required.
- Meets the 1% rule at list price ($1k rent vs $80k).
Location & tenants
- Location reads 54/100 on livability (#296 in WV) — a working-class tenant base; expect higher turnover. Strengths: crime A+, cost of living A+, housing B; Watch: schools F, amenities F, commute F.
- Raleigh County Schools (rural): math 29% / reading 42% proficiency, ranked #14 of 55 in WV (top 26%) — families likely to look elsewhere, expect single-tenant / working-renter base with shorter leases.
- Market conditions: Rents rising fast (+4.2%/yr); 112 active listings in the ZIP; 41 units permitted in Raleigh County in 2024 (0 in 5+ unit buildings).
Forward outlook
- Local home prices are declining (-3.0%/yr); year-one equity from $553 of loan paydown is wiped out by about $2k of value loss. Plan a longer hold.
- Raleigh County population projected at -16% by 2050 — secular population decline; favor cash flow + early exit over multi-decade hold.
- At projected returns (-3.0% appreciation + 4.2% rent growth), your $22k cash investment doubles in ~5 years — after that, you're playing with house money.
Negotiation context
- Only 13 days on market — expect competitive offers; lowballing is unlikely to land.
- 2 sale attempts since 8y ago with the ask held roughly flat each time — persistent listings suggest the price (not the market) is what's stuck; bring a comps-based counter.
- Current owner paid $32k; list at $80k implies a 146% gain — meaningful room to come down on a strong offer.
Questions for the listing agent
- Built in 1975 — when were the roof, HVAC, electrical panel, plumbing, and water heater last replaced?
- Is there a deadline driving the sale (1031 exchange, divorce, estate, relocation)? That informs how much negotiation room exists.
- Schools are F-rated, which usually means shorter tenancies and higher turnover. Who's the typical renter profile here, and what's been the actual vacancy rate?
- What's the average days-on-market for RENTAL listings here right now (not sales)? A rising rental-DOM trend means longer vacancies and softer asking-rent achievability than the comps imply.
- What's the recent tenant-quality profile in this submarket — average credit score on applications, eviction rate, late-payment / NSF rate, and stable-employment percentage? A property-management company in the area should have these aggregated.
- How much new for-sale + rental construction is in the pipeline within 1–3 miles? Heavy new supply typically softens prices + rents 12–24 months out; constrained supply supports both.
Investment metrics
- 1% rule
- 1.51% ✓
- Cap rate
- 13.09%
- Cash-on-cash
- 24.26%
- DSCR
- 2.08
- GRM
- 5.5
CMA / ARV
- ARV (on-the-fly)
- $168,480
- Comps found
- 6
Show comp detail 6 sales within ~0.75 mi
| Address | Dist | Beds/Ba | Sqft | Sold | Price | $/sf | Match |
|---|---|---|---|---|---|---|---|
| 128 Granger Rd | 0.24mi | 3/2.0 (+1) | 1,412 (-2%) | 10mo | $142,000 | $101 | 68 |
| 213 Haymarket Dr | 0.03mi | 3/2.0 (+1) | 1,600 (+11%) | 18mo | $130,000 | $81 | 56 |
| 101 Azalea Cir | 0.49mi | 3/2.5 (+1) | 1,412 (-2%) | 13mo | $165,000 | $117 | 52 |
| 126 Kyle Ln | 0.70mi | 3/3.0 (+1) | 1,535 (+7%) | 9mo | $85,000 | $55 | 36 |
| 138 Pebblestone Dr | 0.71mi | 3/2.0 (+1) | 1,604 (+11%) | 7mo | $200,000 | $125 | 33 |
| 210 Millstone Dr | 0.66mi | 3/2.0 (+1) | 1,276 (-11%) | 24mo | $249,900 | $196 | 21 |
Match score weights: distance 35% · size 25% · config 20% · recency 20%. Top-matched comps best support the ARV.
Projected returns pro-forma
-3.0% appreciation · 4.25% rent growth · sell at horizon
- IRR
- 18.9%
- Equity multiple
- 1.78×
- Total profit
- $17,409
- Equity at exit
- $11,928
- IRR
- 28.0%
- Equity multiple
- 3.62×
- Total profit
- $58,733
- Equity at exit
- $6,917
Cash invested: $22,400 (down + closing). Projections, not guarantees.
Landlord ↔ Tenant lean methodology
- Overall (STATE)
- 83 Strongly Landlord-Friendly
- State West Virginia
- 83 Strongly Landlord-Friendly · R+22
- County
- — inherits STATE
- City
- — inherits STATE
ZIP-level market 25801
- Home prices YoY
- -17.8%
- Rents YoY
- 4.2%
- Active inventory
- 112
- Price-to-rent
- 5.5×
Monthly cashflow live
- Estimated rent
- $1,209 medium interval (Pro) →
- Mortgage (P&I)
- −$420
- Tax from tax record
- −$50 /mo · $596/yr
- Insurance
- −$33
- HOA
- −$0
- Vacancy / Maint / Mgmt
- −$254
- Net cashflow
- $453
Break-even live
UW: 25.0% down · 7.5% · 30yr · 1.5% tax · 5.0% vac · 8.0% maint · 8.0% mgmt
Financing live
Cash to close
- Down payment
- $20,000
- Closing costs
- $2,400
- Reserves months
- —
- Total cash needed
- —
Loan-product check · same deal, 3 products live
Conventional
25% down · 7.5% · 30yr
- Down + closing
- —
- Monthly P&I
- —
- Monthly cashflow
- —
- DSCR
- —
- Eligible?
- —
Personal DTI + credit; lowest rate.
DSCR
20% down · 8.5% · 30yr
- Down + closing
- —
- Monthly P&I
- —
- Monthly cashflow
- —
- DSCR
- —
- Eligible?
- —
No personal income docs; deal must DSCR.
Hard money
10% down · 12.0% · 12mo
- Down + closing
- —
- Monthly P&I
- —
- Monthly cashflow
- —
- DSCR
- —
- Eligible?
- —
Short-term bridge; refi at stabilization.
Listing history 13 events
-
2026-06-19days on market $80,000 Active 13 DOM
-
2026-06-18days on market $80,000 Active 12 DOM
-
2026-06-17days on market $80,000 Active 11 DOM
-
2026-06-16days on market $80,000 Active 10 DOM
-
2026-06-15days on market $80,000 Active 9 DOM
-
2026-06-14days on market $80,000 Active 7 DOM
-
2026-06-12days on market $80,000 Active 6 DOM
-
2026-06-09days on market $80,000 Active 3 DOM
-
2026-06-08days on market $80,000 Active 2 DOM
-
2026-06-07days on market $80,000 Active 1 DOM
-
2026-06-03days on market $80,000 Active 2 DOM
-
2026-06-02remarks 683-char remark
-
2026-06-02$80,000 Active 1 DOM
ⓘ Source: listings_history table (triggers on properties + properties_extension) + one-shot
backfill from property_details.listing_events for pre-trigger history.
Tax reassessment forecast WV · Resets to sale price
- Current annual tax
- $596 · $50/mo
- Projected year-2 tax
- $596 · $50/mo
- Expected delta
- $0/yr ($0/mo · 0.0%)
ⓘ Screening estimate from a state-policy table — verify with the county assessor before closing.
Climate risk First Street
- Flood 1/10 Low FEMA zone X (unshaded) · 0% chance over 30 yrs
- Wildfire 4/10 Moderate
- Heat 2/10 Low 6 d/yr ≥91°F today · 16 d/yr by 30 yrs out
- Wind 1/10 Low
- Air quality 1/10 Low 0 unhealthy d/yr today · 0 by 30 yrs out
Nearby sold comps map
Loading sold comps map…
Walkable amenities ~0.75 mi
Loading nearby amenities…
Taxation est. · year 1
- Rental income
- $14,513
- − Mortgage interest
- −$4,481
- − Property taxes
- −$596
- − Insurance
- −$400
- − Repairs & maintenance
- −$1,161
- − Management
- −$1,161
- − Depreciation
- −$2,327
- Taxable income
- $4,386
- Est. tax owed @ 24.0%
- −$1,053
- After-tax cash flow
- $4,382/yr
For passive investors: Depreciation is non-cash, so a rental often shows a tax loss while cash-flowing — sheltering income. Rental losses are passive: they offset passive income freely, and up to $25,000/yr can offset ordinary (W-2) income if you actively participate and your MAGI is under $100k (phasing out to $0 by $150k); unused losses carry forward. On sale, claimed depreciation is recaptured at up to 25%, and gains may owe capital-gains tax (a 1031 exchange can defer both). Figures are a year-1 estimate at your 24.0% rate — not tax advice; consult a CPA.
Schools (NCES district)
- District
- Raleigh County Schools
- NCES district ID
- 5401230
- Math proficiency
- 29% ▼ -8.00%
- Reading proficiency
- 42% ▼ -3.00%
- Median HH income
- $39,828
- Composite
- 29.74/100
- National rank
- #6445
- State rank
- #14 of 55 in WV
Livability — MacArthur
- Score
- 54/100
- State rank
- #296
- US rank
- #24226
Category grades
Schools grade is shown separately in the Schools card above.
Census & demographics
- Census place
- MacArthur, WV
- County
- Raleigh County · 31,128 people
- City population
- 617
- Metro
- Beckley, WV
- Population (ZIP)
- 31,128
- Household income
- $56,836
- Rent vs Own
- Severe rent burden
- 1384.0
Population outlook (Raleigh County) Hauer SSP2
- Today (2025)
- 73,505 people
- By 2030
- 70,954 · -3.5%
- By 2040
- 66,038 · -10.2%
- By 2050
- 61,919 · -15.8%
- By 2075
- 51,954 · -29.3%
- By 2100
- 39,724 · -46.0%
Race, ethnicity, and origin ACS 2023
- Neighborhood character
- Predominantly White (81%)
- Race & ethnicity
- White 81% Black 10% Two or more races 7% Hispanic / Latino 2% Asian 2%
- Common ancestry
- Slovak 2% Italian 1% Lithuanian 1%
- Foreign-born
- 2% · Canada
- Languages at home
- 96% English-only · Spanish 2% Other Indo-European 1%
Political lean MEDSL · Raleigh
- 2024 margin
- Solid R (+54.3) · D 22.0% · R 76.3% · Other 1.6%
- 2008→2024 swing
- -28.5pp toward R · 2008: -25.9pp · 2024: -54.3pp
- All cycles
- 2024: R+54.3 2020: R+50.4 2016: R+52.8 2012: R+44.6 2008: R+25.9
Not yet ingested
- Civics
- —
Market trends
- HPI YoY
- ▼ -45.60%
- Current HPI
- 210.0114
- Rent YoY
- ▲ 4.25%
- Metro
- Beckley, WV
- State GDP YoY
- —
- F500 in state
- 0
Price history
+146.2% since first listed4 events — show timeline
- 2026-06-02 Listed $80,000 FSBO.com
- 2019-08-09 Sold (MLS) — GVBOR
- 2018-12-11 Listed $25,000 GVBOR
- 1977-01-28 Sold (Public Records) $32,500 Public Records
Property tax history
+8.3%/yrLatest (2025): $596 · +22.3% YoY. Source: county tax records.
Cash-flow waterfall
monthlySold comps — $/sqft
last 12 mo · ≤1 miLoading sold comps…