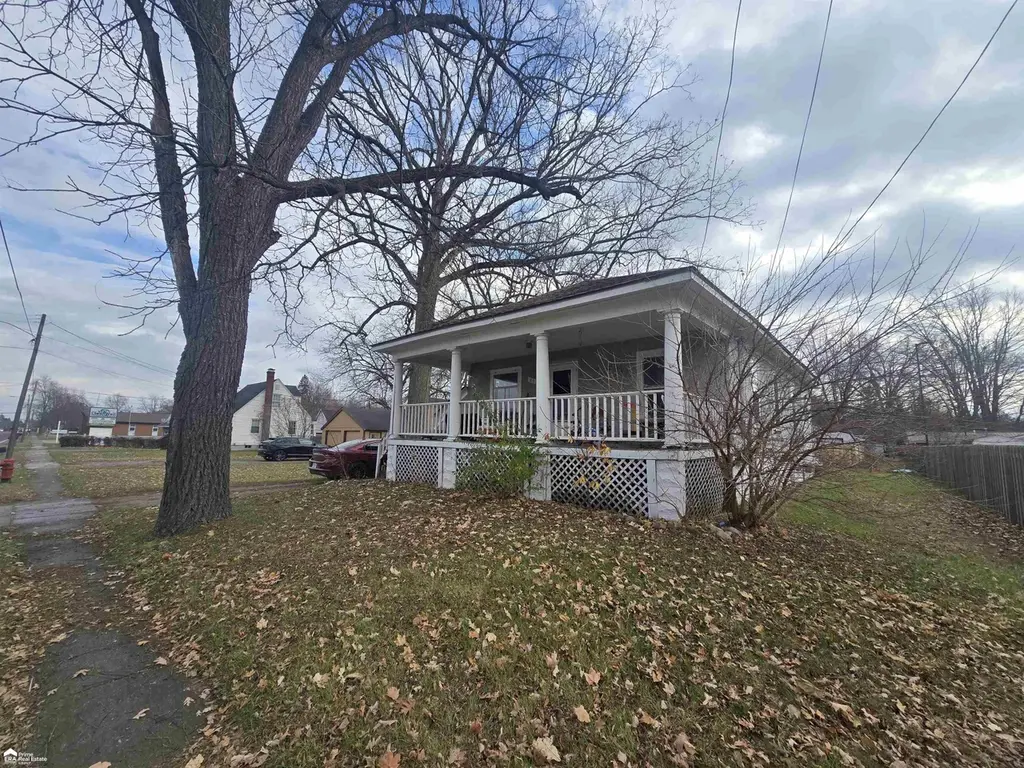
258 E State Rd · Montrose, MI
Flood risk 1/10 · Minimal
- FEMA flood zone
- X (unshaded)
- Chance of flooding over 30 yrs
- 0.0%
- Est. flood insurance / yr
- $473 – $860
Fire risk 3/10 · Minor
- Est. fire insurance / yr
- $784 – $1,456
Heat risk 2/10 · Minimal
- Hot days now (above 98°F)
- 7 days/yr
- Hot days in 30 yrs
- 15 days/yr
Wind risk 2/10 · Minimal
- Chance of severe wind over 30 yrs
- —
Air-quality risk 2/10 · Minimal
- Unhealthy air days now
- 1 days/yr
- Unhealthy air days in 30 yrs
- 2 days/yr
Risk factors via First Street. Map © Google.
Why this score? — see what drove the C+ grade
The composite is a weighted blend of 9 inputs, each scored 0–100. Each bar is that input's sub-score; the figure is the points it added to the 100-point composite (weight × sub-score).
- Cash flow +21.2/30.0
- ARV discount +15.0/15.0
- DSCR +6.8/10.0
- 1% rule +6.2/10.0
- Livability +3.6/5.0
- Schools +2.9/10.0
- Rent growth +2.5/5.0
- Condition / age +2.5/5.0
- Appreciation +0.0/10.0
$106,000
🖨 Deal sheet 📄 Offer letter ✓ Due diligence
Listing remarks MLS
Public open house Sunday 1 to 3, come by and see the home! 3 bedroom 1 bath raised ranch in the heart of Montrose! Large covered porch, open floorplan, spacious living areas, along with a New roof 3 years ago and good size yard. Walkout basement, full and usable, could be used as extra living space or nice storage! Come see today!
Key facts
- Covered porch
- Walkout basement
- Good size yard
Tags
Property features AI
Finance
- HOA & community: Has homeowners association
Exterior
- Utilities: Shared septic
- Home design: Single-family residence; One level
- Construction: Stucco exterior
- Exterior features: Lot dimensions approximately 59 x 162; Lot size about 0.21 acre
Interior
- Bathrooms: 1 full bathroom
- Heating & cooling: Forced air heating (natural gas); No cooling
- Interior features: Has basement; 3 total rooms
Neighborhood map
What this means for you Summary
Snapshot
- This is a 3-bed/1.0-bath single-family listed at $106k.
Deal economics
- At list price, monthly cash flow is $154 ($2k/yr) — positive.
- The deal already cash-flows at list — no discount required.
- Meets the 1% rule at list price ($1k rent vs $106k).
- Recommended offer: $103k (3.0% below list) — sets the bar for market timing.
Location & tenants
- Location reads 71/100 on livability (#278 in MI) — a middle-class / working-renter tenant base. Strengths: cost of living A+, housing A+, crime A-; Watch: schools C-, amenities F, commute F.
- Montrose Community Schools (rural): math 27% / reading 41% proficiency, ranked #304 of 540 in MI (top 56%) — families likely to look elsewhere, expect single-tenant / working-renter base with shorter leases.
- Market conditions: 32 active listings in the ZIP; 419 units permitted in Genesee County in 2024 (68 in 5+ unit buildings).
Forward outlook
- Local home prices are declining (-3.0%/yr); year-one equity from $733 of loan paydown is wiped out by about $3k of value loss. Plan a longer hold.
- Genesee County population projected at -27% by 2050 — secular population decline; favor cash flow + early exit over multi-decade hold.
Negotiation context
- It's been on market 36 days — a 3% lower offer ($103k) is reasonable based on typical stale-listing flexibility.
- 6 sale attempts since 7y ago with the ask held roughly flat each time — persistent listings suggest the price (not the market) is what's stuck; bring a comps-based counter.
- Current owner paid $58k; list at $106k implies a 83% gain — meaningful room to come down on a strong offer.
Risks & watch-outs
- Watch-outs: built in 1930 — expect roof / HVAC / electrical / plumbing capex.
Questions for the listing agent
- It's been on market 36 days. Have you received any prior offers? Is the seller open to a 3% concession, seller financing, or rate buy-down credit?
- Built in 1930 — when were the roof, HVAC, electrical panel, plumbing, and water heater last replaced?
- Is there a deadline driving the sale (1031 exchange, divorce, estate, relocation)? That informs how much negotiation room exists.
- What's the average days-on-market for RENTAL listings here right now (not sales)? A rising rental-DOM trend means longer vacancies and softer asking-rent achievability than the comps imply.
- What's the recent tenant-quality profile in this submarket — average credit score on applications, eviction rate, late-payment / NSF rate, and stable-employment percentage? A property-management company in the area should have these aggregated.
- How much new for-sale + rental construction is in the pipeline within 1–3 miles? Heavy new supply typically softens prices + rents 12–24 months out; constrained supply supports both.
Investment metrics
- 1% rule
- 1.12% ✓
- Cap rate
- 8.04%
- Cash-on-cash
- 6.23%
- DSCR
- 1.28
- GRM
- 7.4
CMA / ARV
- ARV (median comp)
- $137,690
- List price
- $106,000
- Delta
- -23.02%
- Verdict
- UNDERPRICED
- Comps
- 20 within 1.0 mi
Show comp detail 12 sales within ~0.75 mi
| Address | Dist | Beds/Ba | Sqft | Sold | Price | $/sf | Match |
|---|---|---|---|---|---|---|---|
| 265 E Oak St | 0.09mi | 3/1.0 | 912 (+1%) | 9mo | $155,000 | $170 | 86 |
| 165 E State St | 0.20mi | 2/1.0 (-1) | 840 (-7%) | 5mo | $110,000 | $131 | 71 |
| 259 N Genesee St | 0.50mi | 2/1.0 (-1) | 888 (-1%) | 2mo | $119,900 | $135 | 68 |
| 208 Elizabeth St | 0.39mi | 3/1.0 | 912 (+1%) | 22mo | $100,000 | $110 | 61 |
| 213 S Saginaw St | 0.35mi | 2/1.0 (-1) | 980 (+9%) | 4mo | $114,000 | $116 | 60 |
| 187 S Saginaw St | 0.32mi | 3/1.0 | 1,012 (+12%) | 7mo | $149,900 | $148 | 58 |
| 10216 Riverside Dr | 0.31mi | 3/1.0 | 1,008 (+12%) | 19mo | $170,000 | $169 | 49 |
| 259 N Saginaw St | 0.46mi | 3/1.0 | 1,024 (+14%) | 8mo | $163,000 | $159 | 49 |
| 11235 Nichols Rd | 0.60mi | 2/1.0 (-1) | 900 (0%) | 22mo | $138,000 | $153 | 48 |
| 253 Genesee St | 0.50mi | 2/1.0 (-1) | 1,005 (+12%) | 13mo | $142,000 | $141 | 42 |
| 245 W State St | 0.59mi | 3/1.0 | 1,020 (+13%) | 23mo | $135,000 | $132 | 31 |
| 325 N Genesee St | 0.59mi | 2/1.0 (-1) | 1,008 (+12%) | 22mo | $144,000 | $143 | 29 |
Match score weights: distance 35% · size 25% · config 20% · recency 20%. Top-matched comps best support the ARV.
Projected returns pro-forma
-3.0% appreciation · 3.0% rent growth · sell at horizon
- IRR
- -6.7%
- Equity multiple
- 0.75×
- Total profit
- $-7,318
- Equity at exit
- $15,805
- IRR
- 3.0%
- Equity multiple
- 1.22×
- Total profit
- $6,464
- Equity at exit
- $9,165
Cash invested: $29,680 (down + closing). Projections, not guarantees.
Landlord ↔ Tenant lean methodology
- Overall (STATE)
- 62 Landlord-Friendly
- State Michigan
- 62 Landlord-Friendly · EVEN
- County
- — inherits STATE
- City
- — inherits STATE
ZIP-level market 48457
- Home prices YoY
- -20.9%
- Active inventory
- 32
- Price-to-rent
- 7.4×
Monthly cashflow live
- Estimated rent
- $1,190 medium interval (Pro) →
- Mortgage (P&I)
- −$556
- Tax from tax record
- −$186 /mo · $2,230/yr
- Insurance
- −$44
- HOA
- −$0
- Vacancy / Maint / Mgmt
- −$250
- Net cashflow
- $154
Break-even live
UW: 25.0% down · 7.5% · 30yr · 1.5% tax · 5.0% vac · 8.0% maint · 8.0% mgmt
Financing live
Cash to close
- Down payment
- $26,500
- Closing costs
- $3,180
- Reserves months
- —
- Total cash needed
- —
Loan-product check · same deal, 3 products live
Conventional
25% down · 7.5% · 30yr
- Down + closing
- —
- Monthly P&I
- —
- Monthly cashflow
- —
- DSCR
- —
- Eligible?
- —
Personal DTI + credit; lowest rate.
DSCR
20% down · 8.5% · 30yr
- Down + closing
- —
- Monthly P&I
- —
- Monthly cashflow
- —
- DSCR
- —
- Eligible?
- —
No personal income docs; deal must DSCR.
Hard money
10% down · 12.0% · 12mo
- Down + closing
- —
- Monthly P&I
- —
- Monthly cashflow
- —
- DSCR
- —
- Eligible?
- —
Short-term bridge; refi at stabilization.
Listing history 34 events
-
2026-06-18days on market $106,000 Active 36 DOM
-
2026-06-17days on market $106,000 Active 35 DOM
-
2026-06-16days on market $106,000 Active 34 DOM
-
2026-06-15days on market $106,000 Active 33 DOM
-
2026-06-13days on market $106,000 Active 31 DOM
-
2026-06-12days on market $106,000 Active 30 DOM
-
2026-06-09days on market $106,000 Active 27 DOM
-
2026-06-08days on market $106,000 Active 26 DOM
-
2026-06-07days on market $106,000 Active 25 DOM
-
2026-06-05days on market $106,000 Active 23 DOM
-
2026-06-04days on market $106,000 Active 21 DOM
-
2026-06-02pricedays on market $106,000 Active 20 DOM
Show marketing remark (333 chars)
Public open house Sunday 1 to 3, come by and see the home! 3 bedroom 1 bath raised ranch in the heart of Montrose! Large covered porch, open floorplan, spacious living areas, along with a New roof 3 years ago and good size yard. Walkout basement, full and usable, could be used as extra living space or nice storage! Come see today!
-
2026-06-01days on market $109,800 Active 19 DOM
-
2026-05-31days on market $109,800 Active 18 DOM
-
2026-05-31days on market $109,800 Active 17 DOM
-
2026-05-14$109,900 Active 273-char remark
Show marketing remark (333 chars)
Public open house Sunday 1 to 3, come by and see the home! 3 bedroom 1 bath raised ranch in the heart of Montrose! Large covered porch, open floorplan, spacious living areas, along with a New roof 3 years ago and good size yard. Walkout basement, full and usable, could be used as extra living space or nice storage! Come see today!
-
2026-03-10historical
-
2026-02-06price $109,899
-
2026-02-06price $109,899
-
2026-02-05price $109,900
-
2026-02-05price $109,900
-
2026-01-27price $114,900
-
2026-01-26price $114,900
-
2025-12-22price $119,900
-
2025-12-22price $119,900
-
2025-11-16$124,900 Active
-
2025-11-15$124,900 Active
-
2020-02-27soldstatus $58,000 Sold
-
2020-02-27soldstatus $58,000 Closed
-
2020-01-23status Pending
-
2020-01-23status Pending
-
2019-08-20$58,900 Active
-
2019-08-20$58,900 Active
ⓘ Source: listings_history table (triggers on properties + properties_extension) + one-shot
backfill from property_details.listing_events for pre-trigger history.
Tax reassessment forecast MI · Partial reset (capped growth)
- Current annual tax
- $2,230 · $186/mo
- Projected year-2 tax
- $2,230 · $186/mo
- Expected delta
- $0/yr ($0/mo · 0.0%)
ⓘ Screening estimate from a state-policy table — verify with the county assessor before closing.
Climate risk First Street
- Flood 1/10 Low FEMA zone X (unshaded) · 0% chance over 30 yrs
- Wildfire 3/10 Moderate
- Heat 2/10 Low 7 d/yr ≥98°F today · 15 d/yr by 30 yrs out
- Wind 2/10 Low
- Air quality 2/10 Low 1 unhealthy d/yr today · 2 by 30 yrs out
Nearby sold comps map
Loading sold comps map…
Walkable amenities ~0.75 mi
Loading nearby amenities…
Taxation est. · year 1
- Rental income
- $14,277
- − Mortgage interest
- −$5,938
- − Property taxes
- −$2,230
- − Insurance
- −$530
- − Repairs & maintenance
- −$1,142
- − Management
- −$1,142
- − Depreciation
- −$3,084
- Taxable income
- $211
- Est. tax owed @ 24.0%
- −$51
- After-tax cash flow
- $1,797/yr
For passive investors: Depreciation is non-cash, so a rental often shows a tax loss while cash-flowing — sheltering income. Rental losses are passive: they offset passive income freely, and up to $25,000/yr can offset ordinary (W-2) income if you actively participate and your MAGI is under $100k (phasing out to $0 by $150k); unused losses carry forward. On sale, claimed depreciation is recaptured at up to 25%, and gains may owe capital-gains tax (a 1031 exchange can defer both). Figures are a year-1 estimate at your 24.0% rate — not tax advice; consult a CPA.
Schools (NCES district)
- District
- Montrose Community Schools
- NCES district ID
- 2624420
- Math proficiency
- 27% ▼ -2.00%
- Reading proficiency
- 41% ▼ -2.00%
- Median HH income
- $47,336
- Composite
- 29.21/100
- National rank
- #6569
- State rank
- #304 of 540 in MI
Livability — Montrose
- Score
- 71/100
- State rank
- #278
- US rank
- #6815
Category grades
Schools grade is shown separately in the Schools card above.
Census & demographics
- Census place
- Montrose, MI
- Population (ZIP)
- 8,694
Population outlook (Genesee County) Hauer SSP2
- Today (2025)
- 381,312 people
- By 2030
- 362,731 · -4.9%
- By 2040
- 321,550 · -15.7%
- By 2050
- 279,212 · -26.8%
- By 2075
- 193,336 · -49.3%
- By 2100
- 128,118 · -66.4%
Race, ethnicity, and origin ACS 2023
- Neighborhood character
- Predominantly White (90%)
- Race & ethnicity
- White 90% Two or more races 4% Black 3% Hispanic / Latino 3%
- Common ancestry
- Romanian 7% Italian 3% Iranian 3%
- Foreign-born
- 1%
- Languages at home
- 99% English-only · Spanish 1%
Political lean MEDSL · Genesee
- 2024 margin
- Toss-up / Even · D 51.4% · R 47.2% · Other 1.4%
- 2008→2024 swing
- -28.3pp toward R · 2008: 32.5pp · 2024: 4.2pp
- All cycles
- 2024: D+4.2 2020: D+9.3 2016: D+9.5 2012: D+28.2 2008: D+32.5
Not yet ingested
- Civics
- —
Market trends
- HPI YoY
- ▼ -68.89%
- Current HPI
- 260.3864
- Rent YoY
- —
- Metro
- —
- State GDP YoY
- ▲ 1.37%
- F500 in state
- 28
Industry mix (Fortune 500 HQ in MI)
| Industry | F500 HQs | Revenue |
|---|---|---|
| Automotive Parts | 3 | $48B |
|
||
| Automotive | 2 | $372B |
|
||
| Chemicals | 1 | $45B |
|
||
| Automotive Retail | 1 | $29B |
|
||
| Healthcare / Medical Devices | 1 | $23B |
|
||
| Automotive Technology | 1 | $20B |
|
||
Price history
+80.0% since first listed23 events — show timeline
- 2026-06-02 Price Changed $106,000 MiRealSource-MiMLS
- 2026-06-02 Price Changed $106,000 REALCOMP
- 2026-05-27 Price Changed $109,800 MiRealSource-MiMLS
- 2026-05-26 Price Changed $109,800 REALCOMP
- 2026-05-14 Listed $109,900 REALCOMP
- 2026-05-14 Listed $109,900 MiRealSource-MiMLS
- 2026-03-10 Listing Removed — MiRealSource-MiMLS
- 2026-02-06 Price Changed $109,899 MiRealSource-MiMLS
- 2026-02-06 Price Changed $109,899 REALCOMP
- 2026-02-05 Price Changed $109,900 MiRealSource-MiMLS
- 2026-02-05 Price Changed $109,900 REALCOMP
- 2026-01-27 Price Changed $114,900 MiRealSource-MiMLS
- 2026-01-26 Price Changed $114,900 REALCOMP
- 2025-12-22 Price Changed $119,900 MiRealSource-MiMLS
- 2025-12-22 Price Changed $119,900 REALCOMP
- 2025-11-16 Listed $124,900 REALCOMP
- 2025-11-15 Listed $124,900 MiRealSource-MiMLS
- 2020-02-27 Sold (MLS) $58,000 MiRealSource-MiMLS
- 2020-02-27 Sold (MLS) $58,000 REALCOMP
- 2020-01-23 Pending — REALCOMP
- 2020-01-23 Pending — MiRealSource-MiMLS
- 2019-08-20 Listed $58,900 MiRealSource-MiMLS
- 2019-08-20 Listed $58,900 REALCOMP
Property tax history
+1.6%/yrLatest (2025): $2,230 · +2.4% YoY. Source: county tax records.
Cash-flow waterfall
monthlySold comps — $/sqft
last 12 mo · ≤1 miLoading sold comps…