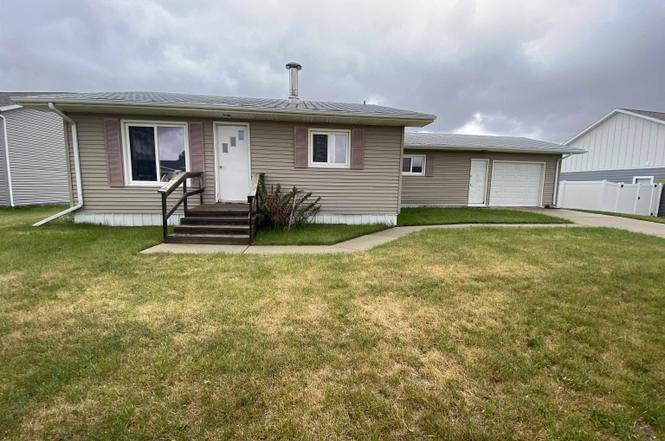
406 5th Ave SW · Surrey, ND
Flood risk 1/10 · Minimal
- FEMA flood zone
- X
- Chance of flooding over 30 yrs
- 0.0%
- Est. flood insurance / yr
- $473 – $860
Fire risk 1/10 · Minimal
- Est. fire insurance / yr
- $1,289 – $2,393
Heat risk 2/10 · Minimal
- Hot days now (above 96°F)
- 7 days/yr
- Hot days in 30 yrs
- 12 days/yr
Wind risk 1/10 · Minimal
- Chance of severe wind over 30 yrs
- —
Air-quality risk 4/10 · Minor
- Unhealthy air days now
- 6 days/yr
- Unhealthy air days in 30 yrs
- 6 days/yr
Risk factors via First Street. Map © Google.
Why this score? — see what drove the C grade
The composite is a weighted blend of 9 inputs, each scored 0–100. Each bar is that input's sub-score; the figure is the points it added to the 100-point composite (weight × sub-score).
- Cash flow +23.0/30.0
- ARV discount +7.5/15.0
- DSCR +7.4/10.0
- Appreciation +5.2/10.0
- 1% rule +5.0/10.0
- Livability +3.3/5.0
- Schools +3.0/10.0
- Rent growth +2.5/5.0
- Condition / age +2.5/5.0
$150,000
🖨 Deal sheet 📄 Offer letter ✓ Due diligence
Key facts
- Open dining area
- Nice sized yard
- Main floor laundry
Tags
Neighborhood map
What this means for you Summary
Snapshot
- This is a 3-bed/2.0-bath single-family listed at $150k.
Deal economics
- At list price, monthly cash flow is $265 ($3k/yr) — positive.
- The deal already cash-flows at list — no discount required.
- Meets the 1% rule at list price ($2k rent vs $150k).
- Recommended offer: $136k (9.0% below list) — sets the bar for market timing.
Location & tenants
- Location reads 66/100 on livability (#167 in ND) — a middle-class / working-renter tenant base. Strengths: crime A+, housing A+, employment B+; Watch: schools D, amenities F, commute F.
- Surrey 41 (rural): math 28% / reading 36% proficiency, ranked #36 of 53 in ND (top 68%) — families likely to look elsewhere, expect single-tenant / working-renter base with shorter leases; only 14% free/reduced lunch — higher-income household profile.
- Market conditions: 15 active listings in the ZIP; 123 units permitted in Ward County in 2024 (0 in 5+ unit buildings).
Forward outlook
- In year one you build about $2k of equity ($1k loan paydown + $493 appreciation (0.3% local appreciation)).
- Ward County population projected at +76% by 2050 — long-run rental-demand tailwind backs the buy-and-hold thesis.
- At projected returns (0.3% appreciation + 3.0% rent growth), your $42k cash investment doubles in ~7 years — after that, you're playing with house money.
Negotiation context
- It's been on market 105 days — a 9% lower offer ($136k) is reasonable based on typical stale-listing flexibility.
- 3 sale attempts with the ask held roughly flat each time — persistent listings suggest the price (not the market) is what's stuck; bring a comps-based counter.
- Current owner paid $6k; list at $150k implies a 2400% gain — meaningful room to come down on a strong offer.
Questions for the listing agent
- It's been on market 105 days. Have you received any prior offers? Is the seller open to a 9% concession, seller financing, or rate buy-down credit?
- Built in 1979 — when were the roof, HVAC, electrical panel, plumbing, and water heater last replaced?
- Why hasn't it sold? Are there any deal-killer items the seller is aware of (foundation, flood, title, zoning, code violations)?
- Is there a deadline driving the sale (1031 exchange, divorce, estate, relocation)? That informs how much negotiation room exists.
- Schools are D-rated, which usually means shorter tenancies and higher turnover. Who's the typical renter profile here, and what's been the actual vacancy rate?
- What's the average days-on-market for RENTAL listings here right now (not sales)? A rising rental-DOM trend means longer vacancies and softer asking-rent achievability than the comps imply.
- What's the recent tenant-quality profile in this submarket — average credit score on applications, eviction rate, late-payment / NSF rate, and stable-employment percentage? A property-management company in the area should have these aggregated.
- How much new for-sale + rental construction is in the pipeline within 1–3 miles? Heavy new supply typically softens prices + rents 12–24 months out; constrained supply supports both.
Investment metrics
- 1% rule
- 1.00% ✓
- Cap rate
- 8.42%
- Cash-on-cash
- 7.58%
- DSCR
- 1.34
- GRM
- 8.3
CMA / ARV
- ARV (on-the-fly)
- $402,696
- Comps found
- 7
Show comp detail 7 sales within ~0.75 mi
| Address | Dist | Beds/Ba | Sqft | Sold | Price | $/sf | Match |
|---|---|---|---|---|---|---|---|
| 406 5th Ave SW | 0.00mi | 3/2.0 | 2,632 (0%) | 1mo | $140,000 | $53 | 99 |
| 107 2nd Ave NW | 0.43mi | 3/2.0 | 2,688 (+2%) | 3mo | $300,000 | $112 | 74 |
| 317 6th Ave SW | 0.14mi | 4/3.0 (+1) | 2,808 (+7%) | 3mo | $445,000 | $158 | 71 |
| 319 7th Ave SW | 0.19mi | 4/3.0 (+1) | 2,712 (+3%) | 15mo | $415,000 | $153 | 65 |
| 416 3rd Ave SW | 0.12mi | 4/3.0 (+1) | 2,536 (-4%) | 22mo | $445,900 | $176 | 61 |
| 600 4th St SW | 0.11mi | 4/3.0 (+1) | 2,880 (+9%) | 16mo | $440,000 | $153 | 57 |
| 307 7th Ave SW | 0.24mi | 4/2.0 (+1) | 2,238 (-15%) | 9mo | $379,900 | $170 | 52 |
Match score weights: distance 35% · size 25% · config 20% · recency 20%. Top-matched comps best support the ARV.
Projected returns pro-forma
0.33% appreciation · 3.0% rent growth · sell at horizon
- IRR
- 7.2%
- Equity multiple
- 1.35×
- Total profit
- $14,791
- Equity at exit
- $46,037
- IRR
- 12.0%
- Equity multiple
- 2.35×
- Total profit
- $56,787
- Equity at exit
- $57,360
Cash invested: $42,000 (down + closing). Projections, not guarantees.
Landlord ↔ Tenant lean methodology
- Overall (STATE)
- 82 Strongly Landlord-Friendly
- State North Dakota
- 82 Strongly Landlord-Friendly · R+20
- County
- — inherits STATE
- City
- — inherits STATE
ZIP-level market 58785
- Home prices YoY
- 0.3%
- Active inventory
- 15
- Price-to-rent
- 8.3×
Monthly cashflow live
- Estimated rent
- $1,500 medium interval (Pro) →
- Mortgage (P&I)
- −$787
- Tax from tax record
- −$71 /mo · $849/yr
- Insurance
- −$62
- HOA
- −$0
- Vacancy / Maint / Mgmt
- −$315
- Net cashflow
- $265
Break-even live
UW: 25.0% down · 7.5% · 30yr · 1.5% tax · 5.0% vac · 8.0% maint · 8.0% mgmt
Financing live
Cash to close
- Down payment
- $37,500
- Closing costs
- $4,500
- Reserves months
- —
- Total cash needed
- —
Loan-product check · same deal, 3 products live
Conventional
25% down · 7.5% · 30yr
- Down + closing
- —
- Monthly P&I
- —
- Monthly cashflow
- —
- DSCR
- —
- Eligible?
- —
Personal DTI + credit; lowest rate.
DSCR
20% down · 8.5% · 30yr
- Down + closing
- —
- Monthly P&I
- —
- Monthly cashflow
- —
- DSCR
- —
- Eligible?
- —
No personal income docs; deal must DSCR.
Hard money
10% down · 12.0% · 12mo
- Down + closing
- —
- Monthly P&I
- —
- Monthly cashflow
- —
- DSCR
- —
- Eligible?
- —
Short-term bridge; refi at stabilization.
Listing history 13 events
-
2026-04-24status Pending
-
2026-04-06historical Active Under Contract
-
2026-01-09$150,000 Active
-
2025-09-24price $155,000
-
2025-09-08price $165,000
-
2025-09-02status Active
-
2025-08-13historical Active Under Contract
-
2025-08-07price $175,000
-
2025-06-30price $180,000
-
2025-05-29$185,000 Active
-
2011-01-26soldstatus
-
2010-07-12soldstatus
-
2005-08-03soldstatus $6,000
ⓘ Source: listings_history table (triggers on properties + properties_extension) + one-shot
backfill from property_details.listing_events for pre-trigger history.
Tax reassessment forecast ND · Resets to sale price
- Current annual tax
- $849 · $71/mo
- Projected year-2 tax
- $1,470 · $122/mo
- Expected delta
- +$621/yr (+$52/mo · 73.1%)
ⓘ Screening estimate from a state-policy table — verify with the county assessor before closing.
Climate risk First Street
- Flood 1/10 Low FEMA zone X · 0% chance over 30 yrs
- Wildfire 1/10 Low
- Heat 2/10 Low 7 d/yr ≥96°F today · 12 d/yr by 30 yrs out
- Wind 1/10 Low
- Air quality 4/10 Moderate 6 unhealthy d/yr today · 6 by 30 yrs out
Nearby sold comps map
Loading sold comps map…
Walkable amenities ~0.75 mi
Loading nearby amenities…
Taxation est. · year 1
- Rental income
- $18,002
- − Mortgage interest
- −$8,402
- − Property taxes
- −$849
- − Insurance
- −$750
- − Repairs & maintenance
- −$1,440
- − Management
- −$1,440
- − Depreciation
- −$4,364
- Taxable income
- $757
- Est. tax owed @ 24.0%
- −$182
- After-tax cash flow
- $3,002/yr
For passive investors: Depreciation is non-cash, so a rental often shows a tax loss while cash-flowing — sheltering income. Rental losses are passive: they offset passive income freely, and up to $25,000/yr can offset ordinary (W-2) income if you actively participate and your MAGI is under $100k (phasing out to $0 by $150k); unused losses carry forward. On sale, claimed depreciation is recaptured at up to 25%, and gains may owe capital-gains tax (a 1031 exchange can defer both). Figures are a year-1 estimate at your 24.0% rate — not tax advice; consult a CPA.
Schools (NCES district)
- District
- Surrey 41
- NCES district ID
- 3817910
- Math proficiency
- 28% ▼ -4.00%
- Reading proficiency
- 36% ▲ 3.00%
- Median HH income
- $68,486
- Composite
- 29.6/100
- National rank
- #6479
- State rank
- #36 of 53 in ND
Livability — Surrey
- Score
- 66/100
- State rank
- #167
- US rank
- #11845
Category grades
Schools grade is shown separately in the Schools card above.
Census & demographics
- Census place
- Surrey, ND
- Population (ZIP)
- 1,729
Population outlook (Ward County) Hauer SSP2
- Today (2025)
- 92,683 people
- By 2030
- 104,825 · +13.1%
- By 2040
- 131,945 · +42.4%
- By 2050
- 163,134 · +76.0%
- By 2075
- 256,561 · +176.8%
- By 2100
- 354,426 · +282.4%
Race, ethnicity, and origin ACS 2023
- Neighborhood character
- Predominantly White (92%)
- Race & ethnicity
- White 92% Two or more races 5% Hispanic / Latino 3%
- Common ancestry
- Portuguese 24% Lithuanian 6% Scotch-Irish 3%
- Foreign-born
- 2% · Canada
- Languages at home
- 97% English-only · Spanish 2%
Political lean MEDSL · Ward
- 2024 margin
- Solid R (+47.4) · D 25.5% · R 72.8% · Other 1.7%
- 2008→2024 swing
- -28.2pp toward R · 2008: -19.2pp · 2024: -47.4pp
- All cycles
- 2024: R+47.4 2020: R+44.9 2016: R+47.7 2012: R+30.8 2008: R+19.2
Not yet ingested
- Civics
- —
Market trends
- HPI YoY
- ▲ 0.33%
- Current HPI
- 96.3552
- Rent YoY
- —
- Metro
- —
- State GDP YoY
- ▲ 2.09%
- F500 in state
- 2
Industry mix (Fortune 500 HQ in ND)
| Industry | F500 HQs | Revenue |
|---|---|---|
| Utilities / Construction | 1 | $6B |
|
||
Price history
+2400.0% since first listed13 events — show timeline
- 2026-04-24 Pending — MMLS
- 2026-04-06 Contingent — MMLS
- 2026-01-09 Listed $150,000 MMLS
- 2025-09-24 Price Changed $155,000 MMLS
- 2025-09-08 Price Changed $165,000 MMLS
- 2025-09-02 Relisted — MMLS
- 2025-08-13 Contingent — MMLS
- 2025-08-07 Price Changed $175,000 MMLS
- 2025-06-30 Price Changed $180,000 MMLS
- 2025-05-29 Listed $185,000 MMLS
- 2011-01-26 Sold (Public Records) — Public Records
- 2010-07-12 Sold (Public Records) — Public Records
- 2005-08-03 Sold (Public Records) $6,000 Public Records
Property tax history
-7.3%/yrLatest (2025): $849 · -63.5% YoY. Source: county tax records.
Cash-flow waterfall
monthlySold comps — $/sqft
last 12 mo · ≤1 miLoading sold comps…