 🏗️ New Construction
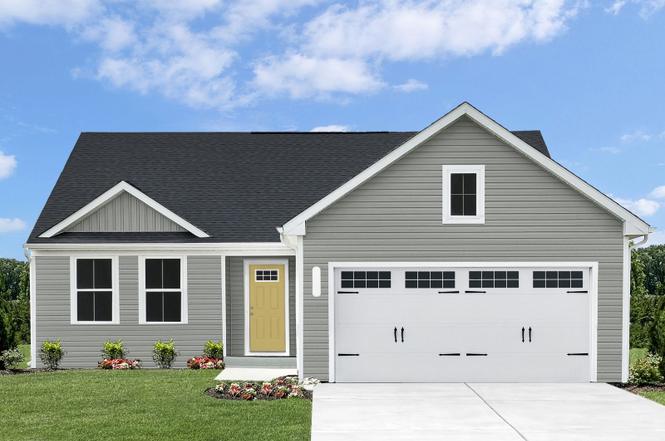
Tupelo Plan · Pageland, SC
Flood risk No data
- FEMA flood zone
- —
- Chance of flooding over 30 yrs
- —
- Est. flood insurance / yr
- —
Fire risk No data
- Est. fire insurance / yr
- —
Heat risk No data
- Hot days now (above threshold)
- —
- Hot days in 30 yrs
- —
Wind risk No data
- Chance of severe wind over 30 yrs
- —
Air-quality risk No data
- Unhealthy air days now
- —
- Unhealthy air days in 30 yrs
- —
Risk factors via First Street. Map © Google.
Why this score? — see what drove the D- grade
The composite is a weighted blend of 9 inputs, each scored 0–100. Each bar is that input's sub-score; the figure is the points it added to the 100-point composite (weight × sub-score).
- Appreciation +10.0/10.0
- ARV discount +7.5/15.0
- Cash flow +7.3/30.0
- Livability +2.6/5.0
- Rent growth +2.5/5.0
- Schools +2.5/10.0
- Condition / age +2.5/5.0
- 1% rule +2.0/10.0
- DSCR +1.4/10.0
$259,990
🖨 Deal sheet 📄 Offer letter ✓ Due diligence
Listing remarks
The Tupelo is a stylish and spacious ranch home with a two-car garage, designed for effortless living. As you step inside, the entry foyer draws your eye toward the bright and inviting great room, while also providing access to two bedrooms and a hall bath. The third bedroom offers flexibility-transform it into a cozy home office or a versatile flex space to suit your needs. The heart of the home is the open-concept great room, seamlessly flowing into the gourmet kitchen and dining area. Ideal for entertaining, this airy space creates a natural, comfortable ambiance. Whether you're hosting a lively gathering or enjoying a quiet night in, the layout ensures effortless connection, allowing yo
Key facts
- Walk-in closet
- Entry foyer
- Gourmet kitchen
Tags
Property features AI
Finance
- Other: Listing status: Active
- Financial info: List price: $259,990
Exterior
- Utilities: Central air conditioning (connected)
- Home design: Tupelo plan (new construction — Plan inventory type); Single-family home (plan-based listing)
- Construction: New construction (Tupelo plan)
- Exterior features: Located at 112 Azalea Dr, Pageland SC (Tupelo plan in Greater Monroe Area)
Interior
- Kitchen: Plan includes a standard kitchen layout
- Bedrooms: 3 bedrooms
- Bathrooms: 2 full bathrooms
- Heating & cooling: Central air conditioning
- Interior features: Open living areas (plan-based home)
Neighborhood map
What this means for you Summary
Snapshot
- This is a 3-bed/2.0-bath single-family listed at $260k.
Deal economics
- At list price, monthly cash flow is $-381 ($-5k/yr) — negative.
- To cash-flow at today's rent, offer at most $229k (12.1% below list).
- To meet the 1% rule (rent ≥ 1% of price), the offer needs to be $200k (23.1% below list).
- Recommended offer: $200k (23.1% below list) — sets the bar for 1% rule.
Location & tenants
- Location reads 52/100 on livability (#352 in SC) — a working-class tenant base; expect higher turnover. Strengths: cost of living A+, housing A+; Watch: schools F, crime F, amenities F.
- Chesterfield 01 (rural): math 25% / reading 36% proficiency, ranked #55 of 80 in SC (top 69%) — families likely to look elsewhere, expect single-tenant / working-renter base with shorter leases; 63% free/reduced lunch — lower-income household profile, screen leases tightly.
- Market conditions: 118 active listings in the ZIP; 1 comparable units currently listed for rent nearby; 145 units permitted in Chesterfield County in 2024 (10 in 5+ unit buildings).
Forward outlook
- In year one you build about $30k of equity ($2k loan paydown + $28k appreciation (10.0% local appreciation)).
- Chesterfield County population projected at -17% by 2050 — secular population decline; favor cash flow + early exit over multi-decade hold.
- By year 2, paydown + projected appreciation supports a ~$49k cash-out refi (75% LTV) — recoverable capital for the next deal without selling this one.
Negotiation context
- It's been on market 156 days — a 12% lower offer ($229k) is reasonable based on typical stale-listing flexibility.
Questions for the listing agent
- What do current leases actually rent for vs. the listed asking? Can we see a recent rent roll and the last 12 months of T-12 income?
- It's been on market 156 days. Have you received any prior offers? Is the seller open to a 23% concession, seller financing, or rate buy-down credit?
- Why hasn't it sold? Are there any deal-killer items the seller is aware of (foundation, flood, title, zoning, code violations)?
- Is there a deadline driving the sale (1031 exchange, divorce, estate, relocation)? That informs how much negotiation room exists.
- Schools are F-rated, which usually means shorter tenancies and higher turnover. Who's the typical renter profile here, and what's been the actual vacancy rate?
- Crime grade is F in this area — have there been break-ins, vandalism, or insurance claims at this property in the last 3 years? What carrier currently insures it and at what premium?
- The area grade is low — what's the realistic commute time and amenity access for the typical tenant pool here? Any planned neighborhood developments (good or bad) we should know about?
- What's the average days-on-market for RENTAL listings here right now (not sales)? A rising rental-DOM trend means longer vacancies and softer asking-rent achievability than the comps imply.
- What's the recent tenant-quality profile in this submarket — average credit score on applications, eviction rate, late-payment / NSF rate, and stable-employment percentage? A property-management company in the area should have these aggregated.
- How much new for-sale + rental construction is in the pipeline within 1–3 miles? Heavy new supply typically softens prices + rents 12–24 months out; constrained supply supports both.
Investment metrics
- 1% rule
- 0.70% ✗
- Cap rate
- 4.68%
- Cash-on-cash
- -5.76%
- DSCR
- 0.74
- GRM
- 11.8
CMA / ARV
- ARV (on-the-fly)
- $283,679
- Comps found
- 1
Show comp detail 1 sale within ~0.75 mi
| Address | Dist | Beds/Ba | Sqft | Sold | Price | $/sf | Match |
|---|---|---|---|---|---|---|---|
| 111 Rogers St | 0.47mi | 4/2.0 (+1) | 1,494 (-2%) | 4mo | $280,000 | $187 | 67 |
Match score weights: distance 35% · size 25% · config 20% · recency 20%. Top-matched comps best support the ARV.
Projected returns pro-forma
10.0% appreciation · 3.0% rent growth · sell at horizon
- IRR
- 20.2%
- Equity multiple
- 2.64×
- Total profit
- $130,248
- Equity at exit
- $255,561
- IRR
- 18.4%
- Equity multiple
- 6.07×
- Total profit
- $402,714
- Equity at exit
- $551,126
Cash invested: $79,430 (down + closing). Projections, not guarantees.
Landlord ↔ Tenant lean methodology
- Overall (STATE)
- 90 Strongly Landlord-Friendly
- State South Carolina
- 90 Strongly Landlord-Friendly · R+6
- County
- — inherits STATE
- City
- — inherits STATE
ZIP-level market 29728
- Home prices YoY
- 19.9%
- Active inventory
- 118
- Price-to-rent
- 10.8×
Monthly cashflow live
- Estimated rent
- $1,999 medium interval (Pro) →
- Mortgage (P&I)
- −$1,488
- Tax est. 1.5%
- −$355 /mo · $4,255/yr
- Insurance
- −$118
- HOA
- −$0
- Vacancy / Maint / Mgmt
- −$420
- Net cashflow
- $-381
Break-even live
UW: 25.0% down · 7.5% · 30yr · 1.5% tax · 5.0% vac · 8.0% maint · 8.0% mgmt
Financing live
Cash to close
- Down payment
- $70,920
- Closing costs
- $8,510
- Reserves months
- —
- Total cash needed
- —
Loan-product check · same deal, 3 products live
Conventional
25% down · 7.5% · 30yr
- Down + closing
- —
- Monthly P&I
- —
- Monthly cashflow
- —
- DSCR
- —
- Eligible?
- —
Personal DTI + credit; lowest rate.
DSCR
20% down · 8.5% · 30yr
- Down + closing
- —
- Monthly P&I
- —
- Monthly cashflow
- —
- DSCR
- —
- Eligible?
- —
No personal income docs; deal must DSCR.
Hard money
10% down · 12.0% · 12mo
- Down + closing
- —
- Monthly P&I
- —
- Monthly cashflow
- —
- DSCR
- —
- Eligible?
- —
Short-term bridge; refi at stabilization.
Rent comps 1 comps
| Address | Beds | Baths | Sqft | Rent | $/sqft | DOM | Units | Dist |
|---|---|---|---|---|---|---|---|---|
| 203 Maggys Way Pageland, SC | 3.0 | 3.0 | 1517 | $1,999 | $1.32 | 21d | 1 | 0.29mi |
Listing history 13 events
-
2026-06-18days on market $259,990 Active 156 DOM
-
2026-06-17days on market $259,990 Active 155 DOM
-
2026-06-16days on market $259,990 Active 154 DOM
-
2026-06-15days on market $259,990 Active 153 DOM
-
2026-06-13days on market $259,990 Active 151 DOM
-
2026-06-09days on market $259,990 Active 147 DOM
-
2026-06-08days on market $259,990 Active 146 DOM
-
2026-06-07days on market $259,990 Active 145 DOM
-
2026-06-04days on market $259,990 Active 142 DOM
-
2026-06-03days on market $259,990 Active 141 DOM
-
2026-06-02days on market $259,990 Active 140 DOM
-
2026-06-01days on market $259,990 Active 139 DOM
-
2026-05-31days on market $259,990 Active 138 DOM
ⓘ Source: listings_history table (triggers on properties + properties_extension) + one-shot
backfill from property_details.listing_events for pre-trigger history.
Nearby sold comps map
Loading sold comps map…
Walkable amenities ~0.75 mi
Loading nearby amenities…
Taxation est. · year 1
- Rental income
- $23,988
- − Mortgage interest
- −$15,890
- − Property taxes
- −$4,255
- − Insurance
- −$1,418
- − Repairs & maintenance
- −$1,919
- − Management
- −$1,919
- − Depreciation
- −$8,252
- Taxable loss
- −$9,667
- Est. tax savings @ 24.0%
- +$2,320
- After-tax cash flow
- $-2,255/yr
For passive investors: Depreciation is non-cash, so a rental often shows a tax loss while cash-flowing — sheltering income. Rental losses are passive: they offset passive income freely, and up to $25,000/yr can offset ordinary (W-2) income if you actively participate and your MAGI is under $100k (phasing out to $0 by $150k); unused losses carry forward. On sale, claimed depreciation is recaptured at up to 25%, and gains may owe capital-gains tax (a 1031 exchange can defer both). Figures are a year-1 estimate at your 24.0% rate — not tax advice; consult a CPA.
Schools (NCES district)
- District
- Chesterfield 01
- NCES district ID
- 4501560
- Math proficiency
- 25% ▼ -11.00%
- Reading proficiency
- 36% ▬ 0.00%
- Median HH income
- $33,946
- Composite
- 25.04/100
- National rank
- #7547
- State rank
- #55 of 80 in SC
Livability — Pageland
- Score
- 52/100
- State rank
- #352
- US rank
- #24948
Category grades
Schools grade is shown separately in the Schools card above.
Census & demographics
- City population
- 9,470
- Population (ZIP)
- 9,470
Population outlook (Chesterfield County) Hauer SSP2
- Today (2025)
- 44,632 people
- By 2030
- 43,331 · -2.9%
- By 2040
- 40,218 · -9.9%
- By 2050
- 36,847 · -17.4%
- By 2075
- 29,636 · -33.6%
- By 2100
- 23,536 · -47.3%
Race, ethnicity, and origin ACS 2023
- Neighborhood character
- Diverse neighborhood (Simpson 0.62)
- Race & ethnicity
- White 48% Black 38% Two or more races 10% Hispanic / Latino 7%
- Hispanic origin (detail)
- Mexican 6%
- Common ancestry
- Serbian 1% Lithuanian 1% Romanian 1%
- Foreign-born
- 4% · Canada
- Languages at home
- 96% English-only · Spanish 4%
Political lean MEDSL · Chesterfield
- 2024 margin
- Strong R (+28.1) · D 35.5% · R 63.5% · Other 1.0%
- 2008→2024 swing
- -25.1pp toward R · 2008: -3.0pp · 2024: -28.1pp
- All cycles
- 2024: R+28.1 2020: R+20.5 2016: R+14.3 2012: R+3.3 2008: R+3.0
Not yet ingested
- Civics
- —
Market trends
- HPI YoY
- ▲ 49.76%
- Current HPI
- 299.8227
- Rent YoY
- —
- Metro
- —
- State GDP YoY
- ▲ 4.51%
- F500 in state
- 2
Industry mix (Fortune 500 HQ in SC)
| Industry | F500 HQs | Revenue |
|---|---|---|
| Packaging | 1 | $7B |
|
||
Cash-flow waterfall
monthlySold comps — $/sqft
last 12 mo · ≤1 miLoading sold comps…