2331 Homestead Rd · Lake of the Woods, AZ
Flood risk 1/10 · Minimal
- FEMA flood zone
- X (unshaded)
- Chance of flooding over 30 yrs
- 0.0%
- Est. flood insurance / yr
- $507 – $1,088
Fire risk 8/10 · Major
- Est. fire insurance / yr
- $610 – $1,132
Heat risk 2/10 · Minimal
- Hot days now (above 88°F)
- 7 days/yr
- Hot days in 30 yrs
- 19 days/yr
Wind risk 1/10 · Minimal
- Chance of severe wind over 30 yrs
- —
Air-quality risk 3/10 · Minor
- Unhealthy air days now
- 2 days/yr
- Unhealthy air days in 30 yrs
- 3 days/yr
Risk factors via First Street. Map © Google.
Why this score? — see what drove the B+ grade
The composite is a weighted blend of 9 inputs, each scored 0–100. Each bar is that input's sub-score; the figure is the points it added to the 100-point composite (weight × sub-score).
- Cash flow +30.0/30.0
- ARV discount +15.0/15.0
- 1% rule +10.0/10.0
- DSCR +10.0/10.0
- Condition / age +3.8/5.0
- Livability +2.9/5.0
- Rent growth +2.5/5.0
- Schools +2.2/10.0
- Appreciation +0.0/10.0
$75,000
🖨 Deal sheet 📄 Offer letter ✓ Due diligence
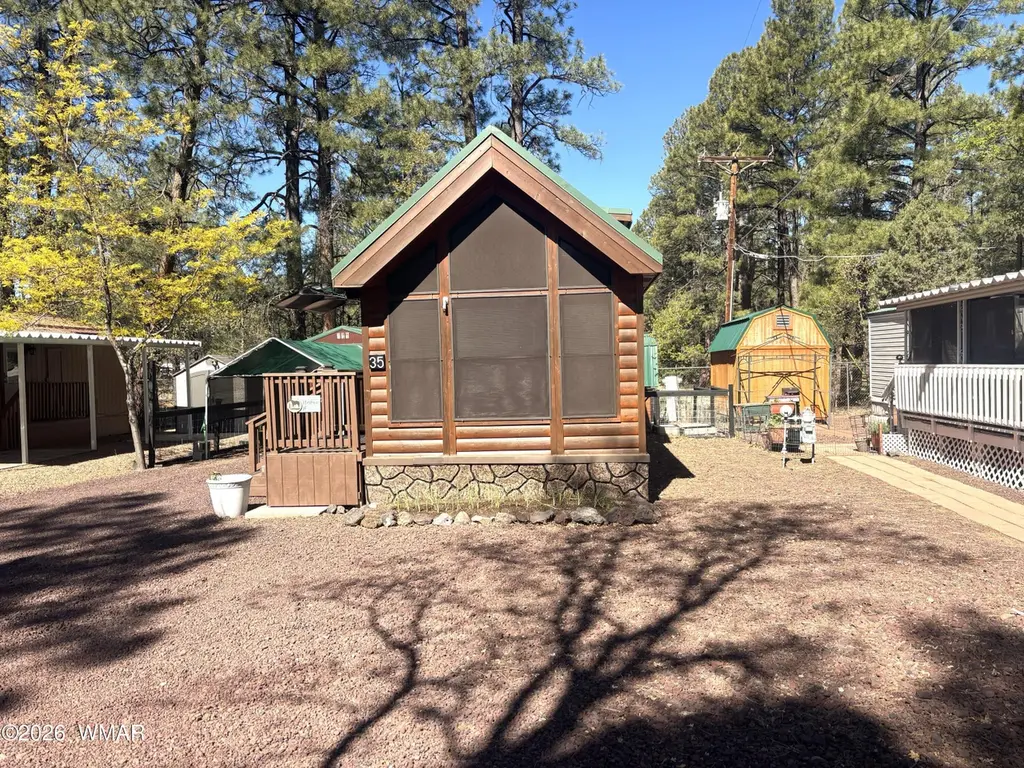
Listing remarks
Come see this beautiful log cabin in the cool Lakeside climate. RENT PAID UNTIL THE END IF AUGUST! Propane stove and furnace. Secluded back area of the park, backing vacant land and tall pines for peaceful afternoon and evening enjoyment! Brand new garbage disposal. 2 insulated storage sheds with W/ D. and separate circuit and breaker box. This is a well-kept home with Insulated pipes underneath the park model. MUST SEE this beautiful Home!!!
Key facts
- Parking
- Built 2004
- Listed 30 days
Property features AI
Finance
- Other: Located in Homestead Road Mobile Ranch, unit #35; Road maintenance by city
- Financial info: Leased land: monthly lease of $620
- HOA & community: No HOA; Community clubhouse; On-site laundry; 55+ community
Exterior
- Parking: Detached carport (1 car)
- Utilities: Metered water (Homestead Park Water); Sewer available; Electric individually metered; Bottled gas available; Power available
- Home design: Park model/RV residential type; Manufactured construction; Park model; Located in a managed park (leased land)
- Construction: Metal pitched roof; Manufactured construction
- Exterior features: Front porch; Rear porch; Partly fenced; Property adjoins private land; Tall pines on lot; Panoramic views; Set among trees
Interior
- Kitchen: Gas range; Microwave; Pantry; Refrigerator
- Bedrooms: Master bedroom downstairs
- Flooring: Carpet; Laminate
- Bathrooms: Full bath with tub/shower
- Heating & cooling: Bottled gas heating; Electric water heater
- Interior features: Master bedroom located downstairs; Smoke detector; Vaulted ceiling; No fireplace
- Laundry & utility: Washer and dryer in utility room
Neighborhood map
What this means for you Summary
Snapshot
- This is a 2-bed/1.0-bath manufactured listed at $75k. Condition is rated good.
Deal economics
- At list price, monthly cash flow is $478 ($6k/yr) — positive.
- The deal already cash-flows at list — no discount required.
- Meets the 1% rule at list price ($1k rent vs $75k).
- Recommended offer: $73k (3.0% below list) — sets the bar for market timing.
- Cap rate 13.9% vs local median 2.4% in Lake of the Woods — top-decile yield for the area; either an underpriced asset or a hidden risk that comps aren't pricing in. Stress-test before assuming the spread holds.
Location & tenants
- Location reads 58/100 on livability (#206 in AZ) — a working-class tenant base; expect higher turnover. Strengths: cost of living A+, housing A+, crime A-; Watch: schools F, amenities F, commute F.
- Blue Ridge Unified School District No. 32 (4397) (town): math 21% / reading 29% proficiency, ranked #139 of 249 in AZ (top 56%) — low school quality limits family demand, transient renter base, plan for 1-2y turnover.
- Market conditions: 257 active listings in the ZIP; 485 units permitted in Navajo County in 2024 (11 in 5+ unit buildings).
Forward outlook
- Local home prices are declining (-3.0%/yr); year-one equity from $519 of loan paydown is wiped out by about $2k of value loss. Plan a longer hold.
- Navajo County population projected at -16% by 2050 — secular population decline; favor cash flow + early exit over multi-decade hold.
- At projected returns (-3.0% appreciation + 3.0% rent growth), your $21k cash investment doubles in ~5 years — after that, you're playing with house money.
Negotiation context
- It's been on market 31 days — a 3% lower offer ($73k) is reasonable based on typical stale-listing flexibility.
- 3 sale attempts since 4y ago with the ask held roughly flat each time — persistent listings suggest the price (not the market) is what's stuck; bring a comps-based counter.
Risks & watch-outs
- Climate carrying-cost: severe wildfire risk — expect insurance premiums to compound above CPI over the hold.
Questions for the listing agent
- It's been on market 31 days. Have you received any prior offers? Is the seller open to a 3% concession, seller financing, or rate buy-down credit?
- Is there a deadline driving the sale (1031 exchange, divorce, estate, relocation)? That informs how much negotiation room exists.
- Schools are F-rated, which usually means shorter tenancies and higher turnover. Who's the typical renter profile here, and what's been the actual vacancy rate?
- What's the average days-on-market for RENTAL listings here right now (not sales)? A rising rental-DOM trend means longer vacancies and softer asking-rent achievability than the comps imply.
- What's the recent tenant-quality profile in this submarket — average credit score on applications, eviction rate, late-payment / NSF rate, and stable-employment percentage? A property-management company in the area should have these aggregated.
- How much new for-sale + rental construction is in the pipeline within 1–3 miles? Heavy new supply typically softens prices + rents 12–24 months out; constrained supply supports both.
Investment metrics
- 1% rule
- 1.68% ✓
- Cap rate
- 13.93%
- Cash-on-cash
- 27.29%
- DSCR
- 2.21
- GRM
- 5.0
CMA / ARV
- ARV (median comp)
- $110,000
- List price
- $75,000
- Delta
- -31.82%
- Verdict
- UNDERPRICED
- Comps
- 2 within 2.0 mi
Projected returns pro-forma
-3.0% appreciation · 3.0% rent growth · sell at horizon
- IRR
- 21.3%
- Equity multiple
- 1.87×
- Total profit
- $18,285
- Equity at exit
- $11,183
- IRR
- 29.4%
- Equity multiple
- 3.63×
- Total profit
- $55,169
- Equity at exit
- $6,485
Cash invested: $21,000 (down + closing). Projections, not guarantees.
Landlord ↔ Tenant lean methodology
- Overall (STATE)
- 87 Strongly Landlord-Friendly
- State Arizona
- 87 Strongly Landlord-Friendly · R+3
- County
- — inherits STATE
- City
- — inherits STATE
ZIP-level market 85929
- Home prices YoY
- -16.9%
- Active inventory
- 257
- Price-to-rent
- 5.0×
Monthly cashflow live
- Estimated rent
- $1,261 medium interval (Pro) →
- Mortgage (P&I)
- −$393
- Tax est. 1.5%
- −$94 /mo · $1,125/yr
- Insurance
- −$31
- HOA
- −$0
- Vacancy / Maint / Mgmt
- −$265
- Net cashflow
- $478
Break-even live
UW: 25.0% down · 7.5% · 30yr · 1.5% tax · 5.0% vac · 8.0% maint · 8.0% mgmt
Financing live
Cash to close
- Down payment
- $18,750
- Closing costs
- $2,250
- Reserves months
- —
- Total cash needed
- —
Loan-product check · same deal, 3 products live
Conventional
25% down · 7.5% · 30yr
- Down + closing
- —
- Monthly P&I
- —
- Monthly cashflow
- —
- DSCR
- —
- Eligible?
- —
Personal DTI + credit; lowest rate.
DSCR
20% down · 8.5% · 30yr
- Down + closing
- —
- Monthly P&I
- —
- Monthly cashflow
- —
- DSCR
- —
- Eligible?
- —
No personal income docs; deal must DSCR.
Hard money
10% down · 12.0% · 12mo
- Down + closing
- —
- Monthly P&I
- —
- Monthly cashflow
- —
- DSCR
- —
- Eligible?
- —
Short-term bridge; refi at stabilization.
Listing history 17 events
-
2026-06-01days on market $75,000 Active 31 DOM
-
2026-05-31days on market $75,000 Active 30 DOM
-
2026-05-31days on market $75,000 Active 29 DOM
-
2026-05-01$75,000 Active 448-char remark
-
2025-10-02price $45,000
-
2025-07-24price $69,000
-
2024-10-07price $89,000
-
2023-11-11price $15,000
-
2022-07-22soldstatus $75,000 Closed
-
2022-07-01historical
-
2022-07-01status Pending Take Backup
-
2022-06-28price $75,000
-
2022-06-06price $97,500
-
2022-04-27price $125,000
-
2022-03-31status Active
-
2022-03-29historical
-
2022-03-29$135,000 Active
ⓘ Source: listings_history table (triggers on properties + properties_extension) + one-shot
backfill from property_details.listing_events for pre-trigger history.
Climate risk First Street
- Flood 1/10 Low FEMA zone X (unshaded) · 0% chance over 30 yrs
- Wildfire 8/10 Severe
- Heat 2/10 Low 7 d/yr ≥88°F today · 19 d/yr by 30 yrs out
- Wind 1/10 Low
- Air quality 3/10 Moderate 2 unhealthy d/yr today · 3 by 30 yrs out
Nearby sold comps map
Loading sold comps map…
Walkable amenities ~0.75 mi
Loading nearby amenities…
Taxation est. · year 1
- Rental income
- $15,128
- − Mortgage interest
- −$4,201
- − Property taxes
- −$1,125
- − Insurance
- −$375
- − Repairs & maintenance
- −$1,210
- − Management
- −$1,210
- − Depreciation
- −$2,182
- Taxable income
- $4,824
- Est. tax owed @ 24.0%
- −$1,158
- After-tax cash flow
- $4,573/yr
For passive investors: Depreciation is non-cash, so a rental often shows a tax loss while cash-flowing — sheltering income. Rental losses are passive: they offset passive income freely, and up to $25,000/yr can offset ordinary (W-2) income if you actively participate and your MAGI is under $100k (phasing out to $0 by $150k); unused losses carry forward. On sale, claimed depreciation is recaptured at up to 25%, and gains may owe capital-gains tax (a 1031 exchange can defer both). Figures are a year-1 estimate at your 24.0% rate — not tax advice; consult a CPA.
Condition & rehab AI · 12 photos
This log cabin is in good condition with cosmetic updates needed to enhance its resale and rental value.
Repairs flagged
- Minor Kitchen cabinets — Worn appearance
- Minor Bathtub — Signs of wear
Value-add opportunities
- Both Paint interior walls — Fresh paint enhances curb appeal and interior aesthetics
- Both Replace worn kitchen cabinets — New cabinets improve functionality and appearance
- Both Upgrade bathroom fixtures — Modern fixtures enhance functionality and appeal
Renovation cost estimate screening
| Repair item | Severity | Est. cost |
|---|---|---|
| Kitchen cabinets · Worn appearance | Minor | $500–3,000 |
| Bathtub · Signs of wear | Minor | $500–3,000 |
| Total estimated repair cost · 2 items | $1,000–6,000 |
Value-add ROI direction
- Both Paint interior walls — Fresh paint enhances curb appeal and interior aesthetics ↑
- Both Replace worn kitchen cabinets — New cabinets improve functionality and appearance ↑
- Both Upgrade bathroom fixtures — Modern fixtures enhance functionality and appeal ↑
ⓘ Cost ranges are severity-bucket heuristics (US national rule-of-thumb). Get contractor quotes + a written scope before underwriting a rehab budget.
Schools (NCES district)
- District
- Blue Ridge Unified School District No. 32 (4397)
- NCES district ID
- 0406580
- Math proficiency
- 21% ▼ -11.00%
- Reading proficiency
- 29% ▼ -13.00%
- Median HH income
- $49,406
- Composite
- 21.97/100
- National rank
- #8213
- State rank
- #139 of 249 in AZ
Livability — Lake of the Woods
- Score
- 58/100
- State rank
- #206
- US rank
- #20890
Category grades
Schools grade is shown separately in the Schools card above.
Census & demographics
- Census place
- Lake of the Woods, AZ
- Population (ZIP)
- 7,280
Population outlook (Navajo County) Hauer SSP2
- Today (2025)
- 105,760 people
- By 2030
- 103,301 · -2.3%
- By 2040
- 97,070 · -8.2%
- By 2050
- 88,850 · -16.0%
- By 2075
- 65,180 · -38.4%
- By 2100
- 37,281 · -64.7%
Race, ethnicity, and origin ACS 2023
- Neighborhood character
- Predominantly White (75%)
- Race & ethnicity
- White 75% Hispanic / Latino 13% Two or more races 11% Native American 6% Asian 1%
- Hispanic origin (detail)
- Mexican 12%
- Common ancestry
- Slovak 2% Lithuanian 2% Portuguese 2%
- Foreign-born
- 5% · Canada, China
- Languages at home
- 87% English-only · Spanish 8% Chinese 1%
Political lean MEDSL · Navajo
- 2024 margin
- R (+17.2) · D 40.9% · R 58.1%
- 2008→2024 swing
- -5.5pp toward R · 2008: -11.7pp · 2024: -17.2pp
- All cycles
- 2024: R+17.2 2020: R+8.2 2016: R+7.9 2012: R+8.4 2008: R+11.7
Not yet ingested
- Civics
- —
Market trends
- HPI YoY
- ▼ -78.03%
- Current HPI
- 383.9587
- Rent YoY
- —
- Metro
- —
- State GDP YoY
- ▲ 4.54%
- F500 in state
- 20
Industry mix (Fortune 500 HQ in AZ)
| Industry | F500 HQs | Revenue |
|---|---|---|
| Technology | 2 | $13B |
|
||
| Mining / Metals | 1 | $23B |
|
||
| Environmental Services | 1 | $16B |
|
||
| Metals / Steel | 1 | $14B |
|
||
| Technology Distribution | 1 | $9B |
|
||
| Homebuilding | 1 | $8B |
|
||
Price history
-48.1% since first listed15 events — show timeline
- 2026-06-01 Sold (MLS) $70,000 WMMLS
- 2026-05-01 Listed $75,000 WMMLS
- 2025-10-02 Price Changed $45,000 WMMLS
- 2025-07-24 Price Changed $69,000 WMMLS
- 2024-10-07 Price Changed $89,000 WMMLS
- 2023-11-11 Price Changed $15,000 WMMLS
- 2022-07-22 Sold (MLS) $75,000 WMMLS
- 2022-07-01 Delisted — WMMLS
- 2022-07-01 Pending — WMMLS
- 2022-06-28 Price Changed $75,000 WMMLS
- 2022-06-06 Price Changed $97,500 WMMLS
- 2022-04-27 Price Changed $125,000 WMMLS
- 2022-03-31 Relisted — WMMLS
- 2022-03-29 Delisted — WMMLS
- 2022-03-29 Listed $135,000 WMMLS
Cash-flow waterfall
monthlySold comps — $/sqft
last 12 mo · ≤1 miLoading sold comps…