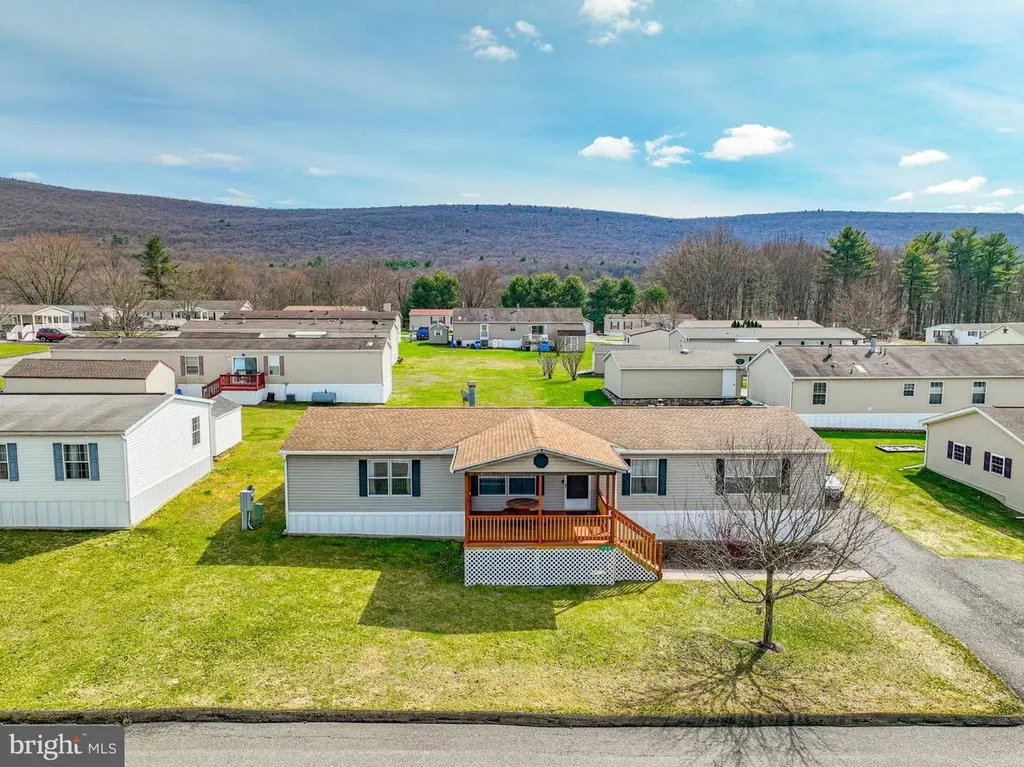
160 Ashley Ln · East Penn, PA
Flood risk 1/10 · Minimal
- FEMA flood zone
- X (unshaded)
- Chance of flooding over 30 yrs
- 0.0%
- Est. flood insurance / yr
- $507 – $1,088
Fire risk 3/10 · Minor
- Est. fire insurance / yr
- $511 – $949
Heat risk 4/10 · Minor
- Hot days now (above 97°F)
- 8 days/yr
- Hot days in 30 yrs
- 17 days/yr
Wind risk 4/10 · Minor
- Chance of severe wind over 30 yrs
- 11.0%
Air-quality risk 2/10 · Minimal
- Unhealthy air days now
- 1 days/yr
- Unhealthy air days in 30 yrs
- 1 days/yr
Risk factors via First Street. Map © Google.
Why this score? — see what drove the C- grade
The composite is a weighted blend of 9 inputs, each scored 0–100. Each bar is that input's sub-score; the figure is the points it added to the 100-point composite (weight × sub-score).
- Cash flow +23.4/30.0
- DSCR +7.5/10.0
- ARV discount +6.1/15.0
- 1% rule +6.0/10.0
- Schools +3.5/10.0
- Rent growth +2.5/5.0
- Livability +2.5/5.0
- Condition / age +2.5/5.0
- Appreciation +0.0/10.0
$162,500
🖨 Deal sheet 📄 Offer letter ✓ Due diligence
Listing remarks
IF YOU'RE LOOKING FOR A Spacious 3-BR, 2-BA, 2005 ranch home nestled in the upper development in Northside Heights Community . . . Look No More . . . it's HERE! This 1,782 sq. ft. Fleetwood home features an open floor plan and spacious rooms allowing you to move freely throughout the home. The spacious open living/family room, expanding the full width of the home, features a corner stone faced propane fireplace, for you to create one living or separate into living and family rooms! Wood cabinets, Formica countertops, tile backsplash, oversize stainless sink, stainless appliances, and a corner built in pantry providing you lots of space for creative cooking! The primary ensuite inlcudes a sp
Key facts
- 8,004 sq ft lot
- 4 parking spots
- Community pool
Property features AI
Finance
- HOA & community: Monthly association recreation fee of $545; Association fee includes water, trash, sewer, and recreation facility; Land lease (monthly land lease $545)
Exterior
- Parking: Off-street parking for 4 (asphalt driveway)
- Utilities: Community water; Community septic tank; Electric available; Propane
- Home design: Manufactured double-wide (Fleetwood); Estimated year built; Building not winterized
- Construction: Vinyl siding; Shingle roof; Crawl space foundation; Above-grade finished living area (approx. 1,782)
- Exterior features: Community pool; Lot dimensions approximately 92' x 88' x 92' x 87'; Not in a federal flood zone; Pets allowed with size/weight restrictions
Interior
- Kitchen: Dishwasher; Gas oven/range; Stainless steel appliances
- Bedrooms: 3 bedrooms on the main level
- Flooring: Carpet; Vinyl
- Bathrooms: 2 full bathrooms on the main level
- Heating & cooling: Forced air heating (oil); Central air conditioning; 200+ amp electric service; Electric hot water
- Interior features: Walk-in closet(s); Gas/Propane fireplace (1)
- Laundry & utility: Main floor laundry
Neighborhood map
What this means for you Summary
Snapshot
- This is a 3-bed/2.0-bath manufactured listed at $162k.
Deal economics
- At list price, monthly cash flow is $301 ($4k/yr) — positive.
- The deal already cash-flows at list — no discount required.
- Meets the 1% rule at list price ($2k rent vs $162k).
- Recommended offer: $160k (1.5% below list) — sets the bar for market timing.
Location & tenants
- Location reads: area grade C — affects rentability + tenant quality, not the cash-flow math above.
- Lehighton Area SD (suburban): math 32% / reading 50% proficiency, ranked #336 of 539 in PA (top 62%) — families likely to look elsewhere, expect single-tenant / working-renter base with shorter leases.
- Market conditions: 139 active listings in the ZIP; 180 units permitted in Carbon County in 2024 (10 in 5+ unit buildings).
Forward outlook
- Local home prices are declining (-3.0%/yr); year-one equity from $1k of loan paydown is wiped out by about $5k of value loss. Plan a longer hold.
- Carbon County population projected at -18% by 2050 — secular population decline; favor cash flow + early exit over multi-decade hold.
Negotiation context
- It's been on market 30 days — a 2% lower offer ($160k) is reasonable based on typical stale-listing flexibility.
- 6 sale attempts since 14y ago with the ask held roughly flat each time — persistent listings suggest the price (not the market) is what's stuck; bring a comps-based counter.
- Current owner paid $75k; list at $162k implies a 117% gain — meaningful room to come down on a strong offer.
Questions for the listing agent
- Is there a deadline driving the sale (1031 exchange, divorce, estate, relocation)? That informs how much negotiation room exists.
- What's the average days-on-market for RENTAL listings here right now (not sales)? A rising rental-DOM trend means longer vacancies and softer asking-rent achievability than the comps imply.
- What's the recent tenant-quality profile in this submarket — average credit score on applications, eviction rate, late-payment / NSF rate, and stable-employment percentage? A property-management company in the area should have these aggregated.
- How much new for-sale + rental construction is in the pipeline within 1–3 miles? Heavy new supply typically softens prices + rents 12–24 months out; constrained supply supports both.
Investment metrics
- 1% rule
- 1.10% ✓
- Cap rate
- 8.51%
- Cash-on-cash
- 7.93%
- DSCR
- 1.35
- GRM
- 7.6
CMA / ARV
- ARV (median comp)
- $157,605
- List price
- $162,500
- Delta
- 3.11%
- Verdict
- FAIR
- Comps
- 20 within 1.0 mi
Show comp detail 5 sales within ~0.75 mi
| Address | Dist | Beds/Ba | Sqft | Sold | Price | $/sf | Match |
|---|---|---|---|---|---|---|---|
| 104 Kaysea Ln Lot 104 | 0.15mi | 3/2.0 | 1,706 (-4%) | 5mo | $165,000 | $97 | 82 |
| 48 Shelby Dr Lot 48 | 0.23mi | 3/2.0 | 1,848 (+4%) | 17mo | $100,000 | $54 | 69 |
| 193 Nick Ln | 0.28mi | 3/2.0 | 1,680 (-6%) | 13mo | $190,000 | $113 | 66 |
| 223 Jennifer Ln Lot 223 | 0.14mi | 3/2.0 | 1,568 (-12%) | 21mo | $150,000 | $96 | 56 |
| 181 Ashley Ln #181 | 0.21mi | 3/2.0 | 1,568 (-12%) | 19mo | $160,000 | $102 | 54 |
Match score weights: distance 35% · size 25% · config 20% · recency 20%. Top-matched comps best support the ARV.
Projected returns pro-forma
-3.0% appreciation · 3.0% rent growth · sell at horizon
- IRR
- -4.2%
- Equity multiple
- 0.84×
- Total profit
- $-7,167
- Equity at exit
- $24,229
- IRR
- 5.5%
- Equity multiple
- 1.41×
- Total profit
- $18,485
- Equity at exit
- $14,050
Cash invested: $45,500 (down + closing). Projections, not guarantees.
Landlord ↔ Tenant lean methodology
- Overall (STATE)
- 62 Landlord-Friendly
- State Pennsylvania
- 62 Landlord-Friendly · EVEN
- County
- — inherits STATE
- City
- — inherits STATE
ZIP-level market 18235
- Home prices YoY
- -27.1%
- Active inventory
- 139
- Price-to-rent
- 7.6×
Monthly cashflow live
- Estimated rent
- $1,782 medium interval (Pro) →
- Mortgage (P&I)
- −$852
- Tax from tax record
- −$187 /mo · $2,247/yr
- Insurance
- −$68
- HOA
- −$0
- Vacancy / Maint / Mgmt
- −$374
- Net cashflow
- $301
Break-even live
UW: 25.0% down · 7.5% · 30yr · 1.5% tax · 5.0% vac · 8.0% maint · 8.0% mgmt
Financing live
Cash to close
- Down payment
- $40,625
- Closing costs
- $4,875
- Reserves months
- —
- Total cash needed
- —
Loan-product check · same deal, 3 products live
Conventional
25% down · 7.5% · 30yr
- Down + closing
- —
- Monthly P&I
- —
- Monthly cashflow
- —
- DSCR
- —
- Eligible?
- —
Personal DTI + credit; lowest rate.
DSCR
20% down · 8.5% · 30yr
- Down + closing
- —
- Monthly P&I
- —
- Monthly cashflow
- —
- DSCR
- —
- Eligible?
- —
No personal income docs; deal must DSCR.
Hard money
10% down · 12.0% · 12mo
- Down + closing
- —
- Monthly P&I
- —
- Monthly cashflow
- —
- DSCR
- —
- Eligible?
- —
Short-term bridge; refi at stabilization.
Listing history 16 events
-
2026-06-07statusdays on market $162,500 Pending 30 DOM
-
2026-06-03days on market $162,500 Active 28 DOM
-
2026-06-02days on market $162,500 Active 27 DOM
-
2026-06-01days on market $162,500 Active 26 DOM
-
2026-05-31days on market $162,500 Active 25 DOM
-
2026-05-31days on market $162,500 Active 24 DOM
-
2026-05-06$162,500 Active 2028-char remark
-
2026-05-04historical
-
2026-04-13price $165,000
-
2026-04-12price $165,000
-
2026-03-20$170,000 Active
-
2026-03-20$170,000 Active
-
2019-07-01soldstatus $75,000
-
2018-08-08$79,000
-
2012-12-06$69,500
-
2012-12-03$69,500
ⓘ Source: listings_history table (triggers on properties + properties_extension) + one-shot
backfill from property_details.listing_events for pre-trigger history.
Tax reassessment forecast PA · Partial reset (capped growth)
- Current annual tax
- $2,247 · $187/mo
- Projected year-2 tax
- $2,407 · $201/mo
- Expected delta
- +$160/yr (+$13/mo · 7.1%)
ⓘ Screening estimate from a state-policy table — verify with the county assessor before closing.
Climate risk First Street
- Flood 1/10 Low FEMA zone X (unshaded) · 0% chance over 30 yrs
- Wildfire 3/10 Moderate
- Heat 4/10 Moderate 8 d/yr ≥97°F today · 17 d/yr by 30 yrs out
- Wind 4/10 Moderate 11% chance of damaging wind over 30 yrs
- Air quality 2/10 Low 1 unhealthy d/yr today · 1 by 30 yrs out
Nearby sold comps map
Loading sold comps map…
Walkable amenities ~0.75 mi
Loading nearby amenities…
Taxation est. · year 1
- Rental income
- $21,384
- − Mortgage interest
- −$9,103
- − Property taxes
- −$2,247
- − Insurance
- −$812
- − Repairs & maintenance
- −$1,711
- − Management
- −$1,711
- − Depreciation
- −$4,727
- Taxable income
- $1,073
- Est. tax owed @ 24.0%
- −$258
- After-tax cash flow
- $3,350/yr
For passive investors: Depreciation is non-cash, so a rental often shows a tax loss while cash-flowing — sheltering income. Rental losses are passive: they offset passive income freely, and up to $25,000/yr can offset ordinary (W-2) income if you actively participate and your MAGI is under $100k (phasing out to $0 by $150k); unused losses carry forward. On sale, claimed depreciation is recaptured at up to 25%, and gains may owe capital-gains tax (a 1031 exchange can defer both). Figures are a year-1 estimate at your 24.0% rate — not tax advice; consult a CPA.
Schools (NCES district)
- District
- Lehighton Area SD
- NCES district ID
- 4213500
- Math proficiency
- 32% ▼ -7.00%
- Reading proficiency
- 50% ▼ -11.00%
- Median HH income
- $51,115
- Composite
- 35.36/100
- National rank
- #4958
- State rank
- #336 of 539 in PA
Livability — East Penn
No livability data for this city. (Only ~50 U.S. cities are tracked.)
Census & demographics
- Population (ZIP)
- 19,121
Population outlook (Carbon County) Hauer SSP2
- Today (2025)
- 61,643 people
- By 2030
- 59,840 · -2.9%
- By 2040
- 55,413 · -10.1%
- By 2050
- 50,843 · -17.5%
- By 2075
- 43,326 · -29.7%
- By 2100
- 37,126 · -39.8%
Race, ethnicity, and origin ACS 2023
- Neighborhood character
- Predominantly White (94%)
- Race & ethnicity
- White 94% Two or more races 4% Hispanic / Latino 3%
- Common ancestry
- Romanian 6% Polish 5% Iranian 3%
- Foreign-born
- 2% · Canada, China
- Languages at home
- 96% English-only · Spanish 2% Russian/Polish/Slavic 1%
Political lean MEDSL · Carbon
- 2024 margin
- Solid R (+34.8) · D 32.2% · R 67.0%
- 2008→2024 swing
- -36.7pp toward R · 2008: 1.9pp · 2024: -34.8pp
- All cycles
- 2024: R+34.8 2020: R+32.0 2016: R+34.1 2012: R+6.9 2008: D+1.9
Not yet ingested
- Civics
- —
Market trends
- HPI YoY
- ▼ -69.77%
- Current HPI
- 187.4645
- Rent YoY
- —
- Metro
- —
- State GDP YoY
- ▲ 1.68%
- F500 in state
- 34
Industry mix (Fortune 500 HQ in PA)
| Industry | F500 HQs | Revenue |
|---|---|---|
| Healthcare | 2 | $309B |
|
||
| Insurance | 2 | $27B |
|
||
| Telecommunications / Media | 1 | $124B |
|
||
| Industrial Distribution | 1 | $22B |
|
||
| Financial Services | 1 | $20B |
|
||
| Chemicals / Materials | 1 | $18B |
|
||
Price history
+133.8% since first listed11 events — show timeline
- 2026-06-06 Pending — BRIGHT MLS
- 2026-05-06 Listed $162,500 BRIGHT MLS
- 2026-05-04 Listing Removed — BRIGHT MLS
- 2026-04-13 Price Changed $165,000 BRIGHT MLS
- 2026-04-12 Price Changed $165,000 PMAR
- 2026-03-20 Listed $170,000 BRIGHT MLS
- 2026-03-20 Listed $170,000 PMAR
- 2019-07-01 Sold (MLS) $75,000 GLVRMLS
- 2018-08-08 Listed $79,000 GLVRMLS
- 2012-12-06 Listed $69,500 GLVRMLS
- 2012-12-03 Listed $69,500 PMAR
Property tax history
+1.4%/yrLatest (2026): $2,247 · +0.8% YoY. Source: county tax records.
Cash-flow waterfall
monthlySold comps — $/sqft
last 12 mo · ≤1 miLoading sold comps…