2015 6th Ave Spc 9 #9 · Clarkston Heights-Vineland, WA
Flood risk 1/10 · Minimal
- FEMA flood zone
- X
- Chance of flooding over 30 yrs
- 0.0%
- Est. flood insurance / yr
- $507 – $1,088
Fire risk 3/10 · Minor
- Est. fire insurance / yr
- $604 – $1,122
Heat risk 4/10 · Minor
- Hot days now (above 100°F)
- 6 days/yr
- Hot days in 30 yrs
- 12 days/yr
Wind risk 1/10 · Minimal
- Chance of severe wind over 30 yrs
- —
Air-quality risk 8/10 · Major
- Unhealthy air days now
- 12 days/yr
- Unhealthy air days in 30 yrs
- 17 days/yr
Risk factors via First Street. Map © Google.
Why this score? — see what drove the B+ grade
The composite is a weighted blend of 9 inputs, each scored 0–100. Each bar is that input's sub-score; the figure is the points it added to the 100-point composite (weight × sub-score).
- Cash flow +30.0/30.0
- ARV discount +15.0/15.0
- 1% rule +10.0/10.0
- DSCR +10.0/10.0
- Schools +4.2/10.0
- Rent growth +2.5/5.0
- Livability +2.5/5.0
- Condition / age +2.5/5.0
- Appreciation +0.0/10.0
$85,000
🖨 Deal sheet 📄 Offer letter ✓ Due diligence
Listing remarks
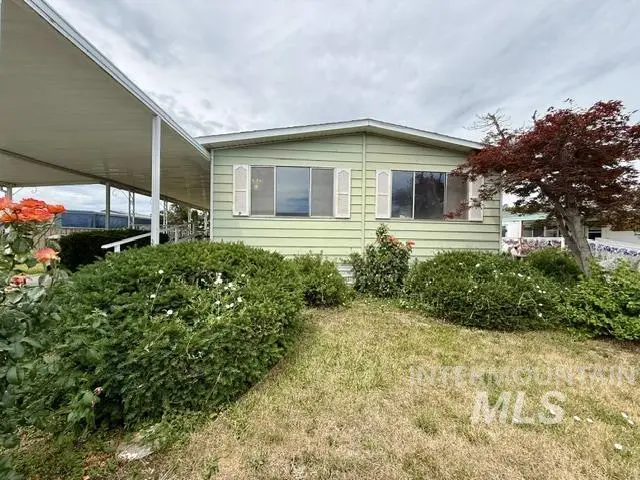
The most affordable place to live is here! Spacious double wide home in Clarkston Heights 55+ manufactured home park. Extra large lot with storage shed and raised garden beds. Lots of roses to pick! You enjoy evenings on the covered patio complete with double car carport & ramp. Spacious home offers new carpeting just installed in huge living room with formal dining area & built in hutch. Bright & cheery kitchen even has a built in cutting board, breakfast bar, double ovens too. All appliances are included. Giant primary suite with large tub & shower. Second bedroom & bath adjacent.
Key facts
- New carpeting
- Raised garden beds
- Extra large lot
Tags
Property features AI
Exterior
- Parking: Attached parking; Carport with 2 covered spaces (total parking for 2)
- Utilities: Sewer connected
- Home design: Mobile/manufactured home on a rented lot; Built in 1977
- Construction: Accessible approach with ramp
- Exterior features: Metal fencing; Covered patio/deck; Paved road access; Accessible approach with ramp
Interior
- Kitchen: Double oven; Built-in oven/range; Dishwasher
- Bedrooms: 2 bedrooms on the main level
- Flooring: Carpet; Vinyl sheet
- Bathrooms: 2 bathrooms
- Heating & cooling: Forced air heating (natural gas); Central air conditioning
- Interior features: Family room; Double vanity; Breakfast bar; Laminate counters
- Laundry & utility: Washer; Dryer; Utility room on the main level; Electric water heater
Neighborhood map
What this means for you Summary
Snapshot
- This is a 2-bed/2.0-bath manufactured listed at $85k.
Deal economics
- At list price, monthly cash flow is $507 ($6k/yr) — positive.
- The deal already cash-flows at list — no discount required.
- Meets the 1% rule at list price ($1k rent vs $85k).
- Cap rate 13.5% vs local median 1.4% in Clarkston Heights-Vineland — top-decile yield for the area; either an underpriced asset or a hidden risk that comps aren't pricing in. Stress-test before assuming the spread holds.
Location & tenants
- Location reads: area grade B — affects rentability + tenant quality, not the cash-flow math above.
- Clarkston School District (suburban): math 38% / reading 57% proficiency, ranked #172 of 291 in WA (top 59%) — families likely to look elsewhere, expect single-tenant / working-renter base with shorter leases.
- Zoned schools: Heights Elementary (361 students, 45% FRL).
- Market conditions: 249 active listings in the ZIP; 101 units permitted in Asotin County in 2024 (72 in 5+ unit buildings).
Forward outlook
- Local home prices are declining (-3.0%/yr); year-one equity from $588 of loan paydown is wiped out by about $3k of value loss. Plan a longer hold.
- Asotin County population projected to shrink 3% by 2050 — rents likely to lag national; underwrite the cash flow, not the appreciation.
- At projected returns (-3.0% appreciation + 3.0% rent growth), your $24k cash investment doubles in ~5 years — after that, you're playing with house money.
Negotiation context
- Only 10 days on market — expect competitive offers; lowballing is unlikely to land.
Questions for the listing agent
- Built in 1977 — when were the roof, HVAC, electrical panel, plumbing, and water heater last replaced?
- Is there a deadline driving the sale (1031 exchange, divorce, estate, relocation)? That informs how much negotiation room exists.
- What's the average days-on-market for RENTAL listings here right now (not sales)? A rising rental-DOM trend means longer vacancies and softer asking-rent achievability than the comps imply.
- What's the recent tenant-quality profile in this submarket — average credit score on applications, eviction rate, late-payment / NSF rate, and stable-employment percentage? A property-management company in the area should have these aggregated.
- How much new for-sale + rental construction is in the pipeline within 1–3 miles? Heavy new supply typically softens prices + rents 12–24 months out; constrained supply supports both.
Investment metrics
- 1% rule
- 1.54% ✓
- Cap rate
- 13.45%
- Cash-on-cash
- 25.56%
- DSCR
- 2.14
- GRM
- 5.4
CMA / ARV
- ARV (on-the-fly)
- $127,488
- Comps found
- 10
Show comp detail 10 sales within ~0.75 mi
| Address | Dist | Beds/Ba | Sqft | Sold | Price | $/sf | Match |
|---|---|---|---|---|---|---|---|
| 2015 6th Ave #308 | 0.11mi | 2/2.0 | 1,512 (-2%) | 3mo | $99,500 | $66 | 90 |
| 2115 6th Ave #7 | 0.11mi | 2/2.0 | 1,440 (-6%) | 2mo | $119,999 | $83 | 83 |
| 2015 6th Ave #11 | 0.00mi | 2/2.0 | 1,456 (-5%) | 13mo | $81,400 | $56 | 81 |
| 2115 6th Ave #18 | 0.11mi | 3/2.0 (+1) | 1,512 (-2%) | 11mo | $145,000 | $96 | 78 |
| 2015 6th Ave Unit 161A | 0.00mi | 3/2.0 (+1) | 1,456 (-5%) | 10mo | $75,000 | $52 | 78 |
| 2175 9th Ave | 0.12mi | 3/2.0 (+1) | 1,568 (+2%) | 22mo | $345,000 | $220 | 68 |
| 2015 6th Ave Unit 127A | 0.00mi | 3/2.0 (+1) | 1,440 (-6%) | 23mo | $86,500 | $60 | 65 |
| 2115 6th Ave Spc 48 | 0.11mi | 3/2.0 (+1) | 1,716 (+12%) | 8mo | $149,000 | $87 | 64 |
| 2115 6th Ave Unit #45 Ave | 0.11mi | 2/2.0 | 1,344 (-12%) | 21mo | $79,000 | $59 | 57 |
| 2141 6th Ave | 0.12mi | 2/2.0 | 1,752 (+14%) | 18mo | $340,000 | $194 | 55 |
Match score weights: distance 35% · size 25% · config 20% · recency 20%. Top-matched comps best support the ARV.
Projected returns pro-forma
-3.0% appreciation · 3.0% rent growth · sell at horizon
- IRR
- 19.1%
- Equity multiple
- 1.78×
- Total profit
- $18,502
- Equity at exit
- $12,674
- IRR
- 27.5%
- Equity multiple
- 3.42×
- Total profit
- $57,624
- Equity at exit
- $7,349
Cash invested: $23,800 (down + closing). Projections, not guarantees.
Landlord ↔ Tenant lean methodology
- Overall (STATE)
- 28 Tenant-Leaning
- State Washington
- 28 Tenant-Leaning · D+8
- County
- — inherits STATE
- City
- — inherits STATE
ZIP-level market 99403
- Active inventory
- 249
- Price-to-rent
- 5.4×
Monthly cashflow live
- Estimated rent
- $1,309 medium interval (Pro) →
- Mortgage (P&I)
- −$446
- Tax from tax record
- −$46 /mo · $554/yr
- Insurance
- −$35
- HOA
- −$0
- Vacancy / Maint / Mgmt
- −$275
- Net cashflow
- $507
Break-even live
UW: 25.0% down · 7.5% · 30yr · 1.5% tax · 5.0% vac · 8.0% maint · 8.0% mgmt
Financing live
Cash to close
- Down payment
- $21,250
- Closing costs
- $2,550
- Reserves months
- —
- Total cash needed
- —
Loan-product check · same deal, 3 products live
Conventional
25% down · 7.5% · 30yr
- Down + closing
- —
- Monthly P&I
- —
- Monthly cashflow
- —
- DSCR
- —
- Eligible?
- —
Personal DTI + credit; lowest rate.
DSCR
20% down · 8.5% · 30yr
- Down + closing
- —
- Monthly P&I
- —
- Monthly cashflow
- —
- DSCR
- —
- Eligible?
- —
No personal income docs; deal must DSCR.
Hard money
10% down · 12.0% · 12mo
- Down + closing
- —
- Monthly P&I
- —
- Monthly cashflow
- —
- DSCR
- —
- Eligible?
- —
Short-term bridge; refi at stabilization.
Listing history 8 events
-
2026-06-19days on market $85,000 Active 10 DOM
-
2026-06-18days on market $85,000 Active 9 DOM
-
2026-06-17days on market $85,000 Active 8 DOM
-
2026-06-16days on market $85,000 Active 7 DOM
-
2026-06-15days on market $85,000 Active 6 DOM
-
2026-06-14days on market $85,000 Active 4 DOM
-
2026-06-12remarks 601-char remark
-
2026-06-12$85,000 Active 3 DOM
ⓘ Source: listings_history table (triggers on properties + properties_extension) + one-shot
backfill from property_details.listing_events for pre-trigger history.
Tax reassessment forecast WA · Resets to sale price
- Current annual tax
- $554 · $46/mo
- Projected year-2 tax
- $833 · $69/mo
- Expected delta
- +$279/yr (+$23/mo · 50.2%)
ⓘ Screening estimate from a state-policy table — verify with the county assessor before closing.
Climate risk First Street
- Flood 1/10 Low FEMA zone X · 0% chance over 30 yrs
- Wildfire 3/10 Moderate
- Heat 4/10 Moderate 6 d/yr ≥100°F today · 12 d/yr by 30 yrs out
- Wind 1/10 Low
- Air quality 8/10 Severe 12 unhealthy d/yr today · 17 by 30 yrs out
Nearby sold comps map
Loading sold comps map…
Walkable amenities ~0.75 mi
Loading nearby amenities…
Taxation est. · year 1
- Rental income
- $15,712
- − Mortgage interest
- −$4,761
- − Property taxes
- −$554
- − Insurance
- −$425
- − Repairs & maintenance
- −$1,257
- − Management
- −$1,257
- − Depreciation
- −$2,473
- Taxable income
- $4,985
- Est. tax owed @ 24.0%
- −$1,196
- After-tax cash flow
- $4,888/yr
For passive investors: Depreciation is non-cash, so a rental often shows a tax loss while cash-flowing — sheltering income. Rental losses are passive: they offset passive income freely, and up to $25,000/yr can offset ordinary (W-2) income if you actively participate and your MAGI is under $100k (phasing out to $0 by $150k); unused losses carry forward. On sale, claimed depreciation is recaptured at up to 25%, and gains may owe capital-gains tax (a 1031 exchange can defer both). Figures are a year-1 estimate at your 24.0% rate — not tax advice; consult a CPA.
Schools (NCES district)
- District
- Clarkston School District
- NCES district ID
- 5301320
- Math proficiency
- 38% ▼ -4.00%
- Reading proficiency
- 57% ▲ 1.00%
- Median HH income
- $42,030
- Composite
- 42.03/100
- National rank
- #7065
- State rank
- #172 of 291 in WA
Livability — Clarkston Heights-Vineland
No livability data for this city. (Only ~50 U.S. cities are tracked.)
Census & demographics
- Census place
- Clarkston Heights-Vineland, WA
- Population (ZIP)
- 20,483
Population outlook (Asotin County) Hauer SSP2
- Today (2025)
- 22,623 people
- By 2030
- 22,746 · +0.5%
- By 2040
- 22,597 · -0.1%
- By 2050
- 21,947 · -3.0%
- By 2075
- 19,478 · -13.9%
- By 2100
- 16,206 · -28.4%
Race, ethnicity, and origin ACS 2023
- Neighborhood character
- Predominantly White (87%)
- Race & ethnicity
- White 87% Two or more races 6% Hispanic / Latino 5% Native American 1% Asian 1%
- Common ancestry
- Portuguese 3% Lithuanian 2% Slovak 2%
- Foreign-born
- 2% · Canada
- Languages at home
- 97% English-only · Spanish 2% Tagalog/Filipino 1%
Political lean MEDSL · Asotin
- 2024 margin
- Strong R (+25.6) · D 35.8% · R 61.5% · Other 2.7%
- 2008→2024 swing
- -12.2pp toward R · 2008: -13.4pp · 2024: -25.6pp
- All cycles
- 2024: R+25.6 2020: R+25.7 2016: R+26.8 2012: R+16.7 2008: R+13.4
Not yet ingested
- Civics
- —
Market trends
- HPI YoY
- ▼ -346.91%
- Current HPI
- 173.3027
- Rent YoY
- —
- Metro
- —
- State GDP YoY
- ▲ 4.65%
- F500 in state
- 22
Industry mix (Fortune 500 HQ in WA)
| Industry | F500 HQs | Revenue |
|---|---|---|
| Retail | 2 | $269B |
|
||
| Technology / Retail | 1 | $638B |
|
||
| Technology | 1 | $245B |
|
||
| Telecommunications | 1 | $38B |
|
||
| Food / Beverage | 1 | $36B |
|
||
| Automotive / Trucks | 1 | $34B |
|
||
Price history
1 event — show timeline
- 2026-06-09 Listed $85,000 IMLS
Property tax history
+22.0%/yrLatest (2025): $554 · +213.2% YoY. Source: county tax records.
Cash-flow waterfall
monthlySold comps — $/sqft
last 12 mo · ≤1 miLoading sold comps…