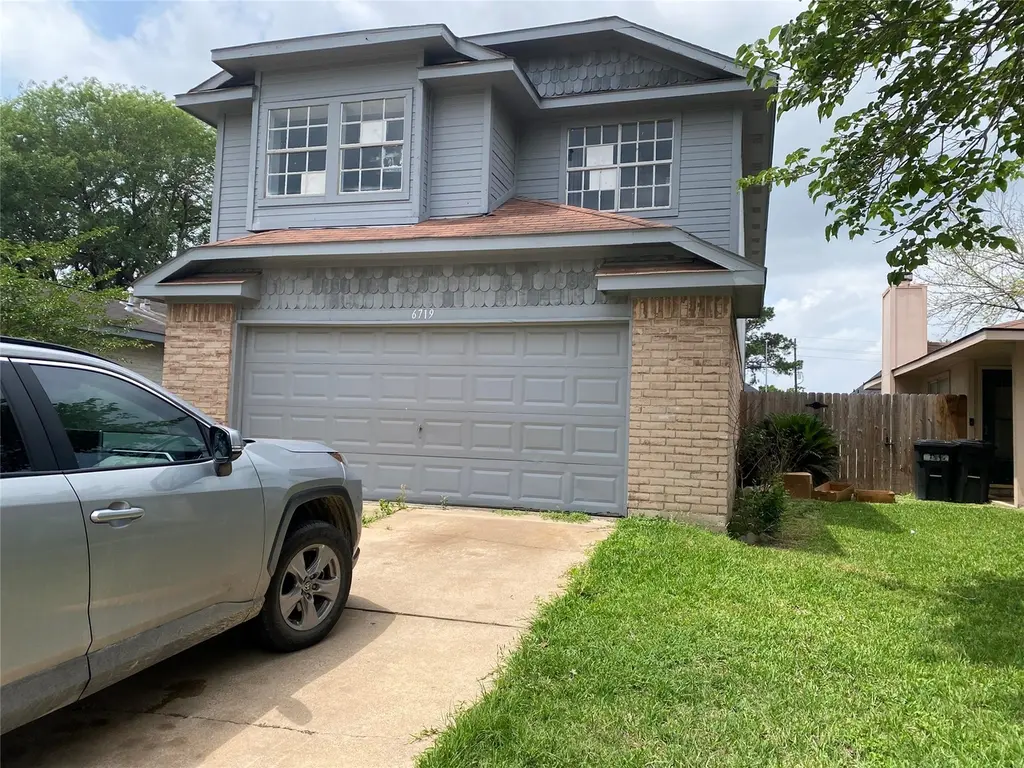
6719 Misty Dale Dr · Houston, TX
Flood risk 1/10 · Minimal
- FEMA flood zone
- X (unshaded)
- Chance of flooding over 30 yrs
- 0.0%
- Est. flood insurance / yr
- $507 – $1,088
Fire risk 1/10 · Minimal
- Est. fire insurance / yr
- $1,222 – $2,270
Heat risk 9/10 · Severe
- Hot days now (above 110°F)
- 7 days/yr
- Hot days in 30 yrs
- 23 days/yr
Wind risk 9/10 · Severe
- Chance of severe wind over 30 yrs
- 99.0%
Air-quality risk 2/10 · Minimal
- Unhealthy air days now
- 2 days/yr
- Unhealthy air days in 30 yrs
- 2 days/yr
Risk factors via First Street. Map © Google.
Why this score? — see what drove the C+ grade
The composite is a weighted blend of 9 inputs, each scored 0–100. Each bar is that input's sub-score; the figure is the points it added to the 100-point composite (weight × sub-score).
- Cash flow +18.3/30.0
- ARV discount +15.0/15.0
- 1% rule +6.5/10.0
- DSCR +5.8/10.0
- Appreciation +4.4/10.0
- Schools +4.4/10.0
- Livability +3.7/5.0
- Condition / age +2.5/5.0
- Rent growth +1.8/5.0
$157,500
🖨 Deal sheet 📄 Offer letter ✓ Due diligence
Listing remarks
Multiple offers received, please submit your highest and best by Sunday, 5/10/2026. 3 bedrooms, 2.5 bathrooms plus a 2-car attached garage. Great floorplan! The spacious family room boasts tile flooring, a high ceiling and cozy fireplace with brick surround. Granite countertops and large breakfast bar in the kitchen. All bedrooms are conveniently located upstairs. Private backyard with a patio area. Autumn Run is an established community in the Cy-Fair school district. Community amenities include a swimming pool and tennis courts. Close to dining, shopping, entertainment and medical facilities. Selling as it, owner makes no repairs. Make your showing appointment today!
Key facts
- 4,199 sq ft lot
- 2 garage spots
- Community pool
Property features AI
Finance
- Other: Lease not considered
- HOA & community: Autumn Run homeowners association; Annual HOA fee of $550 covering recreation facilities; Community pool
Exterior
- Parking: Attached 2-car garage
- Utilities: Public water; Public sewer
- Home design: Residential property; Built in 1984; Slab foundation; Composition roof
- Construction: Brick, cement siding, and wood siding exterior
- Exterior features: Subdivision lot; Lot approx. 4,200 sq ft
Interior
- Kitchen: Kitchen on the first floor (approx. 12x10); Includes dishwasher and disposal
- Bedrooms: Primary bedroom on the second floor (approx. 13x14); Two additional bedrooms on the second floor (each approx. 12x12)
- Bathrooms: 2 full bathrooms; 1 half bathroom
- Heating & cooling: Central electric heating; Central air conditioning (electric)
- Interior features: Free-standing gas stove fireplace; Dishwasher; Garbage disposal; 6 total rooms
Neighborhood map
What this means for you Summary
Snapshot
- This is a 3-bed/2.0-bath single-family listed at $158k.
Deal economics
- At list price, monthly cash flow is $145 ($2k/yr) — positive.
- The deal already cash-flows at list — no discount required.
- Meets the 1% rule at list price ($2k rent vs $158k).
- Cap rate 7.4% vs local median 3.2% in Houston — top-decile yield for the area; either an underpriced asset or a hidden risk that comps aren't pricing in. Stress-test before assuming the spread holds.
Location & tenants
- Location reads 74/100 on livability (#184 in TX, #4,771 nationally) — a middle-class / working-renter tenant base. Strengths: amenities A+, cost of living A+, housing A+; Watch: crime F.
- Cypress-Fairbanks ISD (suburban): math 45% / reading 52% proficiency, ranked #161 of 826 in TX (top 20%) — families likely to look elsewhere, expect single-tenant / working-renter base with shorter leases.
- Zoned schools: Kahla Middle (math 33% / reading 40%, grade F, #786 of 1,662 statewide, top 48%, 1,176 students, 82% FRL); Cypress Springs H S (math 35% / reading 60%, grade D, #583 of 1,632 statewide, top 36%, 2,788 students, 68% FRL) — zoned schools average 75% FRL vs 43% district-wide (32 pts higher); higher-poverty schools than district average — tighter screening recommended.
- Market conditions: Rents soft (-2.9%/yr); 744 active listings in the ZIP; 39 comparable units currently listed for rent nearby; rentals at typical pace (median 18d on market — plan ~3-4 weeks tenant-placement turnaround); solid renter incomes; 29,883 units permitted in Harris County in 2024 (8,621 in 5+ unit buildings).
Forward outlook
- Local home prices are declining (-1.3%/yr); year-one equity from $1k of loan paydown is wiped out by about $2k of value loss. Plan a longer hold.
- Harris County population projected at +47% by 2050 — long-run rental-demand tailwind backs the buy-and-hold thesis.
Negotiation context
- Only 7 days on market — expect competitive offers; lowballing is unlikely to land.
- 7 sale attempts since 13y ago with the ask held roughly flat each time — persistent listings suggest the price (not the market) is what's stuck; bring a comps-based counter.
Risks & watch-outs
- Watch-outs: property tax is 2.6% of price.
- Climate carrying-cost: severe wind risk, 99% chance of damaging wind over 30y; extreme-heat days projected 7→23/yr by 2055 (HVAC capex compounding) — expect insurance premiums to compound above CPI over the hold.
Questions for the listing agent
- Property tax is high relative to price — has the assessment been appealed recently, and will the sale trigger a re-assessment?
- What does the HOA fee cover, when was the last increase, and are there any pending special assessments or reserve-fund shortfalls?
- Is there a deadline driving the sale (1031 exchange, divorce, estate, relocation)? That informs how much negotiation room exists.
- Schools are D-rated, which usually means shorter tenancies and higher turnover. Who's the typical renter profile here, and what's been the actual vacancy rate?
- Crime grade is F in this area — have there been break-ins, vandalism, or insurance claims at this property in the last 3 years? What carrier currently insures it and at what premium?
- What's the average days-on-market for RENTAL listings here right now (not sales)? A rising rental-DOM trend means longer vacancies and softer asking-rent achievability than the comps imply.
- What's the recent tenant-quality profile in this submarket — average credit score on applications, eviction rate, late-payment / NSF rate, and stable-employment percentage? A property-management company in the area should have these aggregated.
- How much new for-sale + rental construction is in the pipeline within 1–3 miles? Heavy new supply typically softens prices + rents 12–24 months out; constrained supply supports both.
Investment metrics
- 1% rule
- 1.15% ✓
- Cap rate
- 7.40%
- Cash-on-cash
- 3.95%
- DSCR
- 1.18
- GRM
- 7.3
CMA / ARV
- ARV (on-the-fly)
- $224,188
- Comps found
- 12
Show comp detail 12 sales within ~0.75 mi
| Address | Dist | Beds/Ba | Sqft | Sold | Price | $/sf | Match |
|---|---|---|---|---|---|---|---|
| 6719 Misty Dale Dr | 0.00mi | 3/2.5 | 1,367 (0%) | 0mo | $157,500 | $115 | 98 |
| 18319 Willow Moss Dr | 0.24mi | 3/2.0 | 1,340 (-2%) | 0mo | $220,000 | $164 | 85 |
| 6703 Dewcrest Dr | 0.06mi | 3/2.0 | 1,238 (-9%) | 1mo | $209,000 | $169 | 81 |
| 7011 Livery Ln | 0.52mi | 3/2.0 | 1,300 (-5%) | 2mo | $219,999 | $169 | 66 |
| 6843 Drewlaine Fields Ln | 0.38mi | 3/2.0 | 1,524 (+12%) | 4mo | $200,000 | $131 | 60 |
| 6810 Heather Hollow Dr | 0.27mi | 4/2.0 (+1) | 1,176 (-14%) | 4mo | $244,000 | $207 | 56 |
| 17731 Wild Willow Ln | 0.71mi | 3/2.0 | 1,434 (+5%) | 5mo | $230,000 | $160 | 55 |
| 17911 Poppy Trails Ln | 0.59mi | 3/2.0 | 1,505 (+10%) | 2mo | $210,000 | $140 | 54 |
| 18511 Headland Dr | 0.66mi | 3/2.0 | 1,213 (-11%) | 3mo | $228,000 | $188 | 48 |
| 17702 Poppy Trails Ln | 0.74mi | 3/2.0 | 1,510 (+10%) | 1mo | $250,000 | $166 | 47 |
| 17902 Autumn Hills Dr | 0.62mi | 3/2.0 | 1,572 (+15%) | 4mo | $229,990 | $146 | 43 |
| 18630 Andalusian Dr | 0.61mi | 2/1.0 (-1) | 1,184 (-13%) | 1mo | $194,000 | $164 | 40 |
Match score weights: distance 35% · size 25% · config 20% · recency 20%. Top-matched comps best support the ARV.
Projected returns pro-forma
-1.27% appreciation · 0.0% rent growth · sell at horizon
- IRR
- -5.3%
- Equity multiple
- 0.78×
- Total profit
- $-9,686
- Equity at exit
- $35,981
- IRR
- -1.6%
- Equity multiple
- 0.87×
- Total profit
- $-5,527
- Equity at exit
- $36,073
Cash invested: $44,100 (down + closing). Projections, not guarantees.
Landlord ↔ Tenant lean methodology
- Overall (STATE)
- 87 Strongly Landlord-Friendly
- State Texas
- 87 Strongly Landlord-Friendly · R+5
- County
- — inherits STATE
- City
- — inherits STATE
ZIP-level market 77449
- Home prices YoY
- -0.5%
- Rents YoY
- -2.9%
- Active inventory
- 744
- Price-to-rent
- 7.3×
Monthly cashflow live
- Estimated rent
- $1,806 high interval (Pro) →
- Mortgage (P&I)
- −$826
- Tax from tax record
- −$344 /mo · $4,134/yr
- Insurance
- −$66
- HOA
- −$46
- Vacancy / Maint / Mgmt
- −$379
- Net cashflow
- $145
Break-even live
UW: 25.0% down · 7.5% · 30yr · 1.5% tax · 5.0% vac · 8.0% maint · 8.0% mgmt
Financing live
Cash to close
- Down payment
- $39,375
- Closing costs
- $4,725
- Reserves months
- —
- Total cash needed
- —
Loan-product check · same deal, 3 products live
Conventional
25% down · 7.5% · 30yr
- Down + closing
- —
- Monthly P&I
- —
- Monthly cashflow
- —
- DSCR
- —
- Eligible?
- —
Personal DTI + credit; lowest rate.
DSCR
20% down · 8.5% · 30yr
- Down + closing
- —
- Monthly P&I
- —
- Monthly cashflow
- —
- DSCR
- —
- Eligible?
- —
No personal income docs; deal must DSCR.
Hard money
10% down · 12.0% · 12mo
- Down + closing
- —
- Monthly P&I
- —
- Monthly cashflow
- —
- DSCR
- —
- Eligible?
- —
Short-term bridge; refi at stabilization.
Rent comps 39 comps
| Address | Beds | Baths | Sqft | Rent | $/sqft | DOM | Units | Dist |
|---|---|---|---|---|---|---|---|---|
| 18319 Autumn Trails Ln Katy, TX | 3.0 | 2.5 | 1580 | $1,845 | $1.17 | 22d | 1 | 0.27mi |
| 18311 Autumn Trails Ln Katy, TX | 3.0 | 2.0 | 1538 | $1,779 | $1.16 | 7d | 1 | 0.28mi |
| 18531 Lippizaner Dr Cypress, TX | 4.0 | 2.0 | 1692 | $1,799 | $1.06 | 22d | 1 | 0.53mi |
| 18723 Lippizaner Dr Cypress, TX | 3.0 | 2.0 | 1274 | $1,750 | $1.37 | 11d | 1 | 0.57mi |
| 18723 Lippizaner Dr Cypress, TX | 3.0 | 2.0 | 1274 | $1,750 | $1.37 | 7d | 1 | 0.57mi |
| 7323 Livery Ln Cypress, TX | 3.0 | 2.0 | 1516 | $1,780 | $1.17 | 22d | 1 | 0.71mi |
| 17719 Glenpatti Dr Houston, TX | 3.0 | 2.0 | 1402 | $1,669 | $1.19 | 7d | 1 | 0.73mi |
| 17807 Northway Ct Houston, TX | 3.0 | 2.0 | 1144 | $1,700 | $1.49 | 43d | 1 | 0.76mi |
| 6329 Porterway Dr Houston, TX | 3.0 | 2.0 | 1144 | $1,599 | $1.40 | 43d | 1 | 0.82mi |
| 6356 Porterway Dr Houston, TX | 3.0 | 2.0 | 1144 | $1,531 | $1.34 | 24d | 1 | 0.85mi |
| 6316 Porterway Dr Houston, TX | 3.0 | 2.0 | 1144 | $1,581 | $1.38 | 1d | 1 | 0.86mi |
| 6331 Scotchwood Dr Katy, TX | 3.0 | 2.5 | 1610 | $1,681 | $1.04 | 5d | 1 | 0.94mi |
| 7202 Barker Cypress Rd Cypress, TX | 1.0–3.0 | 1.0–2.0 | 1129 | $1,829 | $1.62 | 1d | 36 | 0.96mi |
| 19434 Glenway Falls Dr Katy, TX | 3.0 | 2.0 | 1326 | $1,800 | $1.36 | 43d | 1 | 0.97mi |
| 19442 Elmtree Estates Dr Katy, TX | 3.0 | 2.0 | 1735 | $1,776 | $1.02 | 12d | 1 | 1.03mi |
| 19299 W Little York Rd Unit ACS2 Katy, TX | 2.0 | 2.0 | 1112 | $1,984 | $1.78 | 43d | 1 | 1.05mi |
| 6210 Scotchwood Dr Katy, TX | 3.0 | 2.0 | 1680 | $1,696 | $1.01 | 22d | 1 | 1.06mi |
| 17514 Northfalk Dr Houston, TX | 3.0 | 2.0 | 1021 | $1,620 | $1.59 | 43d | 1 | 1.07mi |
| 19715 Swan Valley Dr Cypress, TX | 3.0 | 2.0 | 1380 | $1,886 | $1.37 | 43d | 1 | 1.17mi |
| 17169 Farm to Market Road 529 Unit SNPS2 Houston, TX | 2.0 | 2.0 | 1092 | $1,790 | $1.64 | 43d | 1 | 1.17mi |
| 6395 Crossway Dr Houston, TX | 3.0 | 2.0 | 1200 | $1,750 | $1.46 | 1d | 1 | 1.18mi |
| 5915 Shining Leaf Ct Katy, TX | 4.0 | 2.0 | 1742 | $1,890 | $1.08 | 43d | 1 | 1.18mi |
| 19203 Canaras Ct Katy, TX | 3.0 | 2.0 | 1195 | $1,750 | $1.46 | 17d | 1 | 1.26mi |
| 19218 Sandelford Dr Katy, TX | 3.0 | 2.0 | 1195 | $1,000 | $0.84 | 2d | 1 | 1.31mi |
| 5843 Kyle Cove Dr Katy, TX | 3.0 | 3.0 | 1777 | $2,010 | $1.13 | 43d | 1 | 1.34mi |
| 19501 W Little York Rd Katy, TX | 2.0 | 2.0 | 990 | $1,250 | $1.26 | 43d | 1 | 1.35mi |
| 19501 W Little York Rd Katy, TX | 2.0 | 2.0 | 990 | $1,250 | $1.26 | 24d | 1 | 1.35mi |
| 19235 Sandelford Dr Katy, TX | 3.0 | 2.0 | 1330 | $1,000 | $0.75 | 7d | 1 | 1.36mi |
| 5906 Grand Colony Dr Katy, TX | 2.0–3.0 | 2.0 | 1143 | $1,720 | $1.50 | 3d | 9 | 1.37mi |
| 19607 Buckland Park Dr Katy, TX | 3.0 | 2.0 | 1798 | $1,965 | $1.09 | 2d | 1 | 1.38mi |
| 6700 Queenston Blvd Unit 6757 Houston, TX | 2.0 | 2.0 | 1156 | $1,418 | $1.23 | 10d | 1 | 1.40mi |
| 6700 Queenston Blvd Unit 422 Houston, TX | 2.0 | 2.0 | 1156 | $1,394 | $1.21 | 7d | 1 | 1.40mi |
| 6700 Queenston Blvd Unit 2112 Houston, TX | 2.0 | 2.0 | 1156 | $1,386 | $1.20 | 2d | 1 | 1.40mi |
| 6700 Queenston Blvd Unit 2047 Houston, TX | 2.0 | 2.0 | 1156 | $1,429 | $1.24 | 11d | 1 | 1.40mi |
| 6700 Queenston Blvd Unit 6737 Houston, TX | 2.0 | 2.0 | 1267 | $1,675 | $1.32 | 43d | 1 | 1.40mi |
| 6700 Queenston Blvd Unit 2162 Houston, TX | 2.0 | 2.0 | 1156 | $1,394 | $1.21 | 5d | 1 | 1.40mi |
| 17169 Spencer Rd Houston, TX | 2.0 | 2.0 | 1092 | $1,790 | $1.64 | 11d | 1 | 1.47mi |
| 19917 Stoney Haven Dr Cypress, TX | 2.0 | 1.5 | 1060 | $1,579 | $1.49 | 43d | 1 | 1.48mi |
| 7850 Maverick Trace Ln Cypress, TX | 3.0 | 3.0 | 1852 | $1,875 | $1.01 | 43d | 1 | 1.49mi |
HOA detail
- Monthly dues
- $46 · $552/yr
- Likely covers
- pool
Listing history 19 events
-
2026-05-14status Pending
-
2026-05-07$157,500 Active
-
2026-01-09historical
-
2025-10-21price $210,000
-
2025-07-28$220,000 Active
-
2024-05-25historical $1,700
-
2024-05-03$1,650
-
2024-05-02historical
-
2024-05-01$250,000 Active
-
2015-06-08soldstatus
-
2014-11-04soldstatus
-
2014-04-27historical
-
2014-03-04status Pending
-
2014-02-23$52,500 Active
-
2013-06-15historical
-
2013-06-15status Active
-
2013-03-15status Pending, Continue to Show
-
2013-03-01status Option Pending
-
2013-02-24$40,000 Active
ⓘ Source: listings_history table (triggers on properties + properties_extension) + one-shot
backfill from property_details.listing_events for pre-trigger history.
Tax reassessment forecast TX · Resets to sale price
- Current annual tax
- $4,134 · $344/mo
- Projected year-2 tax
- $4,134 · $344/mo
- Expected delta
- $0/yr ($0/mo · 0.0%)
ⓘ Screening estimate from a state-policy table — verify with the county assessor before closing.
Climate risk First Street
- Flood 1/10 Low FEMA zone X (unshaded) · 0% chance over 30 yrs
- Wildfire 1/10 Low
- Heat 9/10 Extreme 7 d/yr ≥110°F today · 23 d/yr by 30 yrs out
- Wind 9/10 Extreme 99% chance of damaging wind over 30 yrs
- Air quality 2/10 Low 2 unhealthy d/yr today · 2 by 30 yrs out
Nearby sold comps map
Loading sold comps map…
Walkable amenities ~0.75 mi
Loading nearby amenities…
Taxation est. · year 1
- Rental income
- $21,677
- − Mortgage interest
- −$8,822
- − Property taxes
- −$4,134
- − Insurance
- −$788
- − Repairs & maintenance
- −$1,734
- − Management
- −$1,734
- − HOA
- −$552
- − Depreciation
- −$4,582
- Taxable loss
- −$669
- Est. tax savings @ 24.0%
- +$161
- After-tax cash flow
- $1,901/yr
For passive investors: Depreciation is non-cash, so a rental often shows a tax loss while cash-flowing — sheltering income. Rental losses are passive: they offset passive income freely, and up to $25,000/yr can offset ordinary (W-2) income if you actively participate and your MAGI is under $100k (phasing out to $0 by $150k); unused losses carry forward. On sale, claimed depreciation is recaptured at up to 25%, and gains may owe capital-gains tax (a 1031 exchange can defer both). Figures are a year-1 estimate at your 24.0% rate — not tax advice; consult a CPA.
Schools (NCES district)
- District
- Cypress-Fairbanks ISD
- NCES district ID
- 4816110
- Math proficiency
- 45% ▼ -12.00%
- Reading proficiency
- 52% ▼ -2.00%
- Median HH income
- $72,025
- Composite
- 43.63/100
- National rank
- #2968
- State rank
- #161 of 826 in TX
Livability — Houston
- Score
- 74/100
- State rank
- #184
- US rank
- #4771
Category grades
Schools grade is shown separately in the Schools card above.
Census & demographics
- County
- Harris County · 4,702,590 people
- City population
- 3,226,434
- Metro
- Houston-The Woodlands-Sugar Land, TX
- Population (ZIP)
- 130,028
- Household income
- $87,808
- Rent vs Own
- Severe rent burden
- 3088.0
Population outlook (Harris County) Hauer SSP2
- Today (2025)
- 5,571,493 people
- By 2030
- 6,089,821 · +9.3%
- By 2040
- 7,142,806 · +28.2%
- By 2050
- 8,185,864 · +46.9%
- By 2075
- 10,574,329 · +89.8%
- By 2100
- 12,109,958 · +117.4%
Race, ethnicity, and origin ACS 2023
- Neighborhood character
- Diverse neighborhood (Simpson 0.68)
- Race & ethnicity
- Hispanic / Latino 49% Two or more races 22% Black 20% White 19% Asian 6%
- Hispanic origin (detail)
- Mexican 26% Puerto Rican 1% Cuban 4%
- Common ancestry
- Lithuanian 1% Italian 1%
- Foreign-born
- 32% · Canada, Jamaica, Vietnam
- Languages at home
- 48% English-only · Spanish 40% Other Indo-European 3% Vietnamese 1%
Political lean MEDSL · Harris
- 2024 margin
- Lean D (+5.5) · D 52.0% · R 46.4% · Other 1.6%
- 2008→2024 swing
- +3.9pp toward D · 2008: 1.6pp · 2024: 5.5pp
- All cycles
- 2024: D+5.5 2020: D+13.3 2016: D+12.4 2012: D+0.1 2008: D+1.6
Not yet ingested
- Civics
- —
Market trends
- HPI YoY
- ▼ -1.27%
- Current HPI
- 254.6622
- Rent YoY
- ▼ -2.86%
- Metro
- Houston-The Woodlands-Sugar Land, TX
- State GDP YoY
- ▲ 3.95%
- F500 in state
- 110
Industry mix (Fortune 500 HQ in TX)
| Industry | F500 HQs | Revenue |
|---|---|---|
| Energy | 16 | $1,198B |
|
||
| Technology | 5 | $198B |
|
||
| Engineering / Construction | 4 | $72B |
|
||
| Energy Services | 3 | $60B |
|
||
| Utilities | 3 | $41B |
|
||
| Healthcare | 2 | $330B |
|
||
Price history
+293.8% since first listed19 events — show timeline
- 2026-05-14 Pending — HARMLS
- 2026-05-07 Listed $157,500 HARMLS
- 2026-01-09 Listing Removed — HARMLS
- 2025-10-21 Price Changed $210,000 HARMLS
- 2025-07-28 Listed $220,000 HARMLS
- 2024-05-25 Rental Removed $1,700 HARMLS
- 2024-05-03 Listed for Rent $1,650 HARMLS
- 2024-05-02 Listing Removed — HARMLS
- 2024-05-01 Listed $250,000 HARMLS
- 2015-06-08 Sold (Public Records) — Public Records
- 2014-11-04 Sold (Public Records) — Public Records
- 2014-04-27 Listing Removed — HARMLS
- 2014-03-04 Pending — HARMLS
- 2014-02-23 Listed $52,500 HARMLS
- 2013-06-15 Listing Removed — HARMLS
- 2013-06-15 Relisted — HARMLS
- 2013-03-15 Pending — HARMLS
- 2013-03-01 Pending — HARMLS
- 2013-02-24 Listed $40,000 HARMLS
Property tax history
+2.7%/yrLatest (2025): $4,134 · +0.7% YoY. Source: county tax records.
Cash-flow waterfall
monthlySold comps — $/sqft
last 12 mo · ≤1 miLoading sold comps…