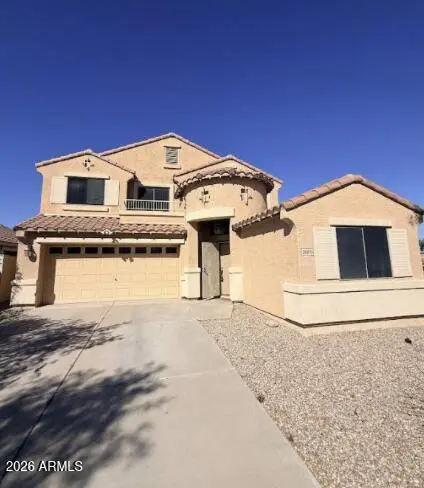
20470 N Tammy St · Maricopa, AZ
Flood risk 3/10 · Minor
- FEMA flood zone
- X (unshaded)
- Chance of flooding over 30 yrs
- 0.17%
- Est. flood insurance / yr
- $507 – $1,088
Fire risk 7/10 · Major
- Est. fire insurance / yr
- $610 – $1,132
Heat risk 9/10 · Severe
- Hot days now (above 114°F)
- 7 days/yr
- Hot days in 30 yrs
- 18 days/yr
Wind risk 1/10 · Minimal
- Chance of severe wind over 30 yrs
- —
Air-quality risk 1/10 · Minimal
- Unhealthy air days now
- 0 days/yr
- Unhealthy air days in 30 yrs
- 0 days/yr
Risk factors via First Street. Map © Google.
Why this score? — see what drove the D+ grade
The composite is a weighted blend of 9 inputs, each scored 0–100. Each bar is that input's sub-score; the figure is the points it added to the 100-point composite (weight × sub-score).
- ARV discount +15.0/15.0
- Cash flow +11.5/30.0
- Appreciation +4.6/10.0
- Livability +3.6/5.0
- DSCR +3.4/10.0
- 1% rule +2.9/10.0
- Rent growth +2.9/5.0
- Condition / age +2.5/5.0
- Schools +2.3/10.0
$300,000
🖨 Deal sheet (PDF) 📄 Offer letter ✓ Due diligence
Listing remarks MLS
Welcome to this beautiful two-story home. Highly desirable floor plan features a ground-floor bedroom and full bathroom, perfect for guests, multi-generational living, or a private home office. Nestled on a premium cul-de-sac lot, this property offers privacy, minimal traffic, and a spacious setting ideal for everyday living. The main living areas are open and inviting, showcasing granite countertops, espresso cabinetry, and a functional kitchen layout that flows seamlessly into the living and dining spaces. Large backyard perfect for a pool. This Home is a MUST SEE and WON'T LAST!!!
Key facts
- Full bathroom
- Espresso cabinetry
- Expansive backyard
Tags
Property features AI
Finance
- Financial info: Current financing: Private
- HOA & community: Community association present; Association fee $65 monthly; Association covers grounds maintenance and trash; Community amenities include lake, playground, and biking/walking path
Exterior
- Parking: 2 covered parking spaces; 2-car garage
- Utilities: City water; Public sewer
- Home design: Single family residence; Fee simple ownership
- Construction: Stucco and wood frame construction; Tile roof
- Exterior features: Balcony; Sprinklers in front and rear; Corner lot; Desert front and back landscaping; Block fencing
Interior
- Kitchen: Kitchen island; Pantry; Eat-in kitchen; Breakfast bar; Refrigerator; Dishwasher; Disposal
- Bedrooms: Up to 4 bedrooms (possible)
- Flooring: Carpet; Tile
- Bathrooms: 3 full bathrooms; Double vanity in bathroom; Separate shower and tub; Tub with jets
- Heating & cooling: Natural gas heating; Central air; Ceiling fans; Multi-zone cooling/heating
- Interior features: High-speed internet; Double vanity; Upstairs area; Eat-in kitchen; Breakfast bar; 9+ foot flat ceilings; Kitchen island; Pantry; Primary bedroom with full bath; Separate shower and tub; Tub with jets; Solar screens; Dual-pane windows; Multi-zone energy systems
- Laundry & utility: Has heating and cooling systems
Neighborhood map
What this means for you Summary
Snapshot
- This is a 4-bed/3.0-bath single-family listed at $300k.
Deal economics
- At list price, monthly cash flow is $-97 ($-1k/yr) — negative.
- To cash-flow at today's rent, offer at most $283k (5.7% below list).
- To meet the 1% rule (rent ≥ 1% of price), the offer needs to be $236k (21.3% below list).
- Recommended offer: $236k (21.3% below list) — sets the bar for 1% rule.
- Cap rate 5.9% vs local median 3.7% in Maricopa — top-decile yield for the area; either an underpriced asset or a hidden risk that comps aren't pricing in. Stress-test before assuming the spread holds.
Location & tenants
- Location reads 72/100 on livability (#28 in AZ) — a middle-class / working-renter tenant base. Strengths: housing A+, employment A-, crime B+; Watch: amenities F, commute F, health & safety F.
- Maricopa Unified School District (4441) (town): math 20% / reading 29% proficiency, ranked #128 of 249 in AZ (top 51%) — low school quality limits family demand, transient renter base, plan for 1-2y turnover.
- Zoned schools: Pima Butte Elementary School (math 42% / reading 49%, grade D-, #333 of 1,109 statewide, top 30%, 428 students, 40% FRL); Maricopa Wells Middle School (math 13% / reading 23%, grade F, #143 of 218 statewide, top 66%, 934 students, 57% FRL); Maricopa High School (math 12% / reading 19%, grade F, #262 of 381 statewide, top 69%, 2,188 students, 46% FRL) — zoned schools at 48% FRL track the district average.
- Market conditions: Rents rising (+1.8%/yr); 862 active listings in the ZIP; 40 comparable units currently listed for rent nearby; rentals at typical pace (median 19d on market — plan ~3-4 weeks tenant-placement turnaround); solid renter incomes; 9,504 units permitted in Pinal County in 2024 (776 in 5+ unit buildings).
Forward outlook
- Local home prices are declining (-0.9%/yr); year-one equity from $2k of loan paydown is wiped out by about $3k of value loss. Plan a longer hold.
Negotiation context
- Only 1 days on market — expect competitive offers; lowballing is unlikely to land.
- 7 sale attempts since 19y ago with the ask held roughly flat each time — persistent listings suggest the price (not the market) is what's stuck; bring a comps-based counter.
- Current owner paid $218k; 38% above their basis — modest negotiation headroom, anchor on the comps not their cost.
Risks & watch-outs
- Climate carrying-cost: major wildfire risk; extreme-heat days projected 7→18/yr by 2055 (HVAC capex compounding) — expect insurance premiums to compound above CPI over the hold.
Questions for the listing agent
- What do current leases actually rent for vs. the listed asking? Can we see a recent rent roll and the last 12 months of T-12 income?
- What does the HOA fee cover, when was the last increase, and are there any pending special assessments or reserve-fund shortfalls?
- Is there a deadline driving the sale (1031 exchange, divorce, estate, relocation)? That informs how much negotiation room exists.
- Schools are B-rated — typically a magnet for longer-tenancy family renters. What's the average tenant stay here, and is there a school-zone premium baked into asking?
- The area grade is low — what's the realistic commute time and amenity access for the typical tenant pool here? Any planned neighborhood developments (good or bad) we should know about?
- What's the average days-on-market for RENTAL listings here right now (not sales)? A rising rental-DOM trend means longer vacancies and softer asking-rent achievability than the comps imply.
- What's the recent tenant-quality profile in this submarket — average credit score on applications, eviction rate, late-payment / NSF rate, and stable-employment percentage? A property-management company in the area should have these aggregated.
- How much new for-sale + rental construction is in the pipeline within 1–3 miles? Heavy new supply typically softens prices + rents 12–24 months out; constrained supply supports both.
Investment metrics
- 1% rule
- 0.79% ✗
- Cap rate
- 5.91%
- Cash-on-cash
- -1.38%
- DSCR
- 0.94
- GRM
- 10.6
CMA / ARV
- ARV (on-the-fly)
- $396,896
- Comps found
- 12
Show comp detail 12 sales within ~0.75 mi
| Address | Dist | Beds/Ba | Sqft | Sold | Price | $/sf | Match |
|---|---|---|---|---|---|---|---|
| 20470 N Tammy St | 0.00mi | 4/3.0 | 2,529 (0%) | 3mo | $217,500 | $86 | 98 |
| 41285 W Pryor Ln | 0.13mi | 4/2.5 | 2,482 (-2%) | 2mo | $358,750 | $145 | 88 |
| 20475 N Herbert Ave | 0.18mi | 3/2.5 (-1) | 2,530 (+0%) | 3mo | $300,000 | $119 | 82 |
| 41623 W Springtime Rd | 0.42mi | 3/3.0 (-1) | 2,605 (+3%) | 1mo | $440,000 | $169 | 69 |
| 41709 W Springtime Rd | 0.43mi | 3/2.5 (-1) | 2,435 (-4%) | 2mo | $540,000 | $222 | 65 |
| 21388 N Liles Ln | 0.58mi | 4/3.0 | 2,655 (+5%) | 1mo | $416,000 | $157 | 64 |
| 20745 N Verbena Ln | 0.38mi | 3/2.5 (-1) | 2,700 (+7%) | 3mo | $655,000 | $243 | 62 |
| 41413 W Novak Ln | 0.22mi | 3/2.5 (-1) | 2,192 (-13%) | 0mo | $325,000 | $148 | 61 |
| 40954 W Brandt Dr | 0.32mi | 3/2.0 (-1) | 2,263 (-10%) | 1mo | $398,000 | $176 | 58 |
| 41744 W Cribbage Rd | 0.47mi | 3/2.5 (-1) | 2,325 (-8%) | 3mo | $624,900 | $269 | 55 |
| 40871 W Thornberry Ln | 0.54mi | 4/2.5 | 2,276 (-10%) | 2mo | $310,000 | $136 | 54 |
| 21046 N Madeline St | 0.50mi | 4/2.5 | 2,151 (-15%) | 0mo | $315,000 | $146 | 50 |
Match score weights: distance 35% · size 25% · config 20% · recency 20%. Top-matched comps best support the ARV.
Projected returns pro-forma
-0.89% appreciation · 1.78% rent growth · sell at horizon
- IRR
- -8.3%
- Equity multiple
- 0.64×
- Total profit
- $-30,127
- Equity at exit
- $74,037
- IRR
- -2.6%
- Equity multiple
- 0.76×
- Total profit
- $-19,757
- Equity at exit
- $79,133
Cash invested: $84,000 (down + closing). Projections, not guarantees.
Landlord ↔ Tenant lean methodology
- Overall (STATE)
- 87 Strongly Landlord-Friendly
- State Arizona
- 87 Strongly Landlord-Friendly · R+3
- County
- — inherits STATE
- City
- — inherits STATE
ZIP-level market 85138
- Home prices YoY
- -0.3%
- Rents YoY
- 1.8%
- Active inventory
- 862
- Price-to-rent
- 10.6×
Monthly cashflow live
- Estimated rent
- $2,361 high interval (Pro) →
- Mortgage (P&I)
- −$1,573
- Tax from tax record
- −$199 /mo · $2,386/yr
- Insurance
- −$125
- HOA
- −$65
- Vacancy / Maint / Mgmt
- −$496
- Net cashflow
- $-97
Break-even live
Sensitivity live
| Price | -10% $73 | -5% $-12 | +0% $-97 | +5% $-182 | +10% $-267 |
|---|---|---|---|---|---|
| Rent | -10% $-283 | -5% $-190 | +0% $-97 | +5% $-4 | +10% $90 |
| Rate | -1.0pp $54 | -0.5pp $-21 | base $-97 | +0.5pp $-175 | +1.0pp $-254 |
UW: 25.0% down · 7.5% · 30yr · 1.5% tax · 5.0% vac · 8.0% maint · 8.0% mgmt
Financing live
Cash to close
- Down payment
- $75,000
- Closing costs
- $9,000
- Reserves months
- —
- Total cash needed
- —
Loan-product check · same deal, 3 products live
Conventional
25% down · 7.5% · 30yr
- Down + closing
- —
- Monthly P&I
- —
- Monthly cashflow
- —
- DSCR
- —
- Eligible?
- —
Personal DTI + credit; lowest rate.
DSCR
20% down · 8.5% · 30yr
- Down + closing
- —
- Monthly P&I
- —
- Monthly cashflow
- —
- DSCR
- —
- Eligible?
- —
No personal income docs; deal must DSCR.
Hard money
10% down · 12.0% · 12mo
- Down + closing
- —
- Monthly P&I
- —
- Monthly cashflow
- —
- DSCR
- —
- Eligible?
- —
Short-term bridge; refi at stabilization.
Rent comps 40 comps
| Address | Beds | Baths | Sqft | Rent | $/sqft | DOM | Units | Dist |
|---|---|---|---|---|---|---|---|---|
| 41057 W Ganley Way Maricopa, AZ | 4.0 | 2.5 | 1908 | $1,925 | $1.01 | 0d | 1 | 0.31mi |
| 40907 W Robbins Dr Maricopa, AZ | 4.0 | 2.0 | 1891 | $1,749 | $0.92 | 23d | 1 | 0.43mi |
| 41209 W Hayden Dr Maricopa, AZ | 4.0 | 3.0 | 2837 | $3,500 | $1.23 | 45d | 1 | 0.47mi |
| 41334 W Hayden Dr Maricopa, AZ | 3.0 | 2.0 | 2150 | $1,689 | $0.79 | 45d | 1 | 0.48mi |
| 21357 N Liles Ln Maricopa, AZ | 4.0 | 3.0 | 2635 | $2,300 | $0.87 | 13d | 1 | 0.55mi |
| 19488 N Falcon Ln Maricopa, AZ | 4.0 | 3.0 | 1836 | $2,300 | $1.25 | 13d | 1 | 0.64mi |
| 40893 W Bedford Dr Maricopa, AZ | 5.0 | 3.0 | 2748 | $2,750 | $1.00 | 7d | 1 | 0.69mi |
| 40481 W Jenna Ln Maricopa, AZ | 4.0 | 2.0 | 1819 | $1,785 | $0.98 | 0d | 1 | 0.75mi |
| 41192 W Rio Bravo Dr Maricopa, AZ | 3.0 | 2.5 | 1774 | $1,789 | $1.01 | 21d | 1 | 0.76mi |
| 21657 N Dietz Dr Maricopa, AZ | 4.0 | 2.0 | 2151 | $1,899 | $0.88 | 45d | 1 | 0.76mi |
| 40174 W Brandt Dr Maricopa, AZ | 3.0 | 2.0 | 2115 | $1,849 | $0.87 | 6d | 1 | 0.78mi |
| 42187 W Chisholm Dr Maricopa, AZ | 3.0 | 2.0 | 2312 | $5,500 | $2.38 | 45d | 1 | 0.82mi |
| 21619 N Van Loo Dr Maricopa, AZ | 3.0 | 2.0 | 1938 | $3,500 | $1.81 | 5d | 1 | 0.84mi |
| 42376 W Chisholm Dr Maricopa, AZ | 3.0 | 2.0 | 2312 | $2,000 | $0.87 | 7d | 1 | 0.90mi |
| 41298 W Parkhill Dr Maricopa, AZ | 4.0 | 2.5 | 2037 | $2,000 | $0.98 | 45d | 1 | 0.91mi |
| 20791 N Grantham Rd Maricopa, AZ | 5.0 | 3.0 | 3266 | $2,675 | $0.82 | 7d | 1 | 0.96mi |
| 40010 W Thornberry Ln Maricopa, AZ | 3.0 | 2.5 | 2157 | $1,795 | $0.83 | 45d | 1 | 0.98mi |
| 43205 W Roth Rd Maricopa, AZ | 4.0 | 2.0 | 2216 | $2,100 | $0.95 | 12d | 1 | 1.10mi |
| 43205 W Roth Rd Maricopa, AZ | 4.0 | 2.0 | 2215 | $2,200 | $0.99 | 45d | 1 | 1.10mi |
| 42735 W Arizona Ave Maricopa, AZ | 5.0 | 3.0 | 3735 | $2,495 | $0.67 | 0d | 1 | 1.12mi |
| 21061 N Bustos Way Maricopa, AZ | 3.0 | 2.0 | 1907 | $1,749 | $0.92 | 45d | 1 | 1.13mi |
| 40515 W Chambers Dr Maricopa, AZ | 4.0 | 3.0 | 1978 | $1,795 | $0.91 | 16d | 1 | 1.16mi |
| 43207 W Lindgren Dr Maricopa, AZ | 3.0 | 2.0 | 1907 | $1,699 | $0.89 | 45d | 1 | 1.17mi |
| 43332 W Griffis Dr Maricopa, AZ | 4.0 | 2.0 | 2235 | $4,200 | $1.88 | 45d | 1 | 1.18mi |
| 19696 N Madison Dr Maricopa, AZ | 4.0 | 2.5 | 2219 | $3,400 | $1.53 | 26d | 1 | 1.19mi |
| 43223 W Neely Dr Maricopa, AZ | 4.0 | 2.0 | 2223 | $2,900 | $1.30 | 18d | 1 | 1.20mi |
| 41177 W Lucera Ln Maricopa, AZ | 3.0 | 2.0 | 1838 | $1,875 | $1.02 | 7d | 1 | 1.24mi |
| 22427 N Vanderveen Way Maricopa, AZ | 3.0 | 2.5 | 2855 | $1,936 | $0.68 | 7d | 1 | 1.25mi |
| 43368 W Palmen Dr Maricopa, AZ | 4.0 | 2.5 | 2200 | $1,889 | $0.86 | 45d | 1 | 1.26mi |
| 22306 N Van Loo Dr Maricopa, AZ | 3.0 | 2.0 | 1918 | $2,100 | $1.09 | 6d | 1 | 1.26mi |
| 42309 W Desert Fairways Dr Maricopa, AZ | 5.0 | 3.0 | 1913 | $1,899 | $0.99 | 3d | 1 | 1.27mi |
| 41342 W Capistrano Dr Maricopa, AZ | 3.0 | 2.5 | 2201 | $1,800 | $0.82 | 7d | 1 | 1.27mi |
| 40915 W Agave Rd Maricopa, AZ | 4.0 | 2.5 | 2152 | $2,100 | $0.98 | 45d | 1 | 1.27mi |
| 40785 W Agave Rd Maricopa, AZ | 3.0 | 2.0 | 1902 | $1,999 | $1.05 | 45d | 1 | 1.29mi |
| 22427 N Van Loo Dr Maricopa, AZ | 3.0 | 2.0 | 2314 | $1,735 | $0.75 | 0d | 1 | 1.30mi |
| 22427 N Van Loo Dr Maricopa, AZ | 3.0 | 2.0 | 2314 | $1,790 | $0.77 | 7d | 1 | 1.30mi |
| 19053 N Wilson St Unit 1545785P Maricopa, AZ | 5.0 | 3.0 | 3239 | $4,438 | $1.37 | 18d | 1 | 1.30mi |
| 22463 N Dietz Dr Maricopa, AZ | 3.0 | 2.0 | 1824 | $2,000 | $1.10 | 26d | 1 | 1.31mi |
| 43531 W Oster Dr Maricopa, AZ | 5.0 | 3.0 | 2494 | $1,900 | $0.76 | 26d | 1 | 1.33mi |
| 22499 N Dietz Dr Maricopa, AZ | 3.0 | 2.0 | 2130 | $3,600 | $1.69 | 3d | 1 | 1.33mi |
HOA detail
- Monthly dues
- $65 · $780/yr
- Likely covers
- pool
Listing history 2 events
-
2026-06-21remarks 699-char remark
-
2026-06-21$300,000 Active 1 DOM
ⓘ Source: listings_history table (triggers on properties + properties_extension) + one-shot
backfill from property_details.listing_events for pre-trigger history.
Tax reassessment forecast AZ · Resets to sale price
- Current annual tax
- $2,386 · $199/mo
- Projected year-2 tax
- $2,386 · $199/mo
- Expected delta
- $0/yr ($0/mo · 0.0%)
ⓘ Screening estimate from a state-policy table — verify with the county assessor before closing.
Climate risk First Street
- Flood 3/10 Moderate FEMA zone X (unshaded) · 17% chance over 30 yrs
- Wildfire 7/10 Severe
- Heat 9/10 Extreme 7 d/yr ≥114°F today · 18 d/yr by 30 yrs out
- Wind 1/10 Low
- Air quality 1/10 Low 0 unhealthy d/yr today · 0 by 30 yrs out
Nearby sold comps map
Loading sold comps map…
Walkable amenities ~0.75 mi
Loading nearby amenities…
Taxation est. · year 1
- Rental income
- $28,334
- − Mortgage interest
- −$16,805
- − Property taxes
- −$2,386
- − Insurance
- −$1,500
- − Repairs & maintenance
- −$2,267
- − Management
- −$2,267
- − HOA
- −$780
- − Depreciation
- −$8,727
- Taxable loss
- −$6,398
- Est. tax savings @ 24.0%
- +$1,536
- After-tax cash flow
- $374/yr
For passive investors: Depreciation is non-cash, so a rental often shows a tax loss while cash-flowing — sheltering income. Rental losses are passive: they offset passive income freely, and up to $25,000/yr can offset ordinary (W-2) income if you actively participate and your MAGI is under $100k (phasing out to $0 by $150k); unused losses carry forward. On sale, claimed depreciation is recaptured at up to 25%, and gains may owe capital-gains tax (a 1031 exchange can defer both). Figures are a year-1 estimate at your 24.0% rate — not tax advice; consult a CPA.
Schools (NCES district)
- District
- Maricopa Unified School District (4441)
- NCES district ID
- 0404720
- Math proficiency
- 20% ▼ -18.00%
- Reading proficiency
- 29% ▼ -9.00%
- Median HH income
- $63,725
- Composite
- 22.92/100
- National rank
- #7993
- State rank
- #128 of 249 in AZ
Livability — Maricopa
- Score
- 72/100
- State rank
- #28
- US rank
- #5943
Category grades
Schools grade is shown separately in the Schools card above.
Census & demographics
- Census place
- Maricopa, AZ
- County
- Pinal County · 399,947 people
- City population
- 76,044
- Metro
- Phoenix-Mesa-Chandler, AZ
- Population (ZIP)
- 55,260
- Household income
- $95,867
- Rent vs Own
- Severe rent burden
- 432.0
Population outlook (Pinal County) Hauer SSP2
- Today (2025)
- 437,574 people
- By 2030
- 446,903 · +2.1%
- By 2040
- 452,589 · +3.4%
- By 2050
- 444,126 · +1.5%
- By 2075
- 430,300 · -1.7%
- By 2100
- 393,536 · -10.1%
Race, ethnicity, and origin ACS 2023
- Neighborhood character
- Diverse neighborhood (Simpson 0.69)
- Race & ethnicity
- White 45% Hispanic / Latino 30% Two or more races 17% Black 13% Native American 3% Asian 3% Pacific Islander 1%
- Hispanic origin (detail)
- Mexican 26% Puerto Rican 1%
- Common ancestry
- Lithuanian 2% Romanian 2% Italian 2%
- Foreign-born
- 10% · Canada
- Languages at home
- 79% English-only · Spanish 16% Other Asian/Pacific 1% Other Indo-European 1%
Political lean MEDSL · Pinal
- 2024 margin
- Strong R (+22.1) · D 38.5% · R 60.6%
- 2008→2024 swing
- -7.6pp toward R · 2008: -14.5pp · 2024: -22.1pp
- All cycles
- 2024: R+22.1 2020: R+17.3 2016: R+19.3 2012: R+17.1 2008: R+14.5
Not yet ingested
- Civics
- —
Market trends
- HPI YoY
- ▼ -0.89%
- Current HPI
- 258.1461
- Rent YoY
- ▲ 1.78%
- Metro
- Phoenix-Mesa-Chandler, AZ
- State GDP YoY
- ▲ 4.54%
- F500 in state
- 20
Industry mix (Fortune 500 HQ in AZ)
| Industry | F500 HQs | Revenue |
|---|---|---|
| Technology | 2 | $13B |
|
||
| Mining / Metals | 1 | $23B |
|
||
| Environmental Services | 1 | $16B |
|
||
| Metals / Steel | 1 | $14B |
|
||
| Technology Distribution | 1 | $9B |
|
||
| Homebuilding | 1 | $8B |
|
||
Price history
-99.1% since first listed19 events — show timeline
- 2026-06-20 Listed $300,000 ARMLS
- 2026-04-10 Sold (Public Records) $217,500 Public Records
- 2026-03-31 Sold (MLS) $217,500 ARMLS
- 2026-03-28 Pending — ARMLS
- 2026-03-16 Listed $250,000 ARMLS
- 2010-04-19 Sold (Public Records) $139,000 Public Records
- 2010-04-16 Sold (MLS) $143,500 ARMLS
- 2010-03-22 Contingent — ARMLS
- 2010-01-01 Listed $149,775 ARMLS
- 2009-12-31 Listing Removed — ARMLS
- 2009-05-29 Listed $149,900 ARMLS
- 2009-02-14 Listing Removed — ARMLS
- 2008-11-03 Listed $179,990 ARMLS
- 2008-07-30 Listing Removed — ARMLS
- 2008-07-28 Listed $209,900 ARMLS
- 2007-08-28 Sold (MLS) $231,109 ARMLS
- 2007-07-27 Listing Removed — ARMLS
- 2007-05-29 Listed $231,109 ARMLS
- 2004-11-04 Sold (Public Records) $33,080,895 Public Records
Property tax history
+0.7%/yrLatest (2025): $2,386 · +3.6% YoY. Source: county tax records.
Cash-flow waterfall
monthlySold comps — $/sqft
last 12 mo · ≤1 miLoading sold comps…