 🏗️ New Construction
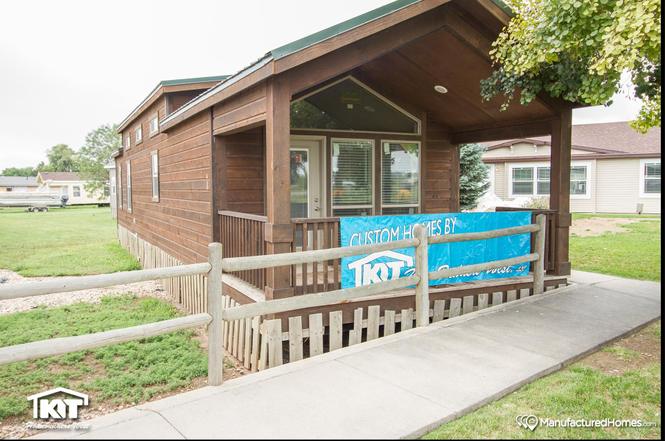
Cedar Canyon 2071 - BOYL Plan · Post Falls, ID
Flood risk No data
- FEMA flood zone
- —
- Chance of flooding over 30 yrs
- —
- Est. flood insurance / yr
- —
Fire risk No data
- Est. fire insurance / yr
- —
Heat risk No data
- Hot days now (above threshold)
- —
- Hot days in 30 yrs
- —
Wind risk No data
- Chance of severe wind over 30 yrs
- —
Air-quality risk No data
- Unhealthy air days now
- —
- Unhealthy air days in 30 yrs
- —
Risk factors via First Street. Map © Google.
Why this score? — see what drove the B grade
The composite is a weighted blend of 9 inputs, each scored 0–100. Each bar is that input's sub-score; the figure is the points it added to the 100-point composite (weight × sub-score).
- Cash flow +30.0/30.0
- DSCR +10.0/10.0
- 1% rule +9.7/10.0
- ARV discount +7.5/15.0
- Livability +4.4/5.0
- Schools +4.2/10.0
- Rent growth +2.9/5.0
- Condition / age +2.5/5.0
- Appreciation +0.0/10.0
$100,900
🖨 Deal sheet 📄 Offer letter ✓ Due diligence
Listing remarks
Note: The price reflects the price of the home itself and does not include the property. You are responsible for providing the property on which these plans will be built. We have over 100 floorplans to choose from, and the homes are highly customizable. The price listed is the base price, and any options or upgrades will be additional. Pictures and virtual tours show examples of customer's homes and may show upgrades. 2 Bdr / 1 Bath / 660 sqft. - This Cedar Canyon 2071 is another example of fine quality and craftsmanship. This small home is ideal for vacation homes and small family.
Key facts
- Listed 120 days
Property features AI
Finance
- Financial info: Offered as a plan; list price $100,900
Exterior
- Utilities: Electric service
- Home design: Single-level plan home (Cedar Canyon 2071)
- Exterior features: Asphalt roof
Interior
- Bedrooms: 2 bedrooms
- Bathrooms: 1 full bathroom
- Heating & cooling: Electric forced-air heating
- Interior features: Plan home (Cedar Canyon 2071)
Neighborhood map
What this means for you Summary
Snapshot
- This is a 2-bed/1.0-bath manufactured listed at $101k.
Deal economics
- At list price, monthly cash flow is $472 ($6k/yr) — positive.
- The deal already cash-flows at list — no discount required.
- Meets the 1% rule at list price ($1k rent vs $101k).
- Recommended offer: $89k (12.0% below list) — sets the bar for market timing.
- Cap rate 11.9% vs local median 2.2% in Post Falls — top-decile yield for the area; either an underpriced asset or a hidden risk that comps aren't pricing in. Stress-test before assuming the spread holds.
Location & tenants
- Location reads 88/100 on livability (#1 in ID, #198 nationally) — a professional / high-income tenant draw. Strengths: crime A+, commute A+, housing A+.
- Post Falls District (suburban): math 43% / reading 56% proficiency, ranked #31 of 92 in ID (top 34%) — families likely to look elsewhere, expect single-tenant / working-renter base with shorter leases.
- Market conditions: Rents rising (+1.5%/yr); 625 active listings in the ZIP; solid renter incomes; 1,606 units permitted in Kootenai County in 2024 (154 in 5+ unit buildings).
Forward outlook
- Local home prices are declining (-3.0%/yr); year-one equity from $698 of loan paydown is wiped out by about $3k of value loss. Plan a longer hold.
- Kootenai County population projected at +33% by 2050 — long-run rental-demand tailwind backs the buy-and-hold thesis.
- At projected returns (-3.0% appreciation + 1.5% rent growth), your $28k cash investment doubles in ~7 years — after that, you're playing with house money.
Negotiation context
- It's been on market 121 days — a 12% lower offer ($89k) is reasonable based on typical stale-listing flexibility.
Questions for the listing agent
- It's been on market 121 days. Have you received any prior offers? Is the seller open to a 12% concession, seller financing, or rate buy-down credit?
- Why hasn't it sold? Are there any deal-killer items the seller is aware of (foundation, flood, title, zoning, code violations)?
- Is there a deadline driving the sale (1031 exchange, divorce, estate, relocation)? That informs how much negotiation room exists.
- What's the average days-on-market for RENTAL listings here right now (not sales)? A rising rental-DOM trend means longer vacancies and softer asking-rent achievability than the comps imply.
- What's the recent tenant-quality profile in this submarket — average credit score on applications, eviction rate, late-payment / NSF rate, and stable-employment percentage? A property-management company in the area should have these aggregated.
- How much new for-sale + rental construction is in the pipeline within 1–3 miles? Heavy new supply typically softens prices + rents 12–24 months out; constrained supply supports both.
Investment metrics
- 1% rule
- 1.47% ✓
- Cap rate
- 11.90%
- Cash-on-cash
- 20.04%
- DSCR
- 1.89
- GRM
- 5.7
CMA / ARV
No comps found within radius.
Projected returns pro-forma
-3.0% appreciation · 1.46% rent growth · sell at horizon
- IRR
- 10.5%
- Equity multiple
- 1.41×
- Total profit
- $11,457
- Equity at exit
- $15,045
- IRR
- 18.2%
- Equity multiple
- 2.41×
- Total profit
- $39,769
- Equity at exit
- $8,724
Cash invested: $28,252 (down + closing). Projections, not guarantees.
Landlord ↔ Tenant lean methodology
- Overall (STATE)
- 91 Strongly Landlord-Friendly
- State Idaho
- 91 Strongly Landlord-Friendly · R+18
- County
- — inherits STATE
- City
- — inherits STATE
ZIP-level market 83854
- Rents YoY
- 1.5%
- Active inventory
- 625
- Price-to-rent
- 5.7×
Monthly cashflow live
- Estimated rent
- $1,480 medium interval (Pro) →
- Mortgage (P&I)
- −$529
- Tax est. 1.5%
- −$126 /mo · $1,514/yr
- Insurance
- −$42
- HOA
- −$0
- Vacancy / Maint / Mgmt
- −$311
- Net cashflow
- $472
Break-even live
UW: 25.0% down · 7.5% · 30yr · 1.5% tax · 5.0% vac · 8.0% maint · 8.0% mgmt
Financing live
Cash to close
- Down payment
- $25,225
- Closing costs
- $3,027
- Reserves months
- —
- Total cash needed
- —
Loan-product check · same deal, 3 products live
Conventional
25% down · 7.5% · 30yr
- Down + closing
- —
- Monthly P&I
- —
- Monthly cashflow
- —
- DSCR
- —
- Eligible?
- —
Personal DTI + credit; lowest rate.
DSCR
20% down · 8.5% · 30yr
- Down + closing
- —
- Monthly P&I
- —
- Monthly cashflow
- —
- DSCR
- —
- Eligible?
- —
No personal income docs; deal must DSCR.
Hard money
10% down · 12.0% · 12mo
- Down + closing
- —
- Monthly P&I
- —
- Monthly cashflow
- —
- DSCR
- —
- Eligible?
- —
Short-term bridge; refi at stabilization.
Listing history 17 events
-
2026-06-19days on market $100,900 Active 121 DOM
-
2026-06-18days on market $100,900 Active 120 DOM
-
2026-06-17days on market $100,900 Active 119 DOM
-
2026-06-16days on market $100,900 Active 118 DOM
-
2026-06-15days on market $100,900 Active 117 DOM
-
2026-06-14days on market $100,900 Active 115 DOM
-
2026-06-13days on market $100,900 Active 114 DOM
-
2026-06-10days on market $100,900 Active 112 DOM
-
2026-06-09days on market $100,900 Active 111 DOM
-
2026-06-08days on market $100,900 Active 110 DOM
-
2026-06-07days on market $100,900 Active 109 DOM
-
2026-06-05days on market $100,900 Active 106 DOM
-
2026-06-03days on market $100,900 Active 105 DOM
-
2026-06-02days on market $100,900 Active 104 DOM
-
2026-06-01days on market $100,900 Active 103 DOM
-
2026-05-31days on market $100,900 Active 102 DOM
-
2026-05-30days on market $100,900 Active 101 DOM
ⓘ Source: listings_history table (triggers on properties + properties_extension) + one-shot
backfill from property_details.listing_events for pre-trigger history.
Nearby sold comps map
Loading sold comps map…
Walkable amenities ~0.75 mi
Loading nearby amenities…
Taxation est. · year 1
- Rental income
- $17,757
- − Mortgage interest
- −$5,652
- − Property taxes
- −$1,514
- − Insurance
- −$504
- − Repairs & maintenance
- −$1,421
- − Management
- −$1,421
- − Depreciation
- −$2,935
- Taxable income
- $4,311
- Est. tax owed @ 24.0%
- −$1,035
- After-tax cash flow
- $4,626/yr
For passive investors: Depreciation is non-cash, so a rental often shows a tax loss while cash-flowing — sheltering income. Rental losses are passive: they offset passive income freely, and up to $25,000/yr can offset ordinary (W-2) income if you actively participate and your MAGI is under $100k (phasing out to $0 by $150k); unused losses carry forward. On sale, claimed depreciation is recaptured at up to 25%, and gains may owe capital-gains tax (a 1031 exchange can defer both). Figures are a year-1 estimate at your 24.0% rate — not tax advice; consult a CPA.
Schools (NCES district)
- District
- Post Falls District
- NCES district ID
- 1602670
- Math proficiency
- 43% ▼ -5.00%
- Reading proficiency
- 56% ▬ 0.00%
- Median HH income
- $49,504
- Composite
- 42.27/100
- National rank
- #3268
- State rank
- #31 of 92 in ID
Livability — Post Falls
- Score
- 88/100
- State rank
- #1
- US rank
- #198
Category grades
Schools grade is shown separately in the Schools card above.
Census & demographics
- Census place
- Post Falls, ID
- County
- Kootenai County · 146,553 people
- City population
- 54,851
- Metro
- Coeur d'Alene, ID
- Population (ZIP)
- 54,851
- Household income
- $82,742
- Rent vs Own
- Severe rent burden
- 1218.0
Population outlook (Kootenai County) Hauer SSP2
- Today (2025)
- 177,692 people
- By 2030
- 190,689 · +7.3%
- By 2040
- 214,704 · +20.8%
- By 2050
- 236,510 · +33.1%
- By 2075
- 285,984 · +60.9%
- By 2100
- 316,459 · +78.1%
Race, ethnicity, and origin ACS 2023
- Neighborhood character
- Predominantly White (84%)
- Race & ethnicity
- White 84% Two or more races 10% Hispanic / Latino 6% Native American 1%
- Hispanic origin (detail)
- Mexican 4%
- Common ancestry
- Portuguese 4% Italian 3% Slovak 2%
- Foreign-born
- 2% · Canada
- Languages at home
- 96% English-only · Spanish 2%
Political lean MEDSL · Kootenai
- 2024 margin
- Solid R (+51.9) · D 22.9% · R 74.8% · Other 2.2%
- 2008→2024 swing
- -25.6pp toward R · 2008: -26.3pp · 2024: -51.9pp
- All cycles
- 2024: R+51.9 2020: R+42.9 2016: R+42.5 2012: R+34.3 2008: R+26.3
Not yet ingested
- Civics
- —
Market trends
- HPI YoY
- ▼ -259.70%
- Current HPI
- 259.7767
- Rent YoY
- ▲ 1.46%
- Metro
- Coeur d'Alene, ID
- State GDP YoY
- ▲ 4.51%
- F500 in state
- 6
Industry mix (Fortune 500 HQ in ID)
| Industry | F500 HQs | Revenue |
|---|---|---|
| Retail | 1 | $79B |
|
||
| Technology | 1 | $25B |
|
||
| Food / Agriculture | 1 | $6B |
|
||
Cash-flow waterfall
monthlySold comps — $/sqft
last 12 mo · ≤1 miLoading sold comps…