 🏗️ New Construction
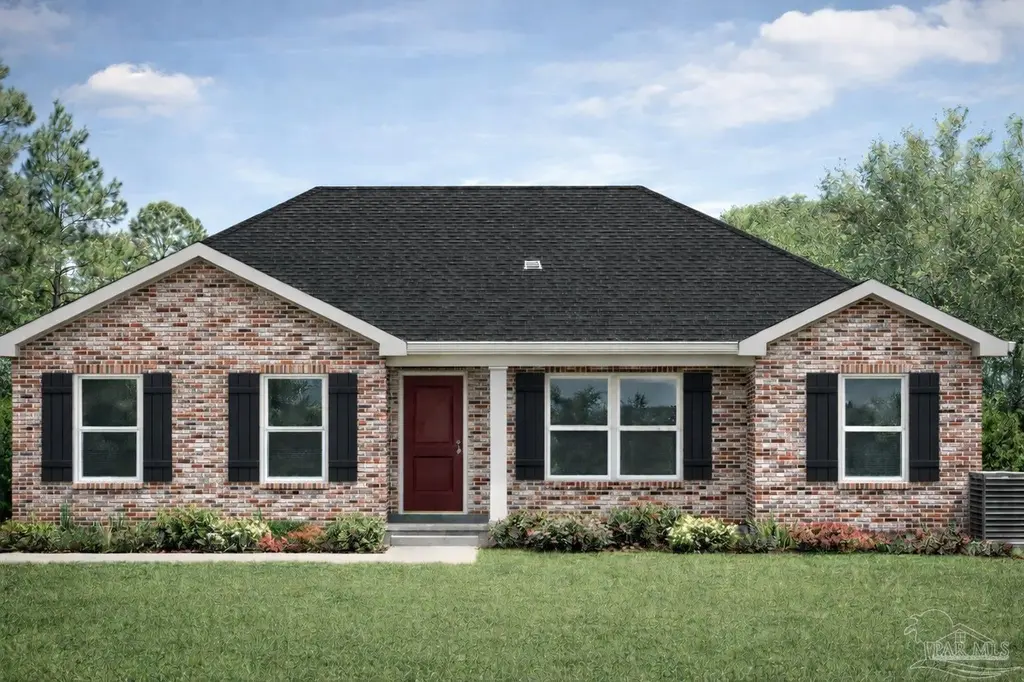
4411 Oak Ln · Pea Ridge, FL
Flood risk No data
- FEMA flood zone
- —
- Chance of flooding over 30 yrs
- —
- Est. flood insurance / yr
- —
Fire risk No data
- Est. fire insurance / yr
- —
Heat risk No data
- Hot days now (above threshold)
- —
- Hot days in 30 yrs
- —
Wind risk No data
- Chance of severe wind over 30 yrs
- —
Air-quality risk No data
- Unhealthy air days now
- —
- Unhealthy air days in 30 yrs
- —
Risk factors via First Street. Map © Google.
Why this score? — see what drove the F grade
The composite is a weighted blend of 9 inputs, each scored 0–100. Each bar is that input's sub-score; the figure is the points it added to the 100-point composite (weight × sub-score).
- ARV discount +7.5/15.0
- Cash flow +6.5/30.0
- Schools +5.3/10.0
- Rent growth +3.6/5.0
- Livability +3.5/5.0
- Condition / age +2.5/5.0
- 1% rule +1.6/10.0
- DSCR +0.8/10.0
- Appreciation +0.0/10.0
$269,900
🖨 Deal sheet (PDF) 📄 Offer letter ✓ Due diligence
Listing remarks
Estimated Completion end of Summer 2026. Beautiful new construction home featuring a full all-brick exterior for lasting durability, low maintenance, and timeless curb appeal. This thoughtfully designed 3-bedroom, 2-bath home offers approximately 1,315 square feet of functional living space with a well-balanced layout perfect for everyday living. Step inside to an open-concept kitchen and family room, creating a seamless flow ideal for entertaining or relaxing at home. The kitchen includes a central island and overlooks the main living area, making it easy to stay connected while cooking or hosting. The private primary suite is positioned separately from the additional bedrooms and features
Key facts
- Central island
- Open-concept kitchen
- En-suite bath
Tags
Property features AI
Finance
- Other: Green energy features: insulation, insulated walls, ridge vent
- Financial info: No financial details provided
- HOA & community: No homeowners association
Exterior
- Parking: Attached garage (1 garage space, 1 covered space, total 1 parking space)
- Security: No security details provided
- Utilities: Electric with circuit breakers and copper wiring; Sewer via grinder pump and septic tank
- Home design: New construction; Single-story home; Not attached to other properties; Frame construction
- Construction: Built on a slab foundation; Frame construction; One level
- Exterior features: Interior lot; Shingle roof; Paved, county-maintained road access; No horses allowed
Interior
- Kitchen: Electric water heater
- Bedrooms: Master bedroom on the first floor (approx. 12.8' x 12', 154 sq ft); Additional bedroom on the first floor (approx. 10.7' x 11.8', 126 sq ft)
- Flooring: No flooring details provided
- Bathrooms: Two full bathrooms
- Heating & cooling: Heat pump heating; Heat pump cooling; Ceiling fans
- Interior features: Breakfast bar and kitchen/dining combo; Not updated bathroom/kitchen details
- Laundry & utility: No laundry-specific details provided
Neighborhood map
What this means for you Summary
Snapshot
- This is a 3-bed/2.0-bath land listed at $270k.
Deal economics
- At list price, monthly cash flow is $-453 ($-5k/yr) — negative.
- To cash-flow at today's rent, offer at most $204k (24.3% below list).
- To meet the 1% rule (rent ≥ 1% of price), the offer needs to be $179k (33.8% below list).
- Recommended offer: $179k (33.8% below list) — sets the bar for 1% rule.
Location & tenants
- Location reads 69/100 on livability (#459 in FL) — a middle-class / working-renter tenant base. Strengths: cost of living A+, housing A+, crime A-; Watch: amenities F, commute F, health & safety F.
- Santa Rosa (suburban): math 63% / reading 60% proficiency, ranked #8 of 73 in FL (top 11%) — acceptable for families but not a draw, mixed tenant base, ~2y average lease.
- Zoned schools: Bennett C Russell Elementary School (math 55% / reading 59%, grade C+, #781 of 2,144 statewide, top 38%, 819 students, 59% FRL); Pace High School (math 63% / reading 62%, grade B-, #93 of 667 statewide, top 14%, 2,240 students, 34% FRL).
- Market conditions: Rents rising fast (+4.5%/yr); 822 active listings in the ZIP; 3 comparable units currently listed for rent nearby; rentals at typical pace (median 25d on market — plan ~3-4 weeks tenant-placement turnaround); solid renter incomes; 1,983 units permitted in Santa Rosa County in 2024 (128 in 5+ unit buildings).
Forward outlook
- Local home prices are declining (-3.0%/yr); year-one equity from $2k of loan paydown is wiped out by about $8k of value loss. Plan a longer hold.
- Santa Rosa County population projected at +31% by 2050 — long-run rental-demand tailwind backs the buy-and-hold thesis.
Negotiation context
- It's been on market 37 days — a 3% lower offer ($262k) is reasonable based on typical stale-listing flexibility.
Questions for the listing agent
- What do current leases actually rent for vs. the listed asking? Can we see a recent rent roll and the last 12 months of T-12 income?
- It's been on market 37 days. Have you received any prior offers? Is the seller open to a 34% concession, seller financing, or rate buy-down credit?
- Is there a deadline driving the sale (1031 exchange, divorce, estate, relocation)? That informs how much negotiation room exists.
- Schools are D-rated, which usually means shorter tenancies and higher turnover. Who's the typical renter profile here, and what's been the actual vacancy rate?
- The area grade is low — what's the realistic commute time and amenity access for the typical tenant pool here? Any planned neighborhood developments (good or bad) we should know about?
- What's the average days-on-market for RENTAL listings here right now (not sales)? A rising rental-DOM trend means longer vacancies and softer asking-rent achievability than the comps imply.
- What's the recent tenant-quality profile in this submarket — average credit score on applications, eviction rate, late-payment / NSF rate, and stable-employment percentage? A property-management company in the area should have these aggregated.
- How much new for-sale + rental construction is in the pipeline within 1–3 miles? Heavy new supply typically softens prices + rents 12–24 months out; constrained supply supports both.
Investment metrics
- 1% rule
- 0.66% ✗
- Cap rate
- 4.28%
- Cash-on-cash
- -7.19%
- DSCR
- 0.68
- GRM
- 12.6
CMA / ARV
No comps found within radius.
Projected returns pro-forma
-3.0% appreciation · 4.53% rent growth · sell at horizon
- IRR
- -27.1%
- Equity multiple
- 0.08×
- Total profit
- $-69,751
- Equity at exit
- $40,243
- IRR
- -20.3%
- Equity multiple
- -0.14×
- Total profit
- $-85,931
- Equity at exit
- $23,336
Cash invested: $75,572 (down + closing). Projections, not guarantees.
Landlord ↔ Tenant lean methodology
- Overall (STATE)
- 87 Strongly Landlord-Friendly
- State Florida
- 87 Strongly Landlord-Friendly · R+3
- County
- — inherits STATE
- City
- — inherits STATE
ZIP-level market 32583
- Home prices YoY
- -11.3%
- Rents YoY
- 4.5%
- Active inventory
- 822
- Price-to-rent
- 12.6×
Monthly cashflow live
- Estimated rent
- $1,788 medium interval (Pro) →
- Mortgage (P&I)
- −$1,415
- Tax est. 1.5%
- −$337 /mo · $4,048/yr
- Insurance
- −$112
- HOA
- −$0
- Vacancy / Maint / Mgmt
- −$375
- Net cashflow
- $-453
Break-even live
Sensitivity live
| Price | -10% $-266 | -5% $-360 | +0% $-453 | +5% $-546 | +10% $-639 |
|---|---|---|---|---|---|
| Rent | -10% $-594 | -5% $-523 | +0% $-453 | +5% $-382 | +10% $-312 |
| Rate | -1.0pp $-317 | -0.5pp $-384 | base $-453 | +0.5pp $-523 | +1.0pp $-594 |
UW: 25.0% down · 7.5% · 30yr · 1.5% tax · 5.0% vac · 8.0% maint · 8.0% mgmt
Financing live
Cash to close
- Down payment
- $67,475
- Closing costs
- $8,097
- Reserves months
- —
- Total cash needed
- —
Loan-product check · same deal, 3 products live
Conventional
25% down · 7.5% · 30yr
- Down + closing
- —
- Monthly P&I
- —
- Monthly cashflow
- —
- DSCR
- —
- Eligible?
- —
Personal DTI + credit; lowest rate.
DSCR
20% down · 8.5% · 30yr
- Down + closing
- —
- Monthly P&I
- —
- Monthly cashflow
- —
- DSCR
- —
- Eligible?
- —
No personal income docs; deal must DSCR.
Hard money
10% down · 12.0% · 12mo
- Down + closing
- —
- Monthly P&I
- —
- Monthly cashflow
- —
- DSCR
- —
- Eligible?
- —
Short-term bridge; refi at stabilization.
Rent comps 3 comps
| Address | Beds | Baths | Sqft | Rent | $/sqft | DOM | Units | Dist |
|---|---|---|---|---|---|---|---|---|
| 4530 Chantilly Way Milton, FL | 3.0 | 2.0 | 1629 | $1,750 | $1.07 | 25d | 1 | 0.37mi |
| 4355 Park Ct Trlr Park , FL | 2.0 | 1.5 | 1000 | $1,200 | $1.20 | 25d | 1 | 0.40mi |
| 4718 Lemoyne Vista Dr Milton, FL | 3.0 | 2.0 | 1550 | $1,795 | $1.16 | 25d | 1 | 1.36mi |
Listing history 3 events
-
2026-05-22status Pending
-
2026-04-24price $269,900
-
2026-04-15$265,900 Active
ⓘ Source: listings_history table (triggers on properties + properties_extension) + one-shot
backfill from property_details.listing_events for pre-trigger history.
Nearby sold comps map
Loading sold comps map…
Walkable amenities ~0.75 mi
Loading nearby amenities…
Taxation est. · year 1
- Rental income
- $21,455
- − Mortgage interest
- −$15,119
- − Property taxes
- −$4,048
- − Insurance
- −$1,350
- − Repairs & maintenance
- −$1,716
- − Management
- −$1,716
- − Depreciation
- −$7,852
- Taxable loss
- −$10,346
- Est. tax savings @ 24.0%
- +$2,483
- After-tax cash flow
- $-2,950/yr
For passive investors: Depreciation is non-cash, so a rental often shows a tax loss while cash-flowing — sheltering income. Rental losses are passive: they offset passive income freely, and up to $25,000/yr can offset ordinary (W-2) income if you actively participate and your MAGI is under $100k (phasing out to $0 by $150k); unused losses carry forward. On sale, claimed depreciation is recaptured at up to 25%, and gains may owe capital-gains tax (a 1031 exchange can defer both). Figures are a year-1 estimate at your 24.0% rate — not tax advice; consult a CPA.
Schools (NCES district)
- District
- Santa Rosa
- NCES district ID
- 1201650
- Math proficiency
- 63% ▼ -6.00%
- Reading proficiency
- 60% ▼ -5.00%
- Median HH income
- $58,161
- Composite
- 53.12/100
- National rank
- #1511
- State rank
- #8 of 73 in FL
Livability — Pea Ridge
- Score
- 69/100
- State rank
- #459
- US rank
- #8316
Category grades
Schools grade is shown separately in the Schools card above.
Census & demographics
- County
- Santa Rosa County · 194,764 people
- Metro
- Pensacola-Ferry Pass-Brent, FL
- Population (ZIP)
- 31,828
- Household income
- $85,440
- Rent vs Own
- Severe rent burden
- 122.0
Population outlook (Santa Rosa County) Hauer SSP2
- Today (2025)
- 195,978 people
- By 2030
- 209,782 · +7.0%
- By 2040
- 235,293 · +20.1%
- By 2050
- 256,408 · +30.8%
- By 2075
- 298,074 · +52.1%
- By 2100
- 303,216 · +54.7%
Race, ethnicity, and origin ACS 2023
- Neighborhood character
- Predominantly White (74%)
- Race & ethnicity
- White 74% Black 11% Two or more races 10% Hispanic / Latino 6% Asian 1%
- Hispanic origin (detail)
- Mexican 3% Puerto Rican 2% Cuban 1%
- Common ancestry
- Italian 3% Slovak 2% Serbian 2%
- Foreign-born
- 3% · Canada
- Languages at home
- 94% English-only · Spanish 3%
Political lean MEDSL · Santa Rosa
- 2024 margin
- Solid R (+51.0) · D 24.1% · R 75.0%
- 2008→2024 swing
- -3.0pp toward R · 2008: -47.9pp · 2024: -51.0pp
- All cycles
- 2024: R+51.0 2020: R+46.5 2016: R+53.5 2012: R+52.6 2008: R+47.9
Not yet ingested
- Civics
- —
Market trends
- HPI YoY
- ▼ -38.35%
- Current HPI
- 301.8819
- Rent YoY
- ▲ 4.53%
- Metro
- Pensacola-Ferry Pass-Brent, FL
- State GDP YoY
- ▲ 3.28%
- F500 in state
- 36
Industry mix (Fortune 500 HQ in FL)
| Industry | F500 HQs | Revenue |
|---|---|---|
| Industrial Technology | 2 | $29B |
|
||
| Insurance | 2 | $17B |
|
||
| Retail | 1 | $60B |
|
||
| Technology Distribution | 1 | $58B |
|
||
| Homebuilding | 1 | $35B |
|
||
| Technology Manufacturing | 1 | $35B |
|
||
Price history
+1.5% since first listed3 events — show timeline
- 2026-05-22 Pending — PARMLS
- 2026-04-24 Price Changed $269,900 PARMLS
- 2026-04-15 Listed $265,900 PARMLS
Property tax history
+8.1%/yrLatest (2025): $238 · +18.0% YoY. Source: county tax records.
Cash-flow waterfall
monthlySold comps — $/sqft
last 12 mo · ≤1 miLoading sold comps…