 Multi-family
29 Chester Ct · New York, NY
Flood risk 7/10 · Major
- FEMA flood zone
- X (unshaded)
- Chance of flooding over 30 yrs
- 0.76%
- Est. flood insurance / yr
- $507 – $1,088
Fire risk 1/10 · Minimal
- Est. fire insurance / yr
- $691 – $1,283
Heat risk 7/10 · Major
- Hot days now (above 99°F)
- 7 days/yr
- Hot days in 30 yrs
- 15 days/yr
Wind risk 6/10 · Moderate
- Chance of severe wind over 30 yrs
- 62.0%
Air-quality risk 4/10 · Minor
- Unhealthy air days now
- 5 days/yr
- Unhealthy air days in 30 yrs
- 7 days/yr
Risk factors via First Street. Map © Google.
Why this score? — see what drove the D grade
The composite is a weighted blend of 9 inputs, each scored 0–100. Each bar is that input's sub-score; the figure is the points it added to the 100-point composite (weight × sub-score).
- ARV discount +10.6/15.0
- Appreciation +8.4/10.0
- Cash flow +7.5/30.0
- Schools +5.0/10.0
- Livability +3.8/5.0
- Rent growth +3.6/5.0
- Condition / age +2.5/5.0
- DSCR +1.6/10.0
- 1% rule +1.1/10.0
$1,600,000
🖨 Deal sheet (PDF) 📄 Offer letter ✓ Due diligence
Multi-family units
County records classify this as Multi-Family (2-4 Unit). Listing-text estimate: 1 unit. estimate disagrees with records
Listing remarks MLS
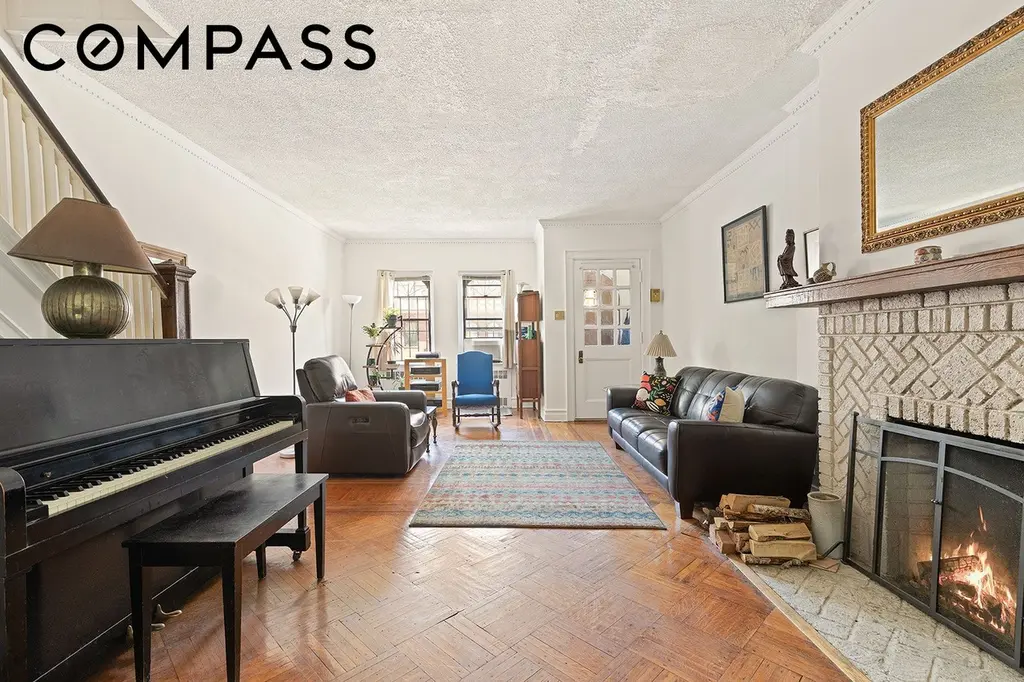
THREE FAMILY BEING USED AS ONE FAMILY. BRICK TRIPLEX, 4 BEDROOMS, 3 BATHS, WOODFLOORS, SOME ORIGINAL DETAILS. FULL FINISHED BASEMENT. WE HAVE KEYS.
Key facts
- Rear garden
- Finished basement
- Near subway lines
Tags
Property features AI
Finance
- Financial info: Pets not allowed (building restriction)
- HOA & community: HOA fees collected monthly
Exterior
- Home design: Entry level: 1; 3 stories (building); 4 stories total
- Construction: Lot size approximately 1,632
- Exterior features: Private outdoor space over 60 sqft; Private yard; Patio
Interior
- Bedrooms: Total rooms: 9
- Flooring: Hardwood
- Bathrooms: 3 full bathrooms
- Interior features: Unfurnished; Hardwood floors; Full basement; Has fireplace (1)
- Laundry & utility: Washer; Dryer; Laundry details: see remarks
Neighborhood map
What this means for you Summary
Snapshot
- This is a 4-bed/3.0-bath multifamily listed at $1.60M.
Deal economics
- At list price, monthly cash flow is $-2k ($-25k/yr) — negative.
- To cash-flow at today's rent, offer at most $1.24M (22.6% below list).
- To meet the 1% rule (rent ≥ 1% of price), the offer needs to be $970k (39.4% below list).
- Recommended offer: $970k (39.4% below list) — sets the bar for 1% rule.
- Cap rate 4.8% vs local median 2.6% in New York — top-decile yield for the area; either an underpriced asset or a hidden risk that comps aren't pricing in. Stress-test before assuming the spread holds.
Location & tenants
- Location reads 75/100 on livability (#268 in NY, #4,188 nationally) — a middle-class / working-renter tenant base. Strengths: amenities A+, commute A+, health & safety A; Watch: crime F, cost of living F.
- Zoned schools: Elm Tree Elementary School (math 27% / reading 52%, grade F, #1,444 of 2,108 statewide, top 71%, 806 students, 94% FRL); Jhs 383 Philippa Schuyler (math 32% / reading 67%, grade C, #280 of 729 statewide, top 40%, 822 students, 85% FRL); Midwood High School (math 94% / reading 96%, grade A+, #83 of 1,100 statewide, top 8%, 4,062 students, 73% FRL).
- Market conditions: Rents rising fast (+4.3%/yr); 76 active listings in the ZIP; 1 comparable units currently listed for rent nearby; solid renter incomes; 10,063 units permitted in Kings County in 2024 (9,789 in 5+ unit buildings).
- At $9,700/mo this rent would consume 131% of the median local household income ($89k/yr) (locally 5410% of renters already pay >50% of income on rent) — very limited rent-growth headroom before tenants either downsize or default.
Forward outlook
- In year one you build about $121k of equity ($11k loan paydown + $110k appreciation (6.9% local appreciation)).
- Kings County population projected at +13% by 2050 — modest demand growth; plan on rents tracking national, not racing it.
- By year 2, paydown + projected appreciation supports a ~$193k cash-out refi (75% LTV) — recoverable capital for the next deal without selling this one.
Negotiation context
- It's been on market 18 days — a 2% lower offer ($1.58M) is reasonable based on typical stale-listing flexibility.
- 2 sale attempts since 21y ago with the ask held roughly flat each time — persistent listings suggest the price (not the market) is what's stuck; bring a comps-based counter.
- Current owner paid $721k; list at $1.60M implies a 122% gain — meaningful room to come down on a strong offer.
Risks & watch-outs
- Watch-outs: flood insurance adds $66/mo; built in 1910 — expect roof / HVAC / electrical / plumbing capex.
- Climate carrying-cost: major flood risk; major wind risk, 62% chance of damaging wind over 30y; extreme-heat days projected 7→15/yr by 2055 (HVAC capex compounding) — expect insurance premiums to compound above CPI over the hold.
Questions for the listing agent
- What do current leases actually rent for vs. the listed asking? Can we see a recent rent roll and the last 12 months of T-12 income?
- Built in 1910 — when were the roof, HVAC, electrical panel, plumbing, and water heater last replaced?
- What's the actual annual flood-insurance premium (NFIP or private), and is the property in a SFHA with mandatory coverage?
- Is there a deadline driving the sale (1031 exchange, divorce, estate, relocation)? That informs how much negotiation room exists.
- Schools are B-rated — typically a magnet for longer-tenancy family renters. What's the average tenant stay here, and is there a school-zone premium baked into asking?
- Crime grade is F in this area — have there been break-ins, vandalism, or insurance claims at this property in the last 3 years? What carrier currently insures it and at what premium?
- The area grade is low — what's the realistic commute time and amenity access for the typical tenant pool here? Any planned neighborhood developments (good or bad) we should know about?
- What's the average days-on-market for RENTAL listings here right now (not sales)? A rising rental-DOM trend means longer vacancies and softer asking-rent achievability than the comps imply.
- What's the recent tenant-quality profile in this submarket — average credit score on applications, eviction rate, late-payment / NSF rate, and stable-employment percentage? A property-management company in the area should have these aggregated.
- How much new apartment / multifamily construction is in the pipeline within 1–3 miles? Heavy new supply (>2% of stock underway) typically softens rents 12–24 months out; light construction supports rent growth.
Investment metrics
- 1% rule
- 0.61% ✗
- Cap rate
- 4.81%
- Cash-on-cash
- -5.30%
- DSCR
- 0.76
- GRM
- 13.7
CMA / ARV
- ARV (on-the-fly)
- $1,719,968
- Comps found
- 2
Show comp detail 2 sales within ~0.75 mi
| Address | Dist | Beds/Ba | Sqft | Sold | Price | $/sf | Match |
|---|---|---|---|---|---|---|---|
| 5 Temple Ct | 0.72mi | 4/2.0 | 1,800 (-5%) | 8mo | $1,640,000 | $911 | 48 |
| 178 Lefferts Ave | 0.41mi | 5/2.0 (+1) | 2,144 (+14%) | 3mo | $1,650,000 | $770 | 46 |
Match score weights: distance 35% · size 25% · config 20% · recency 20%. Top-matched comps best support the ARV.
Projected returns pro-forma
6.87% appreciation · 4.33% rent growth · sell at horizon
- IRR
- 13.5%
- Equity multiple
- 1.95×
- Total profit
- $427,595
- Equity at exit
- $1,094,678
- IRR
- 14.1%
- Equity multiple
- 4.06×
- Total profit
- $1,369,138
- Equity at exit
- $2,066,765
Cash invested: $448,000 (down + closing). Projections, not guarantees.
Landlord ↔ Tenant lean methodology
- Overall (CITY)
- 0 Strongly Tenant-Friendly
- State New York
- 15 Strongly Tenant-Friendly · D+10
- County
- — inherits STATE
- City New York
- 0 Strongly Tenant-Friendly · D+34
ZIP-level market 11225
- Home prices YoY
- 1.6%
- Rents YoY
- 4.3%
- Active inventory
- 76
- Price-to-rent
- 41.2×
Monthly cashflow live
- Estimated rent
- $9,700 high interval (Pro) →
- Mortgage (P&I)
- −$8,391
- Tax from tax record
- −$586 /mo · $7,031/yr
- Insurance
- −$667
- Flood insurance flood zone
- −$66 /mo · $798/yr
- HOA
- −$0
- Vacancy / Maint / Mgmt
- −$2,037
- Net cashflow
- $-2,047
Break-even live
Sensitivity live
| Price | -10% $-1,141 | -5% $-1,594 | +0% $-2,047 | +5% $-2,500 | +10% $-2,952 |
|---|---|---|---|---|---|
| Rent | -10% $-2,813 | -5% $-2,430 | +0% $-2,047 | +5% $-1,664 | +10% $-1,280 |
| Rate | -1.0pp $-1,241 | -0.5pp $-1,640 | base $-2,047 | +0.5pp $-2,461 | +1.0pp $-2,883 |
3-unit breakdown (identical units grouped — click to expand)
| Units | Beds | Baths | Est. rent |
|---|---|---|---|
| 3× units | 2 | 1.5 | $9,699 |
| #1 | 2 | 1.5 | $3,233 |
| #2 | 2 | 1.5 | $3,233 |
| #3 | 2 | 1.5 | $3,233 |
| Total (3 units) | $9,700 | ||
UW: 25.0% down · 7.5% · 30yr · 1.5% tax · 5.0% vac · 8.0% maint · 8.0% mgmt
Financing live
Cash to close
- Down payment
- $400,000
- Closing costs
- $48,000
- Reserves months
- —
- Total cash needed
- —
Loan-product check · same deal, 3 products live
Conventional
25% down · 7.5% · 30yr
- Down + closing
- —
- Monthly P&I
- —
- Monthly cashflow
- —
- DSCR
- —
- Eligible?
- —
Personal DTI + credit; lowest rate.
DSCR
20% down · 8.5% · 30yr
- Down + closing
- —
- Monthly P&I
- —
- Monthly cashflow
- —
- DSCR
- —
- Eligible?
- —
No personal income docs; deal must DSCR.
Hard money
10% down · 12.0% · 12mo
- Down + closing
- —
- Monthly P&I
- —
- Monthly cashflow
- —
- DSCR
- —
- Eligible?
- —
Short-term bridge; refi at stabilization.
Rent comps 1 comps
| Address | Beds | Baths | Sqft | Rent | $/sqft | DOM | Units | Dist |
|---|---|---|---|---|---|---|---|---|
| 1065 Sterling Pl Unit Gdn Brooklyn, NY | 3.0 | 1.5 | 1736 | $5,995 | $3.45 | 8d | 1 | 1.36mi |
Listing history 11 events
-
2026-06-21days on market $1,600,000 Active 18 DOM
-
2026-06-18days on market $1,600,000 Active 15 DOM
-
2026-06-17days on market $1,600,000 Active 14 DOM
-
2026-06-16days on market $1,600,000 Active 13 DOM
-
2026-06-15days on market $1,600,000 Active 12 DOM
-
2026-06-13days on market $1,600,000 Active 10 DOM
-
2026-06-09days on market $1,600,000 Active 6 DOM
-
2026-06-08days on market $1,600,000 Active 5 DOM
-
2026-06-07days on market $1,600,000 Active 4 DOM
-
2026-06-04remarks 693-char remark
-
2026-06-04$1,600,000 Active 1 DOM
ⓘ Source: listings_history table (triggers on properties + properties_extension) + one-shot
backfill from property_details.listing_events for pre-trigger history.
Tax reassessment forecast NY · Partial reset (capped growth)
- Current annual tax
- $7,031 · $586/mo
- Projected year-2 tax
- $17,036 · $1,420/mo
- Expected delta
- +$10,004/yr (+$834/mo · 142.3%)
ⓘ Screening estimate from a state-policy table — verify with the county assessor before closing.
Climate risk First Street
- Flood 7/10 Severe FEMA zone X (unshaded) · 76% chance over 30 yrs
- Wildfire 1/10 Low
- Heat 7/10 Severe 7 d/yr ≥99°F today · 15 d/yr by 30 yrs out
- Wind 6/10 Major 62% chance of damaging wind over 30 yrs
- Air quality 4/10 Moderate 5 unhealthy d/yr today · 7 by 30 yrs out
Nearby sold comps map
Loading sold comps map…
Walkable amenities ~0.75 mi
Loading nearby amenities…
Taxation est. · year 1
- Rental income
- $116,400
- − Mortgage interest
- −$89,625
- − Property taxes
- −$7,031
- − Insurance
- −$8,798
- − Repairs & maintenance
- −$9,312
- − Management
- −$9,312
- − Depreciation
- −$46,545
- Taxable loss
- −$54,223
- Est. tax savings @ 24.0%
- +$13,014
- After-tax cash flow
- $-11,546/yr
For passive investors: Depreciation is non-cash, so a rental often shows a tax loss while cash-flowing — sheltering income. Rental losses are passive: they offset passive income freely, and up to $25,000/yr can offset ordinary (W-2) income if you actively participate and your MAGI is under $100k (phasing out to $0 by $150k); unused losses carry forward. On sale, claimed depreciation is recaptured at up to 25%, and gains may owe capital-gains tax (a 1031 exchange can defer both). Figures are a year-1 estimate at your 24.0% rate — not tax advice; consult a CPA.
Schools (NCES district)
No district data.
Livability — New York
- Score
- 75/100
- State rank
- #268
- US rank
- #4188
Category grades
Schools grade is shown separately in the Schools card above.
Census & demographics
- Census place
- New York, NY
- County
- Kings County · 2,614,986 people
- City population
- 7,731,280
- Metro
- New York-Newark-Jersey City, NY-NJ-PA
- Population (ZIP)
- 58,158
- Household income
- $88,568
- Rent vs Own
- Severe rent burden
- 5410.0
Population outlook (Kings County) Hauer SSP2
- Today (2025)
- 2,847,441 people
- By 2030
- 2,937,006 · +3.1%
- By 2040
- 3,095,491 · +8.7%
- By 2050
- 3,228,968 · +13.4%
- By 2075
- 3,321,723 · +16.7%
- By 2100
- 3,111,387 · +9.3%
Race, ethnicity, and origin ACS 2023
- Neighborhood character
- Diverse neighborhood (Simpson 0.63)
- Race & ethnicity
- Black 53% White 27% Hispanic / Latino 10% Two or more races 9% Asian 3%
- Hispanic origin (detail)
- Puerto Rican 2% Dominican 2%
- Common ancestry
- Hispanic 5% Romanian 2% Italian 2%
- Foreign-born
- 32% · Canada, Jamaica, Mexico
- Languages at home
- 76% English-only · Spanish 8% French/Haitian/Cajun 7% German/W. Germanic 3%
Political lean MEDSL · Kings
- 2024 margin
- Solid D (+44.0) · D 72.0% · R 28.0%
- 2008→2024 swing
- -15.5pp toward R · 2008: 59.4pp · 2024: 44.0pp
- All cycles
- 2024: D+44.0 2020: D+54.8 2016: D+61.8 2012: D+63.9 2008: D+59.4
Not yet ingested
- Civics
- —
Market trends
- HPI YoY
- ▲ 6.87%
- Current HPI
- 446.6541
- Rent YoY
- ▲ 4.33%
- Metro
- New York-Newark-Jersey City, NY-NJ-PA
- State GDP YoY
- ▲ 2.60%
- F500 in state
- 92
Industry mix (Fortune 500 HQ in NY)
| Industry | F500 HQs | Revenue |
|---|---|---|
| Financial Services | 10 | $950B |
|
||
| Consumer Goods | 9 | $162B |
|
||
| Insurance | 4 | $225B |
|
||
| Telecommunications | 2 | $144B |
|
||
| Pharmaceuticals | 2 | $112B |
|
||
| Media / Entertainment | 2 | $69B |
|
||
Price history
+2252.9% since first listed6 events — show timeline
- 2026-06-03 Listed $1,600,000 RLS at REBNY
- 2008-08-04 Sold (Public Records) $721,000 Public Records
- 2006-07-10 Sold (Public Records) $660,000 Public Records
- 2005-11-14 Sold (Public Records) $335,000 Public Records
- 2005-10-17 Listed $665,000 BNYMLS
- 1984-01-01 Sold (Public Records) $68,000 Public Records
Property tax history
+5.6%/yrLatest (2025): $7,031 · +3.4% YoY. Source: county tax records.
Cash-flow waterfall
monthlySold comps — $/sqft
last 12 mo · ≤1 miLoading sold comps…