 Multi-family
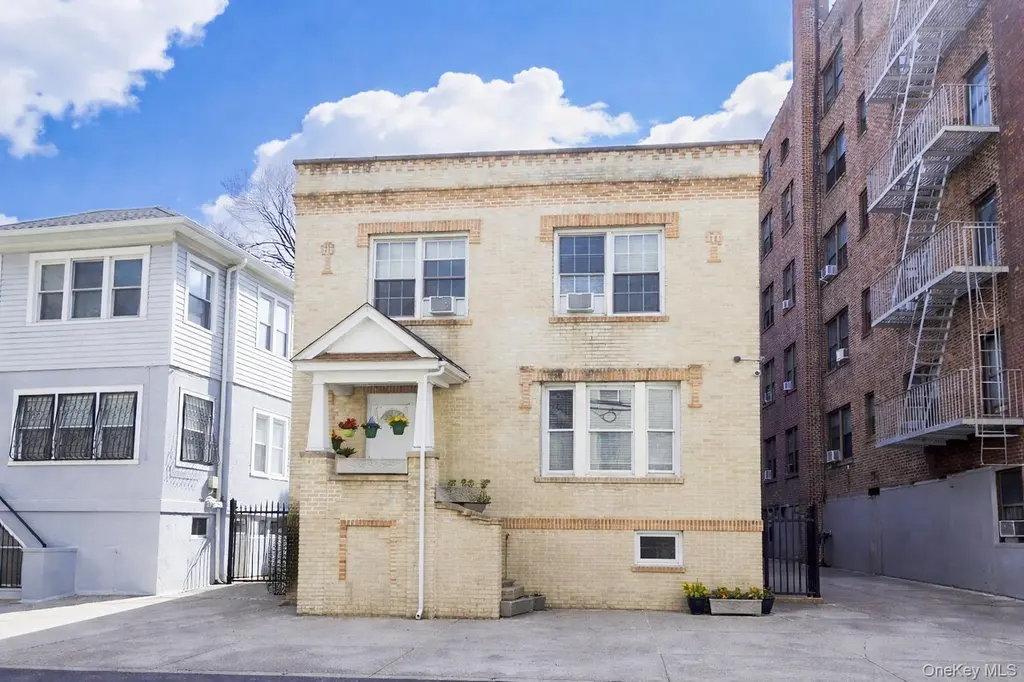
152 Livingston Ave · Yonkers, NY
Flood risk 7/10 · Major
- FEMA flood zone
- X (unshaded)
- Chance of flooding over 30 yrs
- 0.77%
- Est. flood insurance / yr
- $473 – $860
Fire risk 1/10 · Minimal
- Est. fire insurance / yr
- $691 – $1,283
Heat risk 6/10 · Moderate
- Hot days now (above 99°F)
- 7 days/yr
- Hot days in 30 yrs
- 15 days/yr
Wind risk 6/10 · Moderate
- Chance of severe wind over 30 yrs
- 27.0%
Air-quality risk 3/10 · Minor
- Unhealthy air days now
- 3 days/yr
- Unhealthy air days in 30 yrs
- 4 days/yr
Risk factors via First Street. Map © Google.
Why this score? — see what drove the C- grade
The composite is a weighted blend of 9 inputs, each scored 0–100. Each bar is that input's sub-score; the figure is the points it added to the 100-point composite (weight × sub-score).
- ARV discount +15.0/15.0
- Cash flow +13.9/30.0
- Rent growth +4.8/5.0
- DSCR +4.2/10.0
- Schools +4.1/10.0
- 1% rule +3.9/10.0
- Livability +3.4/5.0
- Condition / age +2.5/5.0
- Appreciation +0.0/10.0
$769,900
🖨 Deal sheet 📄 Offer letter ✓ Due diligence
Multi-family units
County records classify this as Multi-Family (2-4 Unit). Listing-text estimate: 1 unit. estimate disagrees with records
Listing remarks
Welcome to this multi-family property offering two generous apartments - perfect for investors or owner-occupants alike. With great bones and tons of potential, this home is ready for your personal touch or updates. This impressive property offers approximately 2,400 square feet of living space featuring 6 bedrooms and 2 full bathrooms. 148 Livingston is just 25 minutes from NYC and features a driveway suitable for multiple cars as well as a detached garage. The first floor unit features 3 comfortable bedrooms, a charming wood-burning fireplace and a separate dining area ideal for everyday meals or entertaining. The second floor apartment offers an eat-in-kitchen and 3 bedrooms, providing r
Key facts
- Eat-in-kitchen
- Detached garage
- Separate dining area
Tags
Property features AI
Exterior
- Parking: Driveway; One-car garage
- Utilities: Electricity connected (Con-Edison); Natural gas connected; Public sewer; Water connected
- Home design: Duplex
- Construction: Brick construction
- Exterior features: Brick exterior; Not waterfront
Interior
- Kitchen: Eat-in kitchen
- Bedrooms: Two 3-bedroom units
- Flooring: Combination flooring
- Bathrooms: Two full bathrooms
- Heating & cooling: Oil heating; Wall/window air conditioning units
- Interior features: Eat-in kitchen; Basement with storage space
- Laundry & utility: Laundry in basement
Neighborhood map
What this means for you Summary
Snapshot
- This is a 6-bed/2.0-bath multifamily listed at $770k.
Deal economics
- At list price, monthly cash flow is $35 ($424/yr) — positive.
- The deal already cash-flows at list — no discount required.
- To meet the 1% rule (rent ≥ 1% of price), the offer needs to be $685k (11.0% below list).
- Recommended offer: $685k (11.0% below list) — sets the bar for 1% rule.
- Cap rate 6.4% vs local median 5.3% in Yonkers — meaningfully above typical; check what's discounted (condition, days-on-market, listing class) to confirm the premium yield is real.
Location & tenants
- Location reads 68/100 on livability (#528 in NY) — a middle-class / working-renter tenant base. Strengths: employment A, commute B; Watch: amenities F, cost of living F.
- Yonkers City School District (suburban): math 41% / reading 54% proficiency, ranked #413 of 590 in NY (top 70%) — families likely to look elsewhere, expect single-tenant / working-renter base with shorter leases; 64% free/reduced lunch — lower-income household profile, screen leases tightly.
- Zoned schools: Yonkers Early Childhood Academy (327 students, 72% FRL); Yonkers Middle School (math 17% / reading 37%, grade F, #587 of 729 statewide, top 81%, 601 students, 88% FRL); Yonkers High School (math 92% / reading 88%, grade A+, #238 of 1,100 statewide, top 23%, 1,060 students, 76% FRL) — zoned schools average 79% FRL vs 64% district-wide (15 pts higher); higher-poverty schools than district average — tighter screening recommended.
- Market conditions: Rents rising fast (+9.0%/yr); 86 active listings in the ZIP; 954 units permitted in Westchester County in 2024 (649 in 5+ unit buildings).
- At $6,850/mo this rent would consume 121% of the median local household income ($68k/yr) (locally 2783% of renters already pay >50% of income on rent) — very limited rent-growth headroom before tenants either downsize or default.
Forward outlook
- Local home prices are declining (-3.0%/yr); year-one equity from $5k of loan paydown is wiped out by about $23k of value loss. Plan a longer hold.
- Westchester County population projected at +10% by 2050 — modest demand growth; plan on rents tracking national, not racing it.
Negotiation context
- Only 10 days on market — expect competitive offers; lowballing is unlikely to land.
- Current owner paid $140k; list at $770k implies a 450% gain — meaningful room to come down on a strong offer.
Risks & watch-outs
- Watch-outs: flood insurance adds $56/mo; built in 1930 — expect roof / HVAC / electrical / plumbing capex.
- Climate carrying-cost: major flood risk; major wind risk, 27% chance of damaging wind over 30y; extreme-heat days projected 7→15/yr by 2055 (HVAC capex compounding) — expect insurance premiums to compound above CPI over the hold.
Questions for the listing agent
- Built in 1930 — when were the roof, HVAC, electrical panel, plumbing, and water heater last replaced?
- What's the actual annual flood-insurance premium (NFIP or private), and is the property in a SFHA with mandatory coverage?
- Is there a deadline driving the sale (1031 exchange, divorce, estate, relocation)? That informs how much negotiation room exists.
- What's the average days-on-market for RENTAL listings here right now (not sales)? A rising rental-DOM trend means longer vacancies and softer asking-rent achievability than the comps imply.
- What's the recent tenant-quality profile in this submarket — average credit score on applications, eviction rate, late-payment / NSF rate, and stable-employment percentage? A property-management company in the area should have these aggregated.
- How much new apartment / multifamily construction is in the pipeline within 1–3 miles? Heavy new supply (>2% of stock underway) typically softens rents 12–24 months out; light construction supports rent growth.
Investment metrics
- 1% rule
- 0.89% ✗
- Cap rate
- 6.43%
- Cash-on-cash
- 0.51%
- DSCR
- 1.02
- GRM
- 9.4
CMA / ARV
- ARV (median comp)
- $1,386,502
- List price
- $769,900
- Delta
- -44.47%
- Verdict
- UNDERPRICED
- Comps
- 20 within 1.0 mi
Show comp detail 5 sales within ~0.75 mi
| Address | Dist | Beds/Ba | Sqft | Sold | Price | $/sf | Match |
|---|---|---|---|---|---|---|---|
| 28 Ludlow St | 0.40mi | 7/3.0 (+1) | 2,446 (+1%) | 5mo | $760,000 | $311 | 66 |
| 84 Livingston Ave | 0.18mi | 6/4.0 | 2,303 (-5%) | 16mo | $740,000 | $321 | 62 |
| 22 Landscape Ave | 0.34mi | 5/3.0 (-1) | 2,694 (+12%) | 6mo | $999,999 | $371 | 51 |
| 166 Park Hill Ave Yonkers | 0.66mi | 5/3.0 (-1) | 2,300 (-5%) | 3mo | $855,000 | $372 | 50 |
| 10 Euclid Ave | 0.71mi | 6/3.0 | 2,256 (-7%) | 18mo | $880,000 | $390 | 37 |
Match score weights: distance 35% · size 25% · config 20% · recency 20%. Top-matched comps best support the ARV.
Projected returns pro-forma
-3.0% appreciation · 8.0% rent growth · sell at horizon
- IRR
- -10.5%
- Equity multiple
- 0.60×
- Total profit
- $-86,167
- Equity at exit
- $114,795
- IRR
- 4.8%
- Equity multiple
- 1.43×
- Total profit
- $93,189
- Equity at exit
- $66,567
Cash invested: $215,572 (down + closing). Projections, not guarantees.
Landlord ↔ Tenant lean methodology
- Overall (CITY)
- 5 Strongly Tenant-Friendly
- State New York
- 15 Strongly Tenant-Friendly · D+10
- County
- — inherits STATE
- City Yonkers
- 5 Strongly Tenant-Friendly · D+20
ZIP-level market 10705
- Rents YoY
- 9.0%
- Active inventory
- 86
- Price-to-rent
- 18.7×
Monthly cashflow live
- Estimated rent
- $6,850 high interval (Pro) →
- Mortgage (P&I)
- −$4,037
- Tax est. 1.5%
- −$962 /mo · $11,548/yr
- Insurance
- −$321
- Flood insurance flood zone
- −$56 /mo · $666/yr
- HOA
- −$0
- Vacancy / Maint / Mgmt
- −$1,438
- Net cashflow
- $35
Break-even live
2-unit breakdown (identical units grouped — click to expand)
| Units | Beds | Baths | Est. rent |
|---|---|---|---|
| 2× units | 3 | 1.5 | $6,850 |
| #1 | 3 | 1.5 | $3,425 |
| #2 | 3 | 1.5 | $3,425 |
| Total (2 units) | $6,850 | ||
UW: 25.0% down · 7.5% · 30yr · 1.5% tax · 5.0% vac · 8.0% maint · 8.0% mgmt
Financing live
Cash to close
- Down payment
- $192,475
- Closing costs
- $23,097
- Reserves months
- —
- Total cash needed
- —
Loan-product check · same deal, 3 products live
Conventional
25% down · 7.5% · 30yr
- Down + closing
- —
- Monthly P&I
- —
- Monthly cashflow
- —
- DSCR
- —
- Eligible?
- —
Personal DTI + credit; lowest rate.
DSCR
20% down · 8.5% · 30yr
- Down + closing
- —
- Monthly P&I
- —
- Monthly cashflow
- —
- DSCR
- —
- Eligible?
- —
No personal income docs; deal must DSCR.
Hard money
10% down · 12.0% · 12mo
- Down + closing
- —
- Monthly P&I
- —
- Monthly cashflow
- —
- DSCR
- —
- Eligible?
- —
Short-term bridge; refi at stabilization.
Listing history 3 events
-
2026-06-07statusdays on market $769,900 Pending 10 DOM
-
2026-05-05$769,900 Active
-
1998-07-21soldstatus $140,000
ⓘ Source: listings_history table (triggers on properties + properties_extension) + one-shot
backfill from property_details.listing_events for pre-trigger history.
Climate risk First Street
- Flood 7/10 Severe FEMA zone X (unshaded) · 77% chance over 30 yrs
- Wildfire 1/10 Low
- Heat 6/10 Major 7 d/yr ≥99°F today · 15 d/yr by 30 yrs out
- Wind 6/10 Major 27% chance of damaging wind over 30 yrs
- Air quality 3/10 Moderate 3 unhealthy d/yr today · 4 by 30 yrs out
Nearby sold comps map
Loading sold comps map…
Walkable amenities ~0.75 mi
Loading nearby amenities…
Taxation est. · year 1
- Rental income
- $82,200
- − Mortgage interest
- −$43,126
- − Property taxes
- −$11,548
- − Insurance
- −$4,516
- − Repairs & maintenance
- −$6,576
- − Management
- −$6,576
- − Depreciation
- −$22,397
- Taxable loss
- −$12,540
- Est. tax savings @ 24.0%
- +$3,010
- After-tax cash flow
- $3,434/yr
For passive investors: Depreciation is non-cash, so a rental often shows a tax loss while cash-flowing — sheltering income. Rental losses are passive: they offset passive income freely, and up to $25,000/yr can offset ordinary (W-2) income if you actively participate and your MAGI is under $100k (phasing out to $0 by $150k); unused losses carry forward. On sale, claimed depreciation is recaptured at up to 25%, and gains may owe capital-gains tax (a 1031 exchange can defer both). Figures are a year-1 estimate at your 24.0% rate — not tax advice; consult a CPA.
Schools (NCES district)
- District
- Yonkers City School District
- NCES district ID
- 3631920
- Math proficiency
- 41% ▼ -1.00%
- Reading proficiency
- 54% ▲ 14.00%
- Median HH income
- $58,042
- Composite
- 41.43/100
- National rank
- #3471
- State rank
- #413 of 590 in NY
Livability — Yonkers
- Score
- 68/100
- State rank
- #528
- US rank
- #9394
Category grades
Schools grade is shown separately in the Schools card above.
Census & demographics
- Census place
- Yonkers, NY
- County
- Westchester County · 709,332 people
- City population
- 212,407
- Metro
- New York-Newark-Jersey City, NY-NJ-PA
- Population (ZIP)
- 38,887
- Household income
- $67,918
- Rent vs Own
- Severe rent burden
- 2783.0
Population outlook (Westchester County) Hauer SSP2
- Today (2025)
- 1,028,035 people
- By 2030
- 1,051,636 · +2.3%
- By 2040
- 1,098,520 · +6.9%
- By 2050
- 1,136,044 · +10.5%
- By 2075
- 1,196,925 · +16.4%
- By 2100
- 1,175,147 · +14.3%
Race, ethnicity, and origin ACS 2023
- Neighborhood character
- Diverse neighborhood (Simpson 0.56)
- Race & ethnicity
- Hispanic / Latino 62% White 17% Two or more races 16% Black 12% Asian 5% Native American 1%
- Hispanic origin (detail)
- Mexican 13% Puerto Rican 9% Dominican 27%
- Common ancestry
- Scotch-Irish 1% Romanian 1%
- Foreign-born
- 40% · Canada, Jamaica, South Korea
- Languages at home
- 39% English-only · Spanish 51% Other Indo-European 3% Other Asian/Pacific 2%
Political lean MEDSL · Westchester
- 2024 margin
- Strong D (+26.3) · D 63.1% · R 36.9%
- 2008→2024 swing
- -1.3pp toward R · 2008: 27.6pp · 2024: 26.3pp
- All cycles
- 2024: D+26.3 2020: D+36.3 2016: D+32.8 2012: D+22.2 2008: D+27.6
Not yet ingested
- Civics
- —
Market trends
- HPI YoY
- ▼ -368.22%
- Current HPI
- 314.1777
- Rent YoY
- ▲ 9.00%
- Metro
- New York-Newark-Jersey City, NY-NJ-PA
- State GDP YoY
- ▲ 2.60%
- F500 in state
- 92
Industry mix (Fortune 500 HQ in NY)
| Industry | F500 HQs | Revenue |
|---|---|---|
| Financial Services | 10 | $950B |
|
||
| Consumer Goods | 9 | $162B |
|
||
| Insurance | 4 | $225B |
|
||
| Telecommunications | 2 | $144B |
|
||
| Pharmaceuticals | 2 | $112B |
|
||
| Media / Entertainment | 2 | $69B |
|
||
Price history
+449.9% since first listed3 events — show timeline
- 2026-06-05 Pending — OneKey® MLS as Distributed by MLS Grid
- 2026-05-05 Listed $769,900 OneKey® MLS as Distributed by MLS Grid
- 1998-07-21 Sold (Public Records) $140,000 Public Records
Property tax history
-24.2%/yrLatest (2025): $1,302 · +0.6% YoY. Source: county tax records.
Cash-flow waterfall
monthlySold comps — $/sqft
last 12 mo · ≤1 miLoading sold comps…