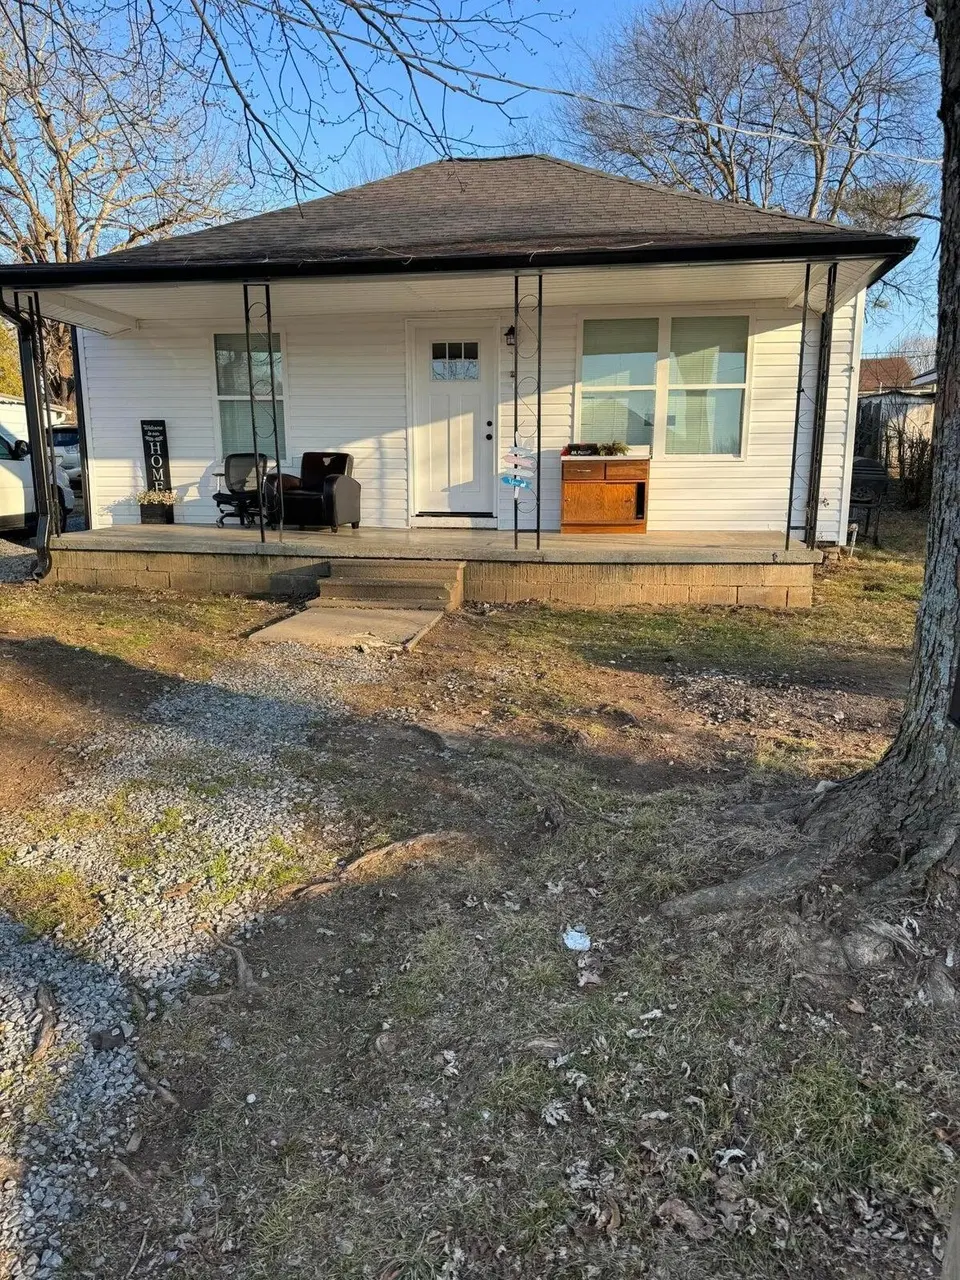
1335 Aurora Ave SE · Cleveland, TN
Flood risk 1/10 · Minimal
- FEMA flood zone
- X (unshaded)
- Chance of flooding over 30 yrs
- 0.0%
- Est. flood insurance / yr
- $507 – $1,088
Fire risk 2/10 · Minimal
- Est. fire insurance / yr
- $949 – $1,763
Heat risk 6/10 · Moderate
- Hot days now (above 104°F)
- 7 days/yr
- Hot days in 30 yrs
- 19 days/yr
Wind risk 3/10 · Minor
- Chance of severe wind over 30 yrs
- 5.0%
Air-quality risk 3/10 · Minor
- Unhealthy air days now
- 2 days/yr
- Unhealthy air days in 30 yrs
- 2 days/yr
Risk factors via First Street. Map © Google.
Why this score? — see what drove the D- grade
The composite is a weighted blend of 9 inputs, each scored 0–100. Each bar is that input's sub-score; the figure is the points it added to the 100-point composite (weight × sub-score).
- Cash flow +16.2/30.0
- DSCR +5.0/10.0
- ARV discount +4.2/15.0
- Livability +3.5/5.0
- 1% rule +3.2/10.0
- Rent growth +3.2/5.0
- Condition / age +2.5/5.0
- Schools +2.1/10.0
- Appreciation +0.0/10.0
$180,000
🖨 Deal sheet (PDF) 📄 Offer letter ✓ Due diligence
Listing remarks MLS
Welcome to this fully renovated 3-bedroom, 1.5-bath home where every detail has been carefully updated for modern living. The home features brand new plumbing, electrical, roof, and HVAC, providing peace of mind for years to come. Inside, you'll find a bright and open floor plan with spacious living areas that flow into a beautifully updated kitchen with new cabinetry, new countertops, and stainless-steel appliances. The bedrooms are filled with natural light, while the bathrooms have been refreshed with stylish finishes. Outside, the private backyard offers the perfect space for entertaining, gardening, or simply relaxing. This home has a paying tenant already in place, making it an excellent opportunity for both homeowners and investors alike.
Key facts
- Fully renovated
- New plumbing
- New hvac
Tags
Property features AI
Exterior
- Parking: Gravel parking
- Utilities: Public water; Public sewer; Electricity connected; Sewer connected; Water connected
- Home design: Single-family residence; One level; Updated / remodeled
- Construction: Vinyl siding; Block foundation; Shingle roof; Built (year not provided)
- Exterior features: Rain gutters; Covered front porch
Interior
- Kitchen: Refrigerator; Electric range; Dishwasher; Electric water heater
- Flooring: Vinyl
- Bathrooms: 1 full bathroom; 1 half bathroom
- Heating & cooling: Central heating; Central air conditioning
- Interior features: See remarks
- Laundry & utility: See remarks
Neighborhood map
What this means for you Summary
Snapshot
- This is a 3-bed/1.0-bath single-family listed at $180k.
Deal economics
- At list price, monthly cash flow is $94 ($1k/yr) — positive.
- The deal already cash-flows at list — no discount required.
- To meet the 1% rule (rent ≥ 1% of price), the offer needs to be $147k (18.5% below list).
- Recommended offer: $147k (18.5% below list) — sets the bar for 1% rule.
- Cap rate 6.9% vs local median 3.5% in Cleveland — top-decile yield for the area; either an underpriced asset or a hidden risk that comps aren't pricing in. Stress-test before assuming the spread holds.
Location & tenants
- Location reads 70/100 on livability (#55 in TN) — a middle-class / working-renter tenant base. Strengths: cost of living A+, health & safety A+, housing A; Watch: employment D, crime F, amenities F.
- Cleveland (urban): math 23% / reading 28% proficiency, ranked #85 of 139 in TN (top 61%) — low school quality limits family demand, transient renter base, plan for 1-2y turnover.
- Zoned schools: Blythe-Bower Elementary (math 16% / reading 20%, grade F, #697 of 952 statewide, top 74%, 636 students, 0% FRL); Cleveland Middle (math 25% / reading 26%, grade F, #147 of 333 statewide, top 45%, 1,271 students, 0% FRL); Cleveland High (math 8% / reading 29%, grade F, #208 of 332 statewide, top 63%, 1,842 students, 0% FRL) — zoned schools average 0% FRL vs 53% district-wide (53 pts lower); this property's tenant base skews higher-income than the district average.
- Market conditions: Rents rising (+3.0%/yr); 200 active listings in the ZIP; 768 units permitted in Bradley County in 2024 (0 in 5+ unit buildings).
- This rent runs 37% of the median local income ($47k/yr) — at the standard rent-burdened threshold; future hikes will face affordability resistance.
Forward outlook
- Local home prices are declining (-3.0%/yr); year-one equity from $1k of loan paydown is wiped out by about $5k of value loss. Plan a longer hold.
- Bradley County population projected at +21% by 2050 — long-run rental-demand tailwind backs the buy-and-hold thesis.
Negotiation context
- It's been on market 95 days — a 9% lower offer ($164k) is reasonable based on typical stale-listing flexibility.
- 3 sale attempts with the ask held roughly flat each time — persistent listings suggest the price (not the market) is what's stuck; bring a comps-based counter.
- Current owner paid $45k; list at $180k implies a 300% gain — meaningful room to come down on a strong offer.
Risks & watch-outs
- Watch-outs: built in 1920 — expect roof / HVAC / electrical / plumbing capex.
- Climate carrying-cost: extreme-heat days projected 7→19/yr by 2055 (HVAC capex compounding) — expect insurance premiums to compound above CPI over the hold.
Questions for the listing agent
- It's been on market 95 days. Have you received any prior offers? Is the seller open to a 18% concession, seller financing, or rate buy-down credit?
- Built in 1920 — when were the roof, HVAC, electrical panel, plumbing, and water heater last replaced?
- Why hasn't it sold? Are there any deal-killer items the seller is aware of (foundation, flood, title, zoning, code violations)?
- Is there a deadline driving the sale (1031 exchange, divorce, estate, relocation)? That informs how much negotiation room exists.
- Schools are D-rated, which usually means shorter tenancies and higher turnover. Who's the typical renter profile here, and what's been the actual vacancy rate?
- Crime grade is F in this area — have there been break-ins, vandalism, or insurance claims at this property in the last 3 years? What carrier currently insures it and at what premium?
- The area grade is low — what's the realistic commute time and amenity access for the typical tenant pool here? Any planned neighborhood developments (good or bad) we should know about?
- What's the average days-on-market for RENTAL listings here right now (not sales)? A rising rental-DOM trend means longer vacancies and softer asking-rent achievability than the comps imply.
- What's the recent tenant-quality profile in this submarket — average credit score on applications, eviction rate, late-payment / NSF rate, and stable-employment percentage? A property-management company in the area should have these aggregated.
- How much new for-sale + rental construction is in the pipeline within 1–3 miles? Heavy new supply typically softens prices + rents 12–24 months out; constrained supply supports both.
Investment metrics
- 1% rule
- 0.82% ✗
- Cap rate
- 6.92%
- Cash-on-cash
- 2.25%
- DSCR
- 1.10
- GRM
- 10.2
CMA / ARV
- ARV (on-the-fly)
- $167,692
- Comps found
- 12
Show comp detail 12 sales within ~0.75 mi
| Address | Dist | Beds/Ba | Sqft | Sold | Price | $/sf | Match |
|---|---|---|---|---|---|---|---|
| 970 King Edward Ave SE | 0.34mi | 2/1.0 (-1) | 784 (+6%) | 4mo | $185,000 | $236 | 67 |
| 775 12th St SE | 0.20mi | 2/1.5 (-1) | 793 (+7%) | 10mo | $165,825 | $209 | 64 |
| 752 10th St SE | 0.29mi | 3/1.0 | 830 (+12%) | 12mo | $130,000 | $157 | 57 |
| 730 10th St SE | 0.27mi | 2/1.0 (-1) | 648 (-13%) | 11mo | $124,900 | $193 | 52 |
| 730 10th St SE | 0.27mi | 2/1.0 (-1) | 648 (-13%) | 11mo | $124,900 | $193 | 52 |
| 1219 Crest Dr | 0.69mi | 2/1.0 (-1) | 725 (-2%) | 10mo | $166,000 | $229 | 50 |
| 1509 Wildwood Lake Rd SE | 0.65mi | 3/1.0 | 720 (-3%) | 17mo | $100,000 | $139 | 50 |
| 917 Lang Street St SE | 0.40mi | 3/1.0 | 840 (+13%) | 16mo | $170,000 | $202 | 46 |
| 425 4th St SE | 0.63mi | 2/1.0 (-1) | 800 (+8%) | 8mo | $188,000 | $235 | 46 |
| 320 East St | 0.58mi | 2/1.0 (-1) | 833 (+12%) | 3mo | $188,000 | $226 | 46 |
| 1205 14th St SE | 0.31mi | 2/2.0 (-1) | 816 (+10%) | 18mo | $200,000 | $245 | 45 |
| 1650 Blythe Avenue Ave SE | 0.24mi | 2/1.0 (-1) | 846 (+14%) | 21mo | $199,500 | $236 | 43 |
Match score weights: distance 35% · size 25% · config 20% · recency 20%. Top-matched comps best support the ARV.
Projected returns pro-forma
-3.0% appreciation · 2.95% rent growth · sell at horizon
- IRR
- -12.8%
- Equity multiple
- 0.54×
- Total profit
- $-23,320
- Equity at exit
- $26,839
- IRR
- -4.0%
- Equity multiple
- 0.74×
- Total profit
- $-13,228
- Equity at exit
- $15,563
Cash invested: $50,400 (down + closing). Projections, not guarantees.
Landlord ↔ Tenant lean methodology
- Overall (STATE)
- 87 Strongly Landlord-Friendly
- State Tennessee
- 87 Strongly Landlord-Friendly · R+13
- County
- — inherits STATE
- City
- — inherits STATE
ZIP-level market 37311
- Home prices YoY
- -25.4%
- Rents YoY
- 3.0%
- Active inventory
- 200
- Price-to-rent
- 10.2×
Monthly cashflow live
- Estimated rent
- $1,467 medium interval (Pro) →
- Mortgage (P&I)
- −$944
- Tax from tax record
- −$46 /mo · $552/yr
- Insurance
- −$75
- HOA
- −$0
- Vacancy / Maint / Mgmt
- −$308
- Net cashflow
- $94
Break-even live
Sensitivity live
| Price | -10% $196 | -5% $145 | +0% $94 | +5% $43 | +10% $-8 |
|---|---|---|---|---|---|
| Rent | -10% $-22 | -5% $36 | +0% $94 | +5% $152 | +10% $210 |
| Rate | -1.0pp $185 | -0.5pp $140 | base $94 | +0.5pp $48 | +1.0pp $0 |
UW: 25.0% down · 7.5% · 30yr · 1.5% tax · 5.0% vac · 8.0% maint · 8.0% mgmt
Financing live
Cash to close
- Down payment
- $45,000
- Closing costs
- $5,400
- Reserves months
- —
- Total cash needed
- —
Loan-product check · same deal, 3 products live
Conventional
25% down · 7.5% · 30yr
- Down + closing
- —
- Monthly P&I
- —
- Monthly cashflow
- —
- DSCR
- —
- Eligible?
- —
Personal DTI + credit; lowest rate.
DSCR
20% down · 8.5% · 30yr
- Down + closing
- —
- Monthly P&I
- —
- Monthly cashflow
- —
- DSCR
- —
- Eligible?
- —
No personal income docs; deal must DSCR.
Hard money
10% down · 12.0% · 12mo
- Down + closing
- —
- Monthly P&I
- —
- Monthly cashflow
- —
- DSCR
- —
- Eligible?
- —
Short-term bridge; refi at stabilization.
Listing history 22 events
-
2026-06-22days on market $180,000 Active 95 DOM
-
2026-06-19days on market $180,000 Active 93 DOM
-
2026-06-18days on market $180,000 Active 92 DOM
-
2026-06-17days on market $180,000 Active 91 DOM
-
2026-06-16days on market $180,000 Active 90 DOM
-
2026-06-15days on market $180,000 Active 89 DOM
-
2026-06-14days on market $180,000 Active 87 DOM
-
2026-06-13days on market $180,000 Active 86 DOM
-
2026-06-10days on market $180,000 Active 84 DOM
-
2026-06-09days on market $180,000 Active 83 DOM
-
2026-06-08days on market $180,000 Active 82 DOM
-
2026-06-07days on market $180,000 Active 81 DOM
-
2026-06-05days on market $180,000 Active 78 DOM
-
2026-06-03days on market $180,000 Active 77 DOM
-
2026-06-02days on market $180,000 Active 76 DOM
-
2026-06-01days on market $180,000 Active 75 DOM
-
2026-05-31days on market $180,000 Active 74 DOM
-
2026-05-30days on market $180,000 Active 73 DOM
-
2026-03-14$180,000 Active
-
2026-03-13$180,000 Active 755-char remark
Show marketing remark (755 chars)
Welcome to this fully renovated 3-bedroom, 1.5-bath home where every detail has been carefully updated for modern living. The home features brand new plumbing, electrical, roof, and HVAC, providing peace of mind for years to come. Inside, you'll find a bright and open floor plan with spacious living areas that flow into a beautifully updated kitchen with new cabinetry, new countertops, and stainless-steel appliances. The bedrooms are filled with natural light, while the bathrooms have been refreshed with stylish finishes. Outside, the private backyard offers the perfect space for entertaining, gardening, or simply relaxing. This home has a paying tenant already in place, making it an excellent opportunity for both homeowners and investors alike.
-
2025-08-31$180,000 Active
-
2023-02-27soldstatus $45,000
ⓘ Source: listings_history table (triggers on properties + properties_extension) + one-shot
backfill from property_details.listing_events for pre-trigger history.
Tax reassessment forecast TN · Resets to sale price
- Current annual tax
- $552 · $46/mo
- Projected year-2 tax
- $1,278 · $106/mo
- Expected delta
- +$726/yr (+$60/mo · 131.5%)
ⓘ Screening estimate from a state-policy table — verify with the county assessor before closing.
Climate risk First Street
- Flood 1/10 Low FEMA zone X (unshaded) · 0% chance over 30 yrs
- Wildfire 2/10 Low
- Heat 6/10 Major 7 d/yr ≥104°F today · 19 d/yr by 30 yrs out
- Wind 3/10 Moderate 5% chance of damaging wind over 30 yrs
- Air quality 3/10 Moderate 2 unhealthy d/yr today · 2 by 30 yrs out
Nearby sold comps map
Loading sold comps map…
Walkable amenities ~0.75 mi
Loading nearby amenities…
Taxation est. · year 1
- Rental income
- $17,610
- − Mortgage interest
- −$10,083
- − Property taxes
- −$552
- − Insurance
- −$900
- − Repairs & maintenance
- −$1,409
- − Management
- −$1,409
- − Depreciation
- −$5,236
- Taxable loss
- −$1,979
- Est. tax savings @ 24.0%
- +$475
- After-tax cash flow
- $1,607/yr
For passive investors: Depreciation is non-cash, so a rental often shows a tax loss while cash-flowing — sheltering income. Rental losses are passive: they offset passive income freely, and up to $25,000/yr can offset ordinary (W-2) income if you actively participate and your MAGI is under $100k (phasing out to $0 by $150k); unused losses carry forward. On sale, claimed depreciation is recaptured at up to 25%, and gains may owe capital-gains tax (a 1031 exchange can defer both). Figures are a year-1 estimate at your 24.0% rate — not tax advice; consult a CPA.
Schools (NCES district)
- District
- Cleveland
- NCES district ID
- 4700690
- Math proficiency
- 23% ▼ -9.00%
- Reading proficiency
- 28% ▼ -6.00%
- Median HH income
- $37,612
- Composite
- 21.28/100
- National rank
- #8394
- State rank
- #85 of 139 in TN
Livability — Cleveland
- Score
- 70/100
- State rank
- #55
- US rank
- #7689
Category grades
Schools grade is shown separately in the Schools card above.
Census & demographics
- Census place
- Cleveland, TN
- County
- Bradley County · 99,337 people
- City population
- 99,337
- Metro
- Cleveland, TN
- Population (ZIP)
- 30,720
- Household income
- $47,153
- Rent vs Own
- Severe rent burden
- 1184.0
Population outlook (Bradley County) Hauer SSP2
- Today (2025)
- 114,901 people
- By 2030
- 120,137 · +4.6%
- By 2040
- 130,125 · +13.2%
- By 2050
- 139,257 · +21.2%
- By 2075
- 161,664 · +40.7%
- By 2100
- 179,767 · +56.5%
Race, ethnicity, and origin ACS 2023
- Neighborhood character
- Predominantly White (74%)
- Race & ethnicity
- White 74% Hispanic / Latino 12% Black 9% Two or more races 6%
- Hispanic origin (detail)
- Mexican 7% Puerto Rican 2%
- Common ancestry
- Slovak 3% Serbian 2% Italian 1%
- Foreign-born
- 6% · Canada
- Languages at home
- 88% English-only · Spanish 9% Russian/Polish/Slavic 1%
Political lean MEDSL · Bradley
- 2024 margin
- Solid R (+58.9) · D 20.0% · R 78.9% · Other 1.1%
- 2008→2024 swing
- -9.2pp toward R · 2008: -49.7pp · 2024: -58.9pp
- All cycles
- 2024: R+58.9 2020: R+55.3 2016: R+59.1 2012: R+53.9 2008: R+49.7
Not yet ingested
- Civics
- —
Market trends
- HPI YoY
- ▼ -97.10%
- Current HPI
- 285.0723
- Rent YoY
- ▲ 2.95%
- Metro
- Cleveland, TN
- State GDP YoY
- ▲ 2.78%
- F500 in state
- 22
Industry mix (Fortune 500 HQ in TN)
| Industry | F500 HQs | Revenue |
|---|---|---|
| Healthcare | 3 | $91B |
|
||
| Retail | 3 | $72B |
|
||
| Transportation / Logistics | 1 | $88B |
|
||
| Paper / Packaging | 1 | $19B |
|
||
| Insurance | 1 | $13B |
|
||
| Energy | 1 | $12B |
|
||
Price history
+300.0% since first listed4 events — show timeline
- 2026-03-14 Listed $180,000 GCAR
- 2026-03-13 Listed $180,000 RCAOR
- 2025-08-31 Listed $180,000 RCAOR
- 2023-02-27 Sold (Public Records) $45,000 Public Records
Property tax history
+5.1%/yrLatest (2025): $552 · +22.7% YoY. Source: county tax records.
Cash-flow waterfall
monthlySold comps — $/sqft
last 12 mo · ≤1 miLoading sold comps…