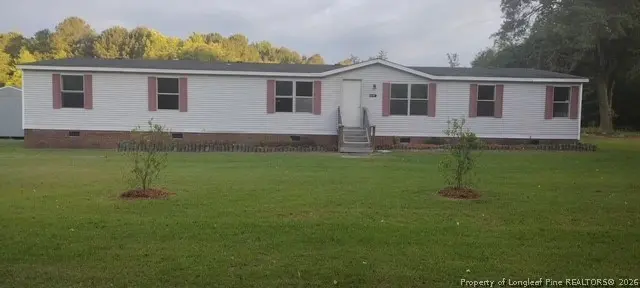
1278 Minter School Rd · Sanford, NC
Flood risk 1/10 · Minimal
- FEMA flood zone
- X (unshaded)
- Chance of flooding over 30 yrs
- 0.0%
- Est. flood insurance / yr
- $507 – $1,088
Fire risk 3/10 · Minor
- Est. fire insurance / yr
- $906 – $1,684
Heat risk 6/10 · Moderate
- Hot days now (above 105°F)
- 7 days/yr
- Hot days in 30 yrs
- 17 days/yr
Wind risk 6/10 · Moderate
- Chance of severe wind over 30 yrs
- 54.0%
Air-quality risk 2/10 · Minimal
- Unhealthy air days now
- 1 days/yr
- Unhealthy air days in 30 yrs
- 1 days/yr
Risk factors via First Street. Map © Google.
Why this score? — see what drove the D grade
The composite is a weighted blend of 9 inputs, each scored 0–100. Each bar is that input's sub-score; the figure is the points it added to the 100-point composite (weight × sub-score).
- Cash flow +14.2/30.0
- ARV discount +7.5/15.0
- DSCR +4.3/10.0
- Rent growth +3.7/5.0
- Livability +3.6/5.0
- 1% rule +3.0/10.0
- Schools +3.0/10.0
- Condition / age +2.5/5.0
- Appreciation +0.0/10.0
$250,000
🖨 Deal sheet (PDF) 📄 Offer letter ✓ Due diligence
Listing remarks MLS
Huge manufactured home! Move in condition! Freshly painted throughout. New hvac, carpet, lighting, stainless appliances, etc. Home features granite counters in kitchen, an open floor plan, large living room, dining room combo, family room with fireplace, master with huge bathroom with double vanity, garden tub, separate shower and a huge walk in closet. Over 2200 square feet. Almost an acre of land (.90) AND a 2 story storage building out back. This is a must see!
Key facts
- Move in ready
- Fresh interior paint
- 0.9 acre lot
Tags
Property features AI
Exterior
- Utilities: Public sewer
- Home design: Manufactured home; Residential property
- Construction: Aluminum siding; Home warranty included
- Exterior features: Cleared lot
Interior
- Kitchen: Dishwasher; Oven; Refrigerator; Exhaust fan
- Flooring: Carpet; Vinyl
- Bathrooms: 2 full bathrooms
- Heating & cooling: Electric heating; Ceiling fan cooling
- Interior features: Ceiling fans; Granite counters; Storage; Has fireplace (Family Room)
- Laundry & utility: Laundry on main level
Neighborhood map
What this means for you Summary
Snapshot
- This is a 4-bed/2.0-bath manufactured listed at $250k.
Deal economics
- At list price, monthly cash flow is $43 ($516/yr) — positive.
- The deal already cash-flows at list — no discount required.
- To meet the 1% rule (rent ≥ 1% of price), the offer needs to be $199k (20.4% below list).
- Recommended offer: $199k (20.4% below list) — sets the bar for 1% rule.
- Cap rate 6.5% vs local median 3.6% in Sanford — top-decile yield for the area; either an underpriced asset or a hidden risk that comps aren't pricing in. Stress-test before assuming the spread holds.
Location & tenants
- Location reads 72/100 on livability (#92 in NC) — a middle-class / working-renter tenant base. Strengths: cost of living A+, housing A+, health & safety A+; Watch: employment D, crime D-, commute F.
- Lee County Schools (rural): math 31% / reading 39% proficiency, ranked #131 of 178 in NC (top 74%) — families likely to look elsewhere, expect single-tenant / working-renter base with shorter leases.
- Zoned schools: Tramway Elementary (math 45% / reading 47%, grade D-, #551 of 1,410 statewide, top 40%, 545 students, 47% FRL); Sanlee Middle School (math 32% / reading 43%, grade F, #256 of 475 statewide, top 55%, 809 students, 70% FRL); Southern Lee High School (math 43% / reading 46%, grade F, #352 of 535 statewide, top 68%, 1,234 students, 61% FRL) — zoned schools at 59% FRL track the district average.
- Market conditions: Rents rising fast (+4.9%/yr); 462 active listings in the ZIP; solid renter incomes; 602 units permitted in Lee County in 2024 (0 in 5+ unit buildings).
- This rent runs 30% of the median local income ($78k/yr) — at the standard rent-burdened threshold; future hikes will face affordability resistance.
Forward outlook
- Local home prices are declining (-3.0%/yr); year-one equity from $2k of loan paydown is wiped out by about $8k of value loss. Plan a longer hold.
- Lee County population projected at +8% by 2050 — modest demand growth; plan on rents tracking national, not racing it.
Negotiation context
- It's been on market 16 days — a 2% lower offer ($246k) is reasonable based on typical stale-listing flexibility.
- 3 sale attempts since 6y ago with the ask held roughly flat each time — persistent listings suggest the price (not the market) is what's stuck; bring a comps-based counter.
- Current owner paid $140k; list at $250k implies a 79% gain — meaningful room to come down on a strong offer.
Risks & watch-outs
- Climate carrying-cost: major wind risk, 54% chance of damaging wind over 30y; extreme-heat days projected 7→17/yr by 2055 (HVAC capex compounding) — expect insurance premiums to compound above CPI over the hold.
Questions for the listing agent
- Is there a deadline driving the sale (1031 exchange, divorce, estate, relocation)? That informs how much negotiation room exists.
- Schools are F-rated, which usually means shorter tenancies and higher turnover. Who's the typical renter profile here, and what's been the actual vacancy rate?
- Crime grade is D in this area — have there been break-ins, vandalism, or insurance claims at this property in the last 3 years? What carrier currently insures it and at what premium?
- The area grade is low — what's the realistic commute time and amenity access for the typical tenant pool here? Any planned neighborhood developments (good or bad) we should know about?
- What's the average days-on-market for RENTAL listings here right now (not sales)? A rising rental-DOM trend means longer vacancies and softer asking-rent achievability than the comps imply.
- What's the recent tenant-quality profile in this submarket — average credit score on applications, eviction rate, late-payment / NSF rate, and stable-employment percentage? A property-management company in the area should have these aggregated.
- How much new for-sale + rental construction is in the pipeline within 1–3 miles? Heavy new supply typically softens prices + rents 12–24 months out; constrained supply supports both.
Investment metrics
- 1% rule
- 0.80% ✗
- Cap rate
- 6.50%
- Cash-on-cash
- 0.74%
- DSCR
- 1.03
- GRM
- 10.5
CMA / ARV
No comps found within radius.
Projected returns pro-forma
-3.0% appreciation · 4.87% rent growth · sell at horizon
- IRR
- -13.3%
- Equity multiple
- 0.51×
- Total profit
- $-34,049
- Equity at exit
- $37,276
- IRR
- -2.0%
- Equity multiple
- 0.85×
- Total profit
- $-10,231
- Equity at exit
- $21,615
Cash invested: $70,000 (down + closing). Projections, not guarantees.
Landlord ↔ Tenant lean methodology
- Overall (STATE)
- 85 Strongly Landlord-Friendly
- State North Carolina
- 85 Strongly Landlord-Friendly · R+3
- County
- — inherits STATE
- City
- — inherits STATE
ZIP-level market 27332
- Home prices YoY
- -17.8%
- Rents YoY
- 4.9%
- Active inventory
- 462
- Price-to-rent
- 10.5×
Monthly cashflow live
- Estimated rent
- $1,991 medium interval (Pro) →
- Mortgage (P&I)
- −$1,311
- Tax from tax record
- −$114 /mo · $1,372/yr
- Insurance
- −$104
- HOA
- −$0
- Vacancy / Maint / Mgmt
- −$418
- Net cashflow
- $43
Break-even live
Sensitivity live
| Price | -10% $185 | -5% $114 | +0% $43 | +5% $-28 | +10% $-99 |
|---|---|---|---|---|---|
| Rent | -10% $-114 | -5% $-36 | +0% $43 | +5% $122 | +10% $200 |
| Rate | -1.0pp $169 | -0.5pp $107 | base $43 | +0.5pp $-22 | +1.0pp $-88 |
UW: 25.0% down · 7.5% · 30yr · 1.5% tax · 5.0% vac · 8.0% maint · 8.0% mgmt
Financing live
Cash to close
- Down payment
- $62,500
- Closing costs
- $7,500
- Reserves months
- —
- Total cash needed
- —
Loan-product check · same deal, 3 products live
Conventional
25% down · 7.5% · 30yr
- Down + closing
- —
- Monthly P&I
- —
- Monthly cashflow
- —
- DSCR
- —
- Eligible?
- —
Personal DTI + credit; lowest rate.
DSCR
20% down · 8.5% · 30yr
- Down + closing
- —
- Monthly P&I
- —
- Monthly cashflow
- —
- DSCR
- —
- Eligible?
- —
No personal income docs; deal must DSCR.
Hard money
10% down · 12.0% · 12mo
- Down + closing
- —
- Monthly P&I
- —
- Monthly cashflow
- —
- DSCR
- —
- Eligible?
- —
Short-term bridge; refi at stabilization.
Listing history 13 events
-
2026-06-21days on market $250,000 Active 16 DOM
-
2026-06-19days on market $250,000 Active 14 DOM
-
2026-06-18days on market $250,000 Active 13 DOM
-
2026-06-17days on market $250,000 Active 12 DOM
-
2026-06-16days on market $250,000 Active 11 DOM
-
2026-06-15days on market $250,000 Active 10 DOM
-
2026-06-14days on market $250,000 Active 8 DOM
-
2026-06-13days on market $250,000 Active 7 DOM
-
2026-06-10days on market $250,000 Active 5 DOM
-
2026-06-09days on market $250,000 Active 4 DOM
-
2026-06-08days on market $250,000 Active 3 DOM
-
2026-06-07remarks 693-char remark
-
2026-06-07$250,000 Active 2 DOM
ⓘ Source: listings_history table (triggers on properties + properties_extension) + one-shot
backfill from property_details.listing_events for pre-trigger history.
Tax reassessment forecast NC · Resets to sale price
- Current annual tax
- $1,372 · $114/mo
- Projected year-2 tax
- $2,050 · $171/mo
- Expected delta
- +$678/yr (+$56/mo · 49.4%)
ⓘ Screening estimate from a state-policy table — verify with the county assessor before closing.
Climate risk First Street
- Flood 1/10 Low FEMA zone X (unshaded) · 0% chance over 30 yrs
- Wildfire 3/10 Moderate
- Heat 6/10 Major 7 d/yr ≥105°F today · 17 d/yr by 30 yrs out
- Wind 6/10 Major 54% chance of damaging wind over 30 yrs
- Air quality 2/10 Low 1 unhealthy d/yr today · 1 by 30 yrs out
Nearby sold comps map
Loading sold comps map…
Walkable amenities ~0.75 mi
Loading nearby amenities…
Taxation est. · year 1
- Rental income
- $23,887
- − Mortgage interest
- −$14,004
- − Property taxes
- −$1,372
- − Insurance
- −$1,250
- − Repairs & maintenance
- −$1,911
- − Management
- −$1,911
- − Depreciation
- −$7,273
- Taxable loss
- −$3,834
- Est. tax savings @ 24.0%
- +$920
- After-tax cash flow
- $1,436/yr
For passive investors: Depreciation is non-cash, so a rental often shows a tax loss while cash-flowing — sheltering income. Rental losses are passive: they offset passive income freely, and up to $25,000/yr can offset ordinary (W-2) income if you actively participate and your MAGI is under $100k (phasing out to $0 by $150k); unused losses carry forward. On sale, claimed depreciation is recaptured at up to 25%, and gains may owe capital-gains tax (a 1031 exchange can defer both). Figures are a year-1 estimate at your 24.0% rate — not tax advice; consult a CPA.
Schools (NCES district)
- District
- Lee County Schools
- NCES district ID
- 3702560
- Math proficiency
- 31% ▼ -6.00%
- Reading proficiency
- 39% ▬ 0.00%
- Median HH income
- $45,300
- Composite
- 29.87/100
- National rank
- #6403
- State rank
- #131 of 178 in NC
Livability — Sanford
- Score
- 72/100
- State rank
- #92
- US rank
- #6134
Category grades
Schools grade is shown separately in the Schools card above.
Census & demographics
- County
- Lee County · 76,725 people
- City population
- 76,725
- Metro
- Sanford, NC
- Population (ZIP)
- 36,947
- Household income
- $78,447
- Rent vs Own
- Severe rent burden
- 632.0
Population outlook (Lee County) Hauer SSP2
- Today (2025)
- 63,008 people
- By 2030
- 64,443 · +2.3%
- By 2040
- 66,898 · +6.2%
- By 2050
- 68,310 · +8.4%
- By 2075
- 70,920 · +12.6%
- By 2100
- 70,402 · +11.7%
Race, ethnicity, and origin ACS 2023
- Neighborhood character
- Diverse neighborhood (Simpson 0.59)
- Race & ethnicity
- White 59% Hispanic / Latino 19% Black 16% Two or more races 11% Asian 1%
- Hispanic origin (detail)
- Mexican 9% Puerto Rican 4% Cuban 2%
- Common ancestry
- Serbian 2% Italian 2% Slovak 2%
- Foreign-born
- 8% · Canada, South Korea
- Languages at home
- 82% English-only · Spanish 15%
Political lean MEDSL · Lee
- 2024 margin
- R (+17.5) · D 40.8% · R 58.3%
- 2008→2024 swing
- -9.1pp toward R · 2008: -8.4pp · 2024: -17.5pp
- All cycles
- 2024: R+17.5 2020: R+14.9 2016: R+13.2 2012: R+10.2 2008: R+8.4
Not yet ingested
- Civics
- —
Market trends
- HPI YoY
- ▼ -54.61%
- Current HPI
- 252.2719
- Rent YoY
- ▲ 4.87%
- Metro
- Sanford, NC
- State GDP YoY
- ▲ 3.28%
- F500 in state
- 26
Industry mix (Fortune 500 HQ in NC)
| Industry | F500 HQs | Revenue |
|---|---|---|
| Financial Services | 2 | $213B |
|
||
| Retail | 2 | $95B |
|
||
| Industrial Conglomerate | 1 | $38B |
|
||
| Metals / Steel | 1 | $35B |
|
||
| Utilities | 1 | $30B |
|
||
| Industrial Machinery | 1 | $19B |
|
||
Price history
+48.8% since first listed10 events — show timeline
- 2026-06-04 Listed $250,000 LPRMLS
- 2020-06-17 Sold (Public Records) $140,000 Public Records
- 2020-06-17 Sold (MLS) $139,900 LPRMLS
- 2020-06-17 Sold (MLS) $139,900 TMLS
- 2020-04-22 Listed $139,900 LPRMLS
- 2020-04-22 Listed $139,900 TMLS
- 2007-02-14 Sold (Public Records) $93,000 Public Records
- 2006-10-31 Sold (Public Records) $55,000 Public Records
- 2001-08-17 Sold (Public Records) $20,000 Public Records
- 1998-05-20 Sold (Public Records) $168,000 Public Records
Property tax history
+4.6%/yrLatest (2025): $1,372 · +0.9% YoY. Source: county tax records.
Cash-flow waterfall
monthlySold comps — $/sqft
last 12 mo · ≤1 miLoading sold comps…