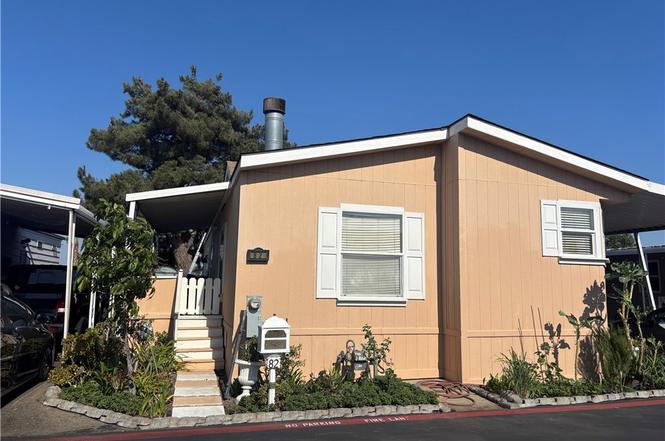
8389 Baker Ave #82 · Rancho Cucamonga, CA
Flood risk 4/10 · Minor
- FEMA flood zone
- X (unshaded)
- Chance of flooding over 30 yrs
- 0.22%
- Est. flood insurance / yr
- $507 – $1,088
Fire risk 2/10 · Minimal
- Est. fire insurance / yr
- $659 – $1,223
Heat risk 7/10 · Major
- Hot days now (above 100°F)
- 5 days/yr
- Hot days in 30 yrs
- 15 days/yr
Wind risk 1/10 · Minimal
- Chance of severe wind over 30 yrs
- —
Air-quality risk 9/10 · Severe
- Unhealthy air days now
- 23 days/yr
- Unhealthy air days in 30 yrs
- 28 days/yr
Risk factors via First Street. Map © Google.
Why this score? — see what drove the B- grade
The composite is a weighted blend of 9 inputs, each scored 0–100. Each bar is that input's sub-score; the figure is the points it added to the 100-point composite (weight × sub-score).
- Cash flow +30.0/30.0
- DSCR +10.0/10.0
- 1% rule +8.8/10.0
- ARV discount +7.5/15.0
- Livability +3.5/5.0
- Rent growth +2.7/5.0
- Condition / age +2.5/5.0
- Schools +2.3/10.0
- Appreciation +0.0/10.0
$235,000
🖨 Deal sheet 📄 Offer letter ✓ Due diligence
Listing remarks
Beautifully Maintained Home – Only Two Owners! Step into this charming, well-cared-for home that offers a welcoming atmosphere. The open floor plan features a spacious living room with a cozy fireplace, abundant natural light from large windows, and a stylish raised coffered ceiling that adds style. The expansive kitchen is perfect for both everyday living and entertaining, offering a generous island, built-in corner hutch, walk-in pantry, and a sunny bay window. Ample cabinetry ensures plenty of storage for all your culinary essentials, making it the ideal space to create memorable meals with family and friends. A convenient laundry room with additional closet space adds to the home&
Key facts
- Open floor plan
- Generous island
- Cozy fireplace
Tags
Property features AI
Finance
- Other: Pets allowed — contact for details; Builder: Champion Home Builders; Double body type; Directions: South of Foothill Blvd., east of Baker Avenue
- HOA & community: Part of an association; Land lease of $1,300 monthly; Located in Sycamore Park
Exterior
- Parking: Covered carport with 3 spaces; Attached carport
- Utilities: Public sewer; District/public water
- Home design: Single-story mobile home (Model CR270); Entry at front door; Mobile home remains on site; Facing direction not specified
- Construction: Built year reported by seller; Mobile construction (12 ft x 52 ft)
- Exterior features: Community in-ground association pool; Patio home; One shed on property; Located in a suburban community
Interior
- Kitchen: Kitchen island; Kitchen open to family room; Walk-in pantry; Gas oven
- Bedrooms: All bedrooms on main level
- Bathrooms: Two full bathrooms; Master bath with double sinks; Separate tub and shower; Soaking tub; Shower in tub
- Heating & cooling: Central heating (furnace); Fireplace; Central air conditioning
- Interior features: Coffered ceilings; High ceilings (9 feet+); Open floor plan; Pantry; Storage space; Front door entry; Single-level home
- Laundry & utility: Inside laundry in a dedicated room
Neighborhood map
What this means for you Summary
Snapshot
- This is a 3-bed/2.0-bath manufactured listed at $235k.
Deal economics
- At list price, monthly cash flow is $1k ($14k/yr) — positive.
- The deal already cash-flows at list — no discount required.
- Meets the 1% rule at list price ($3k rent vs $235k).
- Recommended offer: $207k (12.0% below list) — sets the bar for market timing.
- Cap rate 12.3% vs local median 2.7% in Rancho Cucamonga — top-decile yield for the area; either an underpriced asset or a hidden risk that comps aren't pricing in. Stress-test before assuming the spread holds.
Location & tenants
- Location reads 70/100 on livability (#237 in CA) — a middle-class / working-renter tenant base. Strengths: employment A+, commute A, housing A-; Watch: amenities D+, health & safety D, cost of living F.
- Central Elementary (suburban): math 25% / reading 25% proficiency, ranked #379 of 517 in CA (top 73%) — low school quality limits family demand, transient renter base, plan for 1-2y turnover.
- Market conditions: Rents flat; 146 active listings in the ZIP; 29 comparable units currently listed for rent nearby; rentals leasing fast (median 2d on market — plan ~1-2 weeks tenant-placement turnaround); solid renter incomes; 5,458 units permitted in San Bernardino County in 2024 (1,500 in 5+ unit buildings).
- This rent runs 42% of the median local income ($92k/yr) — at the standard rent-burdened threshold; future hikes will face affordability resistance.
Forward outlook
- Local home prices are declining (-3.0%/yr); year-one equity from $2k of loan paydown is wiped out by about $7k of value loss. Plan a longer hold.
- San Bernardino County population projected at +15% by 2050 — modest demand growth; plan on rents tracking national, not racing it.
- At projected returns (-3.0% appreciation + 0.8% rent growth), your $66k cash investment doubles in ~7 years — after that, you're playing with house money.
Negotiation context
- It's been on market 310 days — a 12% lower offer ($207k) is reasonable based on typical stale-listing flexibility.
- 5 sale attempts since 17y ago; this cycle's ask has dropped $17k (7%) from the opening price — seller is motivated, your offer sets the floor, not the list.
Risks & watch-outs
- Climate carrying-cost: extreme-heat days projected 5→15/yr by 2055 (HVAC capex compounding) — expect insurance premiums to compound above CPI over the hold.
Questions for the listing agent
- It's been on market 310 days. Have you received any prior offers? Is the seller open to a 12% concession, seller financing, or rate buy-down credit?
- Why hasn't it sold? Are there any deal-killer items the seller is aware of (foundation, flood, title, zoning, code violations)?
- Is there a deadline driving the sale (1031 exchange, divorce, estate, relocation)? That informs how much negotiation room exists.
- Schools are B-rated — typically a magnet for longer-tenancy family renters. What's the average tenant stay here, and is there a school-zone premium baked into asking?
- What's the average days-on-market for RENTAL listings here right now (not sales)? A rising rental-DOM trend means longer vacancies and softer asking-rent achievability than the comps imply.
- What's the recent tenant-quality profile in this submarket — average credit score on applications, eviction rate, late-payment / NSF rate, and stable-employment percentage? A property-management company in the area should have these aggregated.
- How much new for-sale + rental construction is in the pipeline within 1–3 miles? Heavy new supply typically softens prices + rents 12–24 months out; constrained supply supports both.
Investment metrics
- 1% rule
- 1.38% ✓
- Cap rate
- 12.34%
- Cash-on-cash
- 21.59%
- DSCR
- 1.96
- GRM
- 6.0
CMA / ARV
- ARV (on-the-fly)
- $131,016
- Comps found
- 12
Show comp detail 12 sales within ~0.75 mi
| Address | Dist | Beds/Ba | Sqft | Sold | Price | $/sf | Match |
|---|---|---|---|---|---|---|---|
| 8389 Baker Ave #61 | 0.00mi | 3/2.0 | 1,425 (+12%) | 9mo | $175,000 | $123 | 73 |
| 8651 Foothill Blvd #92 | 0.17mi | 2/2.0 (-1) | 1,440 (+13%) | 0mo | $156,000 | $108 | 65 |
| 8651 Foothill Blvd #99 | 0.17mi | 2/2.0 (-1) | 1,440 (+13%) | 2mo | $140,000 | $97 | 64 |
| 8651 Foothill Blvd #157 | 0.17mi | 2/2.0 (-1) | 1,440 (+13%) | 3mo | $142,000 | $99 | 63 |
| 1350 San Bernardino Rd #132 | 0.69mi | 3/2.0 | 1,224 (-4%) | 3mo | $120,000 | $98 | 59 |
| 1350 San Bernardino Rd #187 | 0.69mi | 3/2.0 | 1,344 (+6%) | 1mo | $135,000 | $100 | 58 |
| 1320 San Bernardino #28 | 0.70mi | 2/2.0 (-1) | 1,296 (+2%) | 2mo | $212,000 | $164 | 58 |
| 1350 San Bernardino Rd #157 | 0.69mi | 3/2.0 | 1,344 (+6%) | 11mo | $199,000 | $148 | 50 |
| 1350 San Bernardino #86 | 0.69mi | 3/2.0 | 1,440 (+13%) | 7mo | $140,000 | $97 | 40 |
| 1320 San Bernardino #47 | 0.70mi | 2/2.0 (-1) | 1,440 (+13%) | 1mo | $225,000 | $156 | 40 |
| 1350 San Bernardino Rd #84 | 0.69mi | 4/2.0 (+1) | 1,440 (+13%) | 4mo | $117,000 | $81 | 38 |
| 1350 San Bernardino Rd #21 | 0.69mi | 4/2.0 (+1) | 1,440 (+13%) | 10mo | $149,000 | $103 | 33 |
Match score weights: distance 35% · size 25% · config 20% · recency 20%. Top-matched comps best support the ARV.
Projected returns pro-forma
-3.0% appreciation · 0.84% rent growth · sell at horizon
- IRR
- 11.9%
- Equity multiple
- 1.46×
- Total profit
- $30,323
- Equity at exit
- $35,039
- IRR
- 19.2%
- Equity multiple
- 2.46×
- Total profit
- $95,955
- Equity at exit
- $20,319
Cash invested: $65,800 (down + closing). Projections, not guarantees.
Landlord ↔ Tenant lean methodology
- Overall (STATE)
- 18 Strongly Tenant-Friendly
- State California
- 18 Strongly Tenant-Friendly · D+13
- County
- — inherits STATE
- City
- — inherits STATE
ZIP-level market 91730
- Rents YoY
- 0.8%
- Active inventory
- 146
- Price-to-rent
- 6.0×
Monthly cashflow live
- Estimated rent
- $3,248 high interval (Pro) →
- Mortgage (P&I)
- −$1,232
- Tax from tax record
- −$51 /mo · $614/yr
- Insurance
- −$98
- HOA
- −$0
- Vacancy / Maint / Mgmt
- −$682
- Net cashflow
- $1,184
Break-even live
UW: 25.0% down · 7.5% · 30yr · 1.5% tax · 5.0% vac · 8.0% maint · 8.0% mgmt
Financing live
Cash to close
- Down payment
- $58,750
- Closing costs
- $7,050
- Reserves months
- —
- Total cash needed
- —
Loan-product check · same deal, 3 products live
Conventional
25% down · 7.5% · 30yr
- Down + closing
- —
- Monthly P&I
- —
- Monthly cashflow
- —
- DSCR
- —
- Eligible?
- —
Personal DTI + credit; lowest rate.
DSCR
20% down · 8.5% · 30yr
- Down + closing
- —
- Monthly P&I
- —
- Monthly cashflow
- —
- DSCR
- —
- Eligible?
- —
No personal income docs; deal must DSCR.
Hard money
10% down · 12.0% · 12mo
- Down + closing
- —
- Monthly P&I
- —
- Monthly cashflow
- —
- DSCR
- —
- Eligible?
- —
Short-term bridge; refi at stabilization.
Rent comps 29 comps
| Address | Beds | Baths | Sqft | Rent | $/sqft | DOM | Units | Dist |
|---|---|---|---|---|---|---|---|---|
| 8567 Cava Dr Rancho Cucamonga, CA | 3.0 | 2.5 | 1763 | $3,600 | $2.04 | 2d | 1 | 0.11mi |
| 8248 Inglenook Pl Rancho Cucamonga, CA | 2.0 | 2.5 | 984 | $2,400 | $2.44 | 2d | 1 | 0.15mi |
| 8630 Cava Dr Rancho Cucamonga, CA | 4.0 | 2.5 | 1763 | $3,890 | $2.21 | 11d | 1 | 0.15mi |
| 8650 Cava Dr Rancho Cucamonga, CA | 3.0 | 2.5 | 1763 | $3,200 | $1.82 | 15d | 1 | 0.18mi |
| 8523 Jasper St Rancho Cucamonga, CA | 4.0 | 2.0 | 1640 | $3,300 | $2.01 | 2d | 1 | 0.23mi |
| 8300 Gabriel Dr Unit B Rancho Cucamonga, CA | 3.0 | 2.0 | 1140 | $3,450 | $3.03 | 2d | 1 | 0.23mi |
| 8491 Gabrielino Ct Unit 69 Rancho Cucamonga, CA | 3.0 | 2.5 | 1417 | $3,850 | $2.72 | 2d | 1 | 0.25mi |
| 8231 Tapia Via Dr Rancho Cucamonga, CA | 2.0 | 1.0 | 918 | $2,075 | $2.26 | 10d | 1 | 0.39mi |
| 8555 Sandalwood Ct Rancho Cucamonga, CA | 3.0 | 2.0 | 1400 | $3,375 | $2.41 | 2d | 1 | 0.39mi |
| 8250 Vineyard Ave Rancho Cucamonga, CA | 2.0–3.0 | 2.0 | 1059 | $3,250 | $3.07 | 2d | 14 | 0.40mi |
| 8210 Rancheria Dr Unit 8 Rancho Cucamonga, CA | 3.0 | 2.0 | 1200 | $2,895 | $2.41 | 2d | 1 | 0.43mi |
| 8325 Vineyard Ave Unit 5 Rancho Cucamonga, CA | 2.0 | 2.0 | 882 | $2,400 | $2.72 | 2d | 1 | 0.50mi |
| 8167 Vineyard Ave #61 Rancho Cucamonga, CA | 3.0 | 2.5 | 1221 | $2,750 | $2.25 | 24d | 1 | 0.52mi |
| 8167 Vineyard Ave #2 Rancho Cucamonga, CA | 2.0 | 1.5 | 932 | $2,200 | $2.36 | 2d | 1 | 0.54mi |
| 8255 Vineyard Ave Rancho Cucamonga, CA | 1.0–2.0 | 1.0–2.0 | 847 | $2,966 | $3.50 | 2d | 7 | 0.55mi |
| 8445 Chaffee St Rancho Cucamonga, CA | 4.0 | 2.0 | 1438 | $3,300 | $2.29 | 15d | 1 | 0.58mi |
| 1413 San Bernardino Rd Upland, CA | 2.0 | 1.0–2.0 | 751 | $2,645 | $3.52 | 2d | 12 | 0.70mi |
| 8760 Church St Rancho Cucamonga, CA | 3.0 | 1.5 | 1151 | $3,395 | $2.95 | 10d | 1 | 0.90mi |
| 1420 Felicita Ct Upland, CA | 3.0 | 2.0 | 1339 | $3,095 | $2.31 | 5d | 1 | 1.04mi |
| 7522 Alta Cuesta Dr Rancho Cucamonga, CA | 2.0 | 2.0 | 1055 | $3,495 | $3.31 | 2d | 1 | 1.06mi |
| 1548 N Lassen Ave Ontario, CA | 2.0 | 2.0 | 900 | $2,500 | $2.78 | 2d | 1 | 1.09mi |
| 306 N 10th Ave Apt -3 Upland, CA | 3.0 | 2.0 | 1450 | $3,000 | $2.07 | 44d | 1 | 1.12mi |
| 8645 Calle Del Prado Rancho Cucamonga, CA | 2.0 | 2.0 | 875 | $2,000 | $2.29 | 10d | 1 | 1.14mi |
| 863 N 9th Ave Upland, CA | 3.0 | 2.0 | 1507 | $3,600 | $2.39 | 2d | 1 | 1.16mi |
| 890 N Campus Ave Apt B Upland, CA | 3.0 | 1.5 | 1380 | $2,900 | $2.10 | 20d | 1 | 1.29mi |
| 1129 E La Deney Ct Unit 4 Ontario, CA | 2.0 | 1.5 | 875 | $2,000 | $2.29 | 2d | 1 | 1.37mi |
| 944 E Deodar St Unit 944 Ontario, CA | 2.0 | 1.0 | 1090 | $2,100 | $1.93 | 2d | 1 | 1.44mi |
| 621 E Pine St Upland, CA | 4.0 | 2.0 | 1750 | $3,500 | $2.00 | 44d | 1 | 1.45mi |
| 517 D St Upland, CA | 3.0 | 2.0 | 1464 | $2,950 | $2.02 | 44d | 1 | 1.46mi |
Listing history 35 events
-
2026-06-18days on market $235,000 Active 310 DOM
-
2026-06-17days on market $235,000 Active 309 DOM
-
2026-06-16days on market $235,000 Active 308 DOM
-
2026-06-15days on market $235,000 Active 307 DOM
-
2026-06-13days on market $235,000 Active 305 DOM
-
2026-06-13days on market $235,000 Active 304 DOM
-
2026-06-09days on market $235,000 Active 301 DOM
-
2026-06-08days on market $235,000 Active 300 DOM
-
2026-06-07days on market $235,000 Active 299 DOM
-
2026-06-04days on market $235,000 Active 296 DOM
-
2026-06-03days on market $235,000 Active 295 DOM
-
2026-06-02days on market $235,000 Active 294 DOM
-
2026-06-01days on market $235,000 Active 293 DOM
-
2026-05-31days on market $235,000 Active 292 DOM
-
2025-11-25price $235,000
-
2025-08-12$252,400 Active
-
2017-07-25historical
-
2017-07-17status Active
-
2017-06-29historical
-
2017-06-13price $99,999
-
2017-04-10price $112,000
-
2017-01-24$115,000 Active
-
2011-10-25historical
-
2011-01-17price $55,900
-
2010-12-18price $59,900
-
2010-12-11price $66,900
-
2010-11-19price $69,900
-
2010-06-11price $73,000
-
2010-06-09price $75,250
-
2010-05-29price $75,495
-
2010-05-21price $75,501
-
2010-05-04$75,500 Active
-
2010-04-29historical
-
2009-11-29price $73,400
-
2009-08-27$80,000 Active
ⓘ Source: listings_history table (triggers on properties + properties_extension) + one-shot
backfill from property_details.listing_events for pre-trigger history.
Tax reassessment forecast CA · Resets to sale price
- Current annual tax
- $614 · $51/mo
- Projected year-2 tax
- $1,786 · $149/mo
- Expected delta
- +$1,172/yr (+$98/mo · 190.7%)
ⓘ Screening estimate from a state-policy table — verify with the county assessor before closing.
Climate risk First Street
- Flood 4/10 Moderate FEMA zone X (unshaded) · 22% chance over 30 yrs
- Wildfire 2/10 Low
- Heat 7/10 Severe 5 d/yr ≥100°F today · 15 d/yr by 30 yrs out
- Wind 1/10 Low
- Air quality 9/10 Extreme 23 unhealthy d/yr today · 28 by 30 yrs out
Nearby sold comps map
Loading sold comps map…
Walkable amenities ~0.75 mi
Loading nearby amenities…
Taxation est. · year 1
- Rental income
- $38,970
- − Mortgage interest
- −$13,164
- − Property taxes
- −$614
- − Insurance
- −$1,175
- − Repairs & maintenance
- −$3,118
- − Management
- −$3,118
- − Depreciation
- −$6,836
- Taxable income
- $10,945
- Est. tax owed @ 24.0%
- −$2,627
- After-tax cash flow
- $11,582/yr
For passive investors: Depreciation is non-cash, so a rental often shows a tax loss while cash-flowing — sheltering income. Rental losses are passive: they offset passive income freely, and up to $25,000/yr can offset ordinary (W-2) income if you actively participate and your MAGI is under $100k (phasing out to $0 by $150k); unused losses carry forward. On sale, claimed depreciation is recaptured at up to 25%, and gains may owe capital-gains tax (a 1031 exchange can defer both). Figures are a year-1 estimate at your 24.0% rate — not tax advice; consult a CPA.
Schools (NCES district)
- District
- Central Elementary
- NCES district ID
- 0607950
- Math proficiency
- 25% ▼ -18.00%
- Reading proficiency
- 25% ▼ -31.00%
- Median HH income
- $64,090
- Composite
- 23.41/100
- National rank
- #7895
- State rank
- #379 of 517 in CA
Livability — Rancho Cucamonga
- Score
- 70/100
- State rank
- #237
- US rank
- #7808
Category grades
Schools grade is shown separately in the Schools card above.
Census & demographics
- Census place
- Rancho Cucamonga, CA
- County
- San Bernardino County · 2,030,291 people
- City population
- 175,531
- Metro
- Riverside-San Bernardino-Ontario, CA
- Population (ZIP)
- 71,613
- Household income
- $92,237
- Rent vs Own
- Severe rent burden
- 4013.0
Population outlook (San Bernardino County) Hauer SSP2
- Today (2025)
- 2,300,329 people
- By 2030
- 2,378,907 · +3.4%
- By 2040
- 2,523,137 · +9.7%
- By 2050
- 2,642,388 · +14.9%
- By 2075
- 2,880,769 · +25.2%
- By 2100
- 2,909,436 · +26.5%
Race, ethnicity, and origin ACS 2023
- Neighborhood character
- Highly diverse neighborhood (Simpson 0.71)
- Race & ethnicity
- Hispanic / Latino 43% White 28% Two or more races 16% Asian 14% Black 10% Native American 2%
- Hispanic origin (detail)
- Mexican 33% Salvadoran 1%
- Common ancestry
- Lithuanian 1% Italian 1% Slovak 1%
- Foreign-born
- 23% · Canada, China, South Korea
- Languages at home
- 61% English-only · Spanish 22% Chinese 4% Tagalog/Filipino 4%
Political lean MEDSL · San Bernardino
- 2024 margin
- Toss-up / Even · D 47.5% · R 49.7% · Other 2.8%
- 2008→2024 swing
- -8.5pp toward R · 2008: 6.3pp · 2024: -2.1pp
- All cycles
- 2024: R+2.1 2020: D+10.7 2016: D+9.8 2012: D+5.4 2008: D+6.3
Not yet ingested
- Civics
- —
Market trends
- HPI YoY
- ▼ -554.10%
- Current HPI
- 404.3113
- Rent YoY
- ▲ 0.84%
- Metro
- Riverside-San Bernardino-Ontario, CA
- State GDP YoY
- ▲ 3.21%
- F500 in state
- 116
Industry mix (Fortune 500 HQ in CA)
| Industry | F500 HQs | Revenue |
|---|---|---|
| Technology | 27 | $1,492B |
|
||
| Financial Services | 3 | $174B |
|
||
| Retail | 3 | $44B |
|
||
| Insurance | 3 | $26B |
|
||
| Media / Entertainment | 2 | $115B |
|
||
| Pharmaceuticals / Biotech | 2 | $62B |
|
||
Price history
+193.8% since first listed21 events — show timeline
- 2025-11-25 Price Changed $235,000 CRMLS
- 2025-08-12 Listed $252,400 CRMLS
- 2017-07-25 Listing Removed — CRMLS
- 2017-07-17 Relisted — CRMLS
- 2017-06-29 Listing Removed — CRMLS
- 2017-06-13 Price Changed $99,999 CRMLS
- 2017-04-10 Price Changed $112,000 CRMLS
- 2017-01-24 Listed $115,000 CRMLS
- 2011-10-25 Listing Removed — CRMLS
- 2011-01-17 Price Changed $55,900 CRMLS
- 2010-12-18 Price Changed $59,900 CRMLS
- 2010-12-11 Price Changed $66,900 CRMLS
- 2010-11-19 Price Changed $69,900 CRMLS
- 2010-06-11 Price Changed $73,000 CRMLS
- 2010-06-09 Price Changed $75,250 CRMLS
- 2010-05-29 Price Changed $75,495 CRMLS
- 2010-05-21 Price Changed $75,501 CRMLS
- 2010-05-04 Listed $75,500 CRMLS
- 2010-04-29 Listing Removed — CRMLS
- 2009-11-29 Price Changed $73,400 CRMLS
- 2009-08-27 Listed $80,000 CRMLS
Property tax history
+1.0%/yrLatest (2025): $614 · +0.7% YoY. Source: county tax records.
Cash-flow waterfall
monthlySold comps — $/sqft
last 12 mo · ≤1 miLoading sold comps…