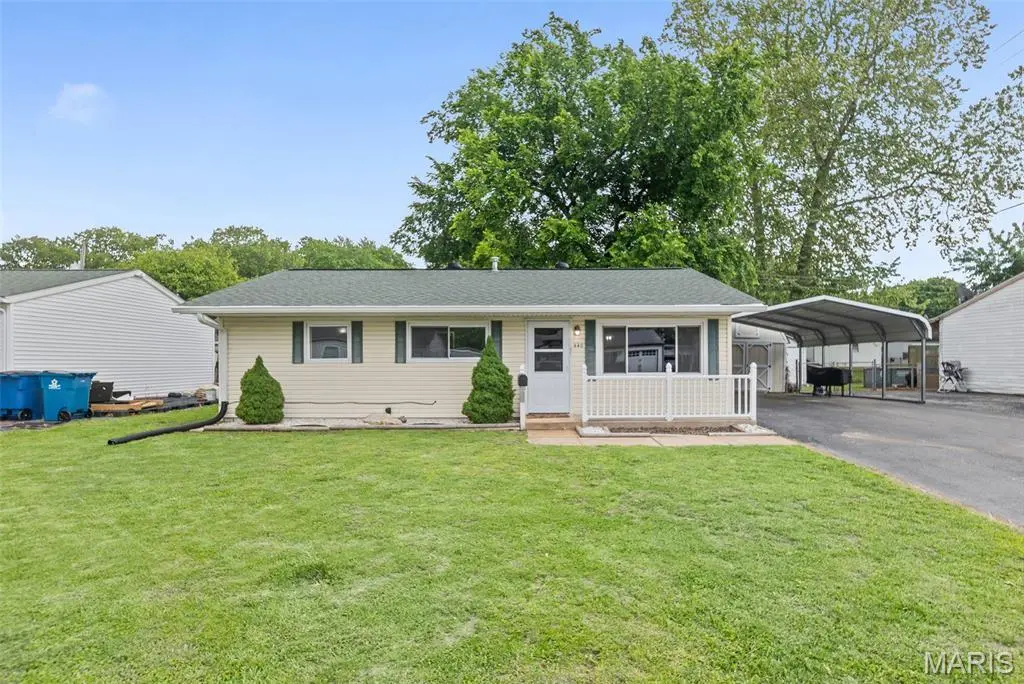
440 S 6th St · Caseyville, IL
Flood risk 4/10 · Minor
- FEMA flood zone
- AH
- Chance of flooding over 30 yrs
- 0.2%
- Est. flood insurance / yr
- $1,142 – $2,507
Fire risk 1/10 · Minimal
- Est. fire insurance / yr
- $804 – $1,492
Heat risk 5/10 · Moderate
- Hot days now (above 107°F)
- 7 days/yr
- Hot days in 30 yrs
- 21 days/yr
Wind risk 2/10 · Minimal
- Chance of severe wind over 30 yrs
- 1.0%
Air-quality risk 3/10 · Minor
- Unhealthy air days now
- 2 days/yr
- Unhealthy air days in 30 yrs
- 4 days/yr
Risk factors via First Street. Map © Google.
Why this score? — see what drove the C grade
The composite is a weighted blend of 9 inputs, each scored 0–100. Each bar is that input's sub-score; the figure is the points it added to the 100-point composite (weight × sub-score).
- Cash flow +25.6/30.0
- DSCR +8.5/10.0
- ARV discount +7.5/15.0
- 1% rule +7.0/10.0
- Livability +3.7/5.0
- Rent growth +2.5/5.0
- Condition / age +2.5/5.0
- Schools +1.6/10.0
- Appreciation +0.0/10.0
$139,900
🖨 Deal sheet (PDF) 📄 Offer letter ✓ Due diligence
Listing remarks MLS
Move right in to this cute 3 bed 1 bath home in Caseyville with screened in porch in back, fenced backyard, large carport, large storage shed. Home has been freshly painted, new carpet and is a cozy little charmer to call your very own.
Key facts
- 6,534 sq ft lot
- 2 parking spots
- Built 1958
Property features AI
Finance
- Financial info: Lease not considered; No second mortgage information indicated
Exterior
- Parking: Carport with 2 spaces
- Utilities: Public water; Public sewer; Single-phase electric; Cable available
- Home design: Single-family residence; One level
- Construction: Aluminum siding
- Exterior features: Back yard
Interior
- Kitchen: Microwave; Electric oven; Refrigerator
- Bedrooms: 3 bedrooms, all on the main level
- Bathrooms: 1 full bathroom on the main level
- Heating & cooling: Forced air heating; Central air conditioning
- Interior features: Dryer; Microwave; Electric oven; Refrigerator; Washer; Forced air heating; Central air conditioning
- Laundry & utility: Washer and dryer included
Neighborhood map
What this means for you Summary
Snapshot
- This is a 3-bed/2.0-bath single-family listed at $140k.
Deal economics
- At list price, monthly cash flow is $177 ($2k/yr) — positive.
- The deal already cash-flows at list — no discount required.
- Meets the 1% rule at list price ($2k rent vs $140k).
- Recommended offer: $138k (1.5% below list) — sets the bar for market timing.
- Cap rate 9.1% vs local median 3.3% in Caseyville — top-decile yield for the area; either an underpriced asset or a hidden risk that comps aren't pricing in. Stress-test before assuming the spread holds.
Location & tenants
- Location reads 74/100 on livability (#241 in IL, #4,389 nationally) — a middle-class / working-renter tenant base. Strengths: commute A+, cost of living A+, housing A+; Watch: health & safety C-, amenities F.
- Collinsville CUSD 10 (suburban): math 14% / reading 20% proficiency, ranked #465 of 620 in IL (top 75%) — low school quality limits family demand, transient renter base, plan for 1-2y turnover.
- Zoned schools: Caseyville Elementary School (math 8% / reading 12%, grade F, #1,517 of 2,056 statewide, top 78%, 321 students, 0% FRL); Collinsville Middle School (math 11% / reading 19%, grade F, #501 of 665 statewide, top 77%, 950 students, 0% FRL); Collinsville High School (math 16% / reading 21%, grade F, #427 of 693 statewide, top 62%, 1,978 students, 0% FRL) — zoned schools average 0% FRL vs 52% district-wide (52 pts lower); this property's tenant base skews higher-income than the district average.
- Market conditions: 49 active listings in the ZIP; 1 comparable units currently listed for rent nearby; 783 units permitted in St. Clair County in 2024 (378 in 5+ unit buildings).
Forward outlook
- Local home prices are declining (-3.0%/yr); year-one equity from $967 of loan paydown is wiped out by about $4k of value loss. Plan a longer hold.
- St. Clair County population projected at -23% by 2050 — secular population decline; favor cash flow + early exit over multi-decade hold.
Negotiation context
- It's been on market 27 days — a 2% lower offer ($138k) is reasonable based on typical stale-listing flexibility.
- 2 sale attempts since 3y ago with the ask held roughly flat each time — persistent listings suggest the price (not the market) is what's stuck; bring a comps-based counter.
Risks & watch-outs
- Watch-outs: flood insurance adds $152/mo; built in 1958 — expect roof / HVAC / electrical / plumbing capex.
- Climate carrying-cost: in FEMA flood zone AH (mandatory federal flood insurance); extreme-heat days projected 7→21/yr by 2055 (HVAC capex compounding) — expect insurance premiums to compound above CPI over the hold.
Questions for the listing agent
- Built in 1958 — when were the roof, HVAC, electrical panel, plumbing, and water heater last replaced?
- What's the actual annual flood-insurance premium (NFIP or private), and is the property in a SFHA with mandatory coverage?
- Is there a deadline driving the sale (1031 exchange, divorce, estate, relocation)? That informs how much negotiation room exists.
- Schools are F-rated, which usually means shorter tenancies and higher turnover. Who's the typical renter profile here, and what's been the actual vacancy rate?
- What's the average days-on-market for RENTAL listings here right now (not sales)? A rising rental-DOM trend means longer vacancies and softer asking-rent achievability than the comps imply.
- What's the recent tenant-quality profile in this submarket — average credit score on applications, eviction rate, late-payment / NSF rate, and stable-employment percentage? A property-management company in the area should have these aggregated.
- How much new for-sale + rental construction is in the pipeline within 1–3 miles? Heavy new supply typically softens prices + rents 12–24 months out; constrained supply supports both.
Investment metrics
- 1% rule
- 1.20% ✓
- Cap rate
- 9.11%
- Cash-on-cash
- 10.07%
- DSCR
- 1.45
- GRM
- 6.9
CMA / ARV
- ARV (median comp)
- $85,034
- List price
- $139,900
- Delta
- 64.52%
- Verdict
- OVERPRICED
- Comps
- 20 within 1.0 mi
Show comp detail 11 sales within ~0.75 mi
| Address | Dist | Beds/Ba | Sqft | Sold | Price | $/sf | Match |
|---|---|---|---|---|---|---|---|
| 455 S 6th St | 0.08mi | 3/1.0 | 925 (0%) | 11mo | $74,500 | $81 | 83 |
| 28 Weinel Ct | 0.16mi | 3/1.0 | 925 (0%) | 14mo | $150,000 | $162 | 77 |
| 436 S 5th St | 0.05mi | 3/1.0 | 962 (+4%) | 12mo | $129,900 | $135 | 77 |
| 447 S 5th St | 0.06mi | 3/1.0 | 888 (-4%) | 16mo | $34,000 | $38 | 73 |
| 452 S 6th St | 0.07mi | 3/1.0 | 1,036 (+12%) | 0mo | $135,000 | $130 | 72 |
| 403 S 6th St | 0.24mi | 3/1.0 | 894 (-3%) | 13mo | $126,900 | $142 | 68 |
| 406 S Fourth St | 0.22mi | 2/1.0 (-1) | 896 (-3%) | 16mo | $114,000 | $127 | 62 |
| 313 W Lincoln Ave | 0.23mi | 2/1.0 (-1) | 984 (+6%) | 10mo | $155,000 | $158 | 61 |
| 8825 Bermuda Ave | 0.73mi | 3/1.0 | 864 (-7%) | 1mo | $77,000 | $89 | 50 |
| 105 Brookside Dr | 0.60mi | 2/1.0 (-1) | 954 (+3%) | 14mo | $65,000 | $68 | 46 |
| 643 Hill Rd | 0.54mi | 2/1.0 (-1) | 960 (+4%) | 23mo | $45,000 | $47 | 40 |
Match score weights: distance 35% · size 25% · config 20% · recency 20%. Top-matched comps best support the ARV.
Projected returns pro-forma
-3.0% appreciation · 3.0% rent growth · sell at horizon
- IRR
- -7.8%
- Equity multiple
- 0.71×
- Total profit
- $-11,273
- Equity at exit
- $20,860
- IRR
- 1.9%
- Equity multiple
- 1.13×
- Total profit
- $5,243
- Equity at exit
- $12,096
Cash invested: $39,172 (down + closing). Projections, not guarantees.
Landlord ↔ Tenant lean methodology
- Overall (STATE)
- 43 Moderately Tenant-Leaning
- State Illinois
- 43 Moderately Tenant-Leaning · D+7
- County
- — inherits STATE
- City
- — inherits STATE
ZIP-level market 62232
- Active inventory
- 49
- Price-to-rent
- 6.9×
Monthly cashflow live
- Estimated rent
- $1,680 medium interval (Pro) →
- Mortgage (P&I)
- −$734
- Tax from tax record
- −$206 /mo · $2,477/yr
- Insurance
- −$58
- Flood insurance flood zone
- −$152 /mo · $1,824/yr
- HOA
- −$0
- Vacancy / Maint / Mgmt
- −$353
- Net cashflow
- $177
Break-even live
Sensitivity live
| Price | -10% $256 | -5% $216 | +0% $177 | +5% $137 | +10% $98 |
|---|---|---|---|---|---|
| Rent | -10% $44 | -5% $110 | +0% $177 | +5% $243 | +10% $309 |
| Rate | -1.0pp $247 | -0.5pp $212 | base $177 | +0.5pp $141 | +1.0pp $104 |
UW: 25.0% down · 7.5% · 30yr · 1.5% tax · 5.0% vac · 8.0% maint · 8.0% mgmt
Financing live
Cash to close
- Down payment
- $34,975
- Closing costs
- $4,197
- Reserves months
- —
- Total cash needed
- —
Loan-product check · same deal, 3 products live
Conventional
25% down · 7.5% · 30yr
- Down + closing
- —
- Monthly P&I
- —
- Monthly cashflow
- —
- DSCR
- —
- Eligible?
- —
Personal DTI + credit; lowest rate.
DSCR
20% down · 8.5% · 30yr
- Down + closing
- —
- Monthly P&I
- —
- Monthly cashflow
- —
- DSCR
- —
- Eligible?
- —
No personal income docs; deal must DSCR.
Hard money
10% down · 12.0% · 12mo
- Down + closing
- —
- Monthly P&I
- —
- Monthly cashflow
- —
- DSCR
- —
- Eligible?
- —
Short-term bridge; refi at stabilization.
Rent comps 1 comps
| Address | Beds | Baths | Sqft | Rent | $/sqft | DOM | Units | Dist |
|---|---|---|---|---|---|---|---|---|
| 455 S 6th St Caseyville, IL | 4.0 | 1.0 | 925 | $1,680 | $1.82 | 0d | 1 | 0.05mi |
Listing history 17 events
-
2026-06-13statusdays on market $139,900 Pending 27 DOM
-
2026-06-09days on market $139,900 Active Under Contract 24 DOM
-
2026-06-08days on market $139,900 Active Under Contract 23 DOM
-
2026-06-07days on market $139,900 Active Under Contract 22 DOM
-
2026-06-05days on market $139,900 Active Under Contract 19 DOM
-
2026-06-03days on market $139,900 Active Under Contract 18 DOM
-
2026-06-02days on market $139,900 Active Under Contract 17 DOM
-
2026-06-01days on market $139,900 Active Under Contract 16 DOM
-
2026-05-31days on market $139,900 Active Under Contract 15 DOM
-
2026-05-17$139,900 Active 559-char remark
-
2026-05-06historical $139,900 559-char remark
-
2023-08-28soldstatus $122,500
-
2023-08-25soldstatus Closed 236-char remark
Show marketing remark (236 chars)
Move right in to this cute 3 bed 1 bath home in Caseyville with screened in porch in back, fenced backyard, large carport, large storage shed. Home has been freshly painted, new carpet and is a cozy little charmer to call your very own.
-
2023-08-02status Pending 236-char remark
Show marketing remark (236 chars)
Move right in to this cute 3 bed 1 bath home in Caseyville with screened in porch in back, fenced backyard, large carport, large storage shed. Home has been freshly painted, new carpet and is a cozy little charmer to call your very own.
-
2023-07-25$129,000 Active 236-char remark
Show marketing remark (236 chars)
Move right in to this cute 3 bed 1 bath home in Caseyville with screened in porch in back, fenced backyard, large carport, large storage shed. Home has been freshly painted, new carpet and is a cozy little charmer to call your very own.
-
2023-06-22soldstatus $85,000
-
2001-08-01soldstatus $62,500
ⓘ Source: listings_history table (triggers on properties + properties_extension) + one-shot
backfill from property_details.listing_events for pre-trigger history.
Tax reassessment forecast IL · Partial reset (capped growth)
- Current annual tax
- $2,477 · $206/mo
- Projected year-2 tax
- $2,827 · $236/mo
- Expected delta
- +$349/yr (+$29/mo · 14.1%)
ⓘ Screening estimate from a state-policy table — verify with the county assessor before closing.
Climate risk First Street
- Flood 4/10 Moderate FEMA zone AH · 20% chance over 30 yrs
- Wildfire 1/10 Low
- Heat 5/10 Major 7 d/yr ≥107°F today · 21 d/yr by 30 yrs out
- Wind 2/10 Low 100% chance of damaging wind over 30 yrs
- Air quality 3/10 Moderate 2 unhealthy d/yr today · 4 by 30 yrs out
Nearby sold comps map
Loading sold comps map…
Walkable amenities ~0.75 mi
Loading nearby amenities…
Taxation est. · year 1
- Rental income
- $20,160
- − Mortgage interest
- −$7,837
- − Property taxes
- −$2,477
- − Insurance
- −$2,524
- − Repairs & maintenance
- −$1,613
- − Management
- −$1,613
- − Depreciation
- −$4,070
- Taxable income
- $27
- Est. tax owed @ 24.0%
- −$6
- After-tax cash flow
- $2,115/yr
For passive investors: Depreciation is non-cash, so a rental often shows a tax loss while cash-flowing — sheltering income. Rental losses are passive: they offset passive income freely, and up to $25,000/yr can offset ordinary (W-2) income if you actively participate and your MAGI is under $100k (phasing out to $0 by $150k); unused losses carry forward. On sale, claimed depreciation is recaptured at up to 25%, and gains may owe capital-gains tax (a 1031 exchange can defer both). Figures are a year-1 estimate at your 24.0% rate — not tax advice; consult a CPA.
Schools (NCES district)
- District
- Collinsville CUSD 10
- NCES district ID
- 1710650
- Math proficiency
- 14% ▼ -9.00%
- Reading proficiency
- 20% ▼ -7.00%
- Median HH income
- $52,504
- Composite
- 15.65/100
- National rank
- #9288
- State rank
- #465 of 620 in IL
Livability — Caseyville
- Score
- 74/100
- State rank
- #241
- US rank
- #4389
Category grades
Schools grade is shown separately in the Schools card above.
Census & demographics
- Census place
- Caseyville, IL
- City population
- 7,480
- Population (ZIP)
- 7,480
Population outlook (St. Clair County) Hauer SSP2
- Today (2025)
- 250,366 people
- By 2030
- 240,511 · -3.9%
- By 2040
- 217,391 · -13.2%
- By 2050
- 192,699 · -23.0%
- By 2075
- 140,637 · -43.8%
- By 2100
- 100,499 · -59.9%
Race, ethnicity, and origin ACS 2023
- Neighborhood character
- Predominantly White (66%)
- Race & ethnicity
- White 66% Hispanic / Latino 18% Black 9% Two or more races 9%
- Hispanic origin (detail)
- Mexican 14% Puerto Rican 2%
- Common ancestry
- Lithuanian 4% Romanian 3% Portuguese 3%
- Foreign-born
- 4% · Canada
- Languages at home
- 89% English-only · Spanish 10%
Political lean MEDSL · St. Clair
- 2024 margin
- Lean D (+7.9) · D 53.0% · R 45.1% · Other 1.8%
- 2008→2024 swing
- -14.6pp toward R · 2008: 22.4pp · 2024: 7.9pp
- All cycles
- 2024: D+7.9 2020: D+8.7 2016: D+5.6 2012: D+14.5 2008: D+22.4
Not yet ingested
- Civics
- —
Market trends
- HPI YoY
- ▼ -83.21%
- Current HPI
- 124.0291
- Rent YoY
- —
- Metro
- —
- State GDP YoY
- ▲ 1.59%
- F500 in state
- 60
Industry mix (Fortune 500 HQ in IL)
| Industry | F500 HQs | Revenue |
|---|---|---|
| Insurance | 4 | $201B |
|
||
| Consumer Goods | 4 | $87B |
|
||
| Industrial Machinery | 3 | $64B |
|
||
| Healthcare | 2 | $55B |
|
||
| Retail / Pharmacy | 1 | $148B |
|
||
| Agriculture / Food | 1 | $86B |
|
||
Price history
+123.8% since first listed10 events — show timeline
- 2026-06-13 Pending — MARIS as Distributed by MLS Grid
- 2026-05-19 Contingent — MARIS as Distributed by MLS Grid
- 2026-05-17 Listed $139,900 MARIS as Distributed by MLS Grid
- 2026-05-06 Coming Soon $139,900 MARIS as Distributed by MLS Grid
- 2023-08-28 Sold (Public Records) $122,500 Public Records
- 2023-08-25 Sold (MLS) — MARIS as Distributed by MLS Grid
- 2023-08-02 Pending — MARIS as Distributed by MLS Grid
- 2023-07-25 Listed $129,000 MARIS as Distributed by MLS Grid
- 2023-06-22 Sold (Public Records) $85,000 Public Records
- 2001-08-01 Sold (Public Records) $62,500 Public Records
Property tax history
+7.3%/yrLatest (2024): $2,477 · +41.9% YoY. Source: county tax records.
Cash-flow waterfall
monthlySold comps — $/sqft
last 12 mo · ≤1 miLoading sold comps…