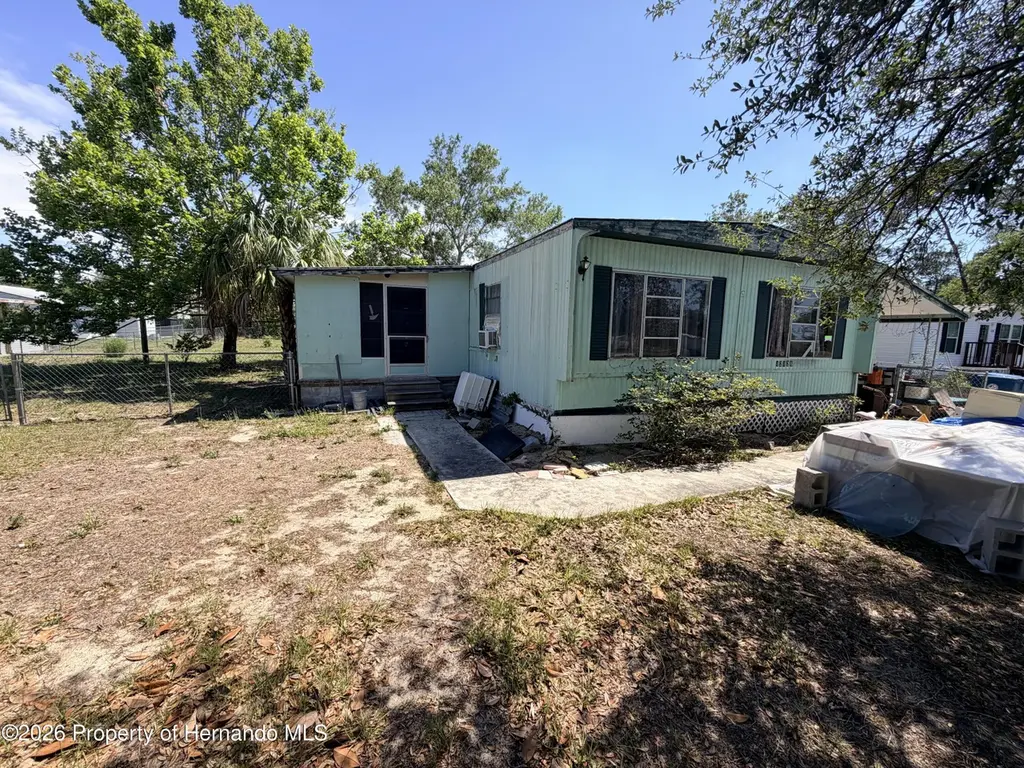
12126 Pitcairn St · High Point, FL
Flood risk 1/10 · Minimal
- FEMA flood zone
- X (unshaded)
- Chance of flooding over 30 yrs
- 0.0%
- Est. flood insurance / yr
- $507 – $1,088
Fire risk 3/10 · Minor
- Est. fire insurance / yr
- $947 – $1,759
Heat risk 10/10 · Severe
- Hot days now (above 109°F)
- 7 days/yr
- Hot days in 30 yrs
- 23 days/yr
Wind risk 10/10 · Severe
- Chance of severe wind over 30 yrs
- 99.0%
Air-quality risk 2/10 · Minimal
- Unhealthy air days now
- 2 days/yr
- Unhealthy air days in 30 yrs
- 2 days/yr
Risk factors via First Street. Map © Google.
Why this score? — see what drove the B+ grade
The composite is a weighted blend of 9 inputs, each scored 0–100. Each bar is that input's sub-score; the figure is the points it added to the 100-point composite (weight × sub-score).
- Cash flow +30.0/30.0
- ARV discount +15.0/15.0
- 1% rule +10.0/10.0
- DSCR +10.0/10.0
- Schools +4.2/10.0
- Livability +3.2/5.0
- Rent growth +2.5/5.0
- Condition / age +2.5/5.0
- Appreciation +0.0/10.0
$75,000
🖨 Deal sheet 📄 Offer letter ✓ Due diligence
Listing remarks
INVESTOR SPECIAL! This three-bedroom manufactured home is located in a desirable area with quick access to Hwy 50 and nearby shopping, offering strong potential for the right buyer. Situated on a generous . 44-acre lot, the property features a chain-link fenced backyard and plenty of space for future improvements or expansion. The home does require significant TLC, making it an ideal opportunity for investors, flippers, or buyers looking to customize a property to their liking. Cash only sale, being sold as-is.
Key facts
- 0.44 acre lot
- Parking
- Built 1972
Tags
Property features AI
Exterior
- Parking: Carport (1 space)
- Utilities: Well water; Septic tank; Cable available
- Home design: Manufactured home; One level
- Exterior features: Chain link fence; Asphalt road access; Lot is approximately 0.44 acres; PUD/PDP zoning
Interior
- Bathrooms: 2 full bathrooms
- Interior features: Central heating and cooling; Other heating and cooling systems (unspecified)
Neighborhood map
What this means for you Summary
Snapshot
- This is a 3-bed/2.0-bath manufactured listed at $75k.
Deal economics
- At list price, monthly cash flow is $1k ($12k/yr) — positive.
- The deal already cash-flows at list — no discount required.
- Meets the 1% rule at list price ($2k rent vs $75k).
- Recommended offer: $74k (1.5% below list) — sets the bar for market timing.
- Cap rate 22.9% vs local median 5.8% in High Point — top-decile yield for the area; either an underpriced asset or a hidden risk that comps aren't pricing in. Stress-test before assuming the spread holds.
Location & tenants
- Location reads 64/100 on livability (#677 in FL) — a middle-class / working-renter tenant base. Strengths: cost of living A+, housing A+, crime A; Watch: health & safety C-, amenities F, commute F.
- Hernando (suburban): math 50% / reading 50% proficiency, ranked #38 of 73 in FL (top 52%) — acceptable for families but not a draw, mixed tenant base, ~2y average lease.
- Zoned schools: Pine Grove Elementary School (math 60% / reading 45%, grade C-, #976 of 2,144 statewide, top 46%, 991 students, 60% FRL); West Hernando Middle School (math 36% / reading 37%, grade F, #405 of 571 statewide, top 72%, 695 students, 58% FRL); Central High School (math 34% / reading 44%, grade F, #312 of 667 statewide, top 48%, 1,426 students, 53% FRL) — zoned schools at 57% FRL track the district average.
- Market conditions: 691 active listings in the ZIP; 5 comparable units currently listed for rent nearby; rentals at typical pace (median 24d on market — plan ~3-4 weeks tenant-placement turnaround); 2,505 units permitted in Hernando County in 2024 (318 in 5+ unit buildings).
- This rent runs 39% of the median local income ($59k/yr) — at the standard rent-burdened threshold; future hikes will face affordability resistance.
Forward outlook
- Local home prices are declining (-3.0%/yr); year-one equity from $519 of loan paydown is wiped out by about $2k of value loss. Plan a longer hold.
- Hernando County population projected at +11% by 2050 — modest demand growth; plan on rents tracking national, not racing it.
- At projected returns (-3.0% appreciation + 3.0% rent growth), your $21k cash investment doubles in ~2 years — after that, you're playing with house money.
Negotiation context
- It's been on market 25 days — a 2% lower offer ($74k) is reasonable based on typical stale-listing flexibility.
- Current owner paid $27k; list at $75k implies a 178% gain — meaningful room to come down on a strong offer.
Risks & watch-outs
- Climate carrying-cost: severe wind risk, 99% chance of damaging wind over 30y; extreme-heat days projected 7→23/yr by 2055 (HVAC capex compounding) — expect insurance premiums to compound above CPI over the hold.
Questions for the listing agent
- Built in 1972 — when were the roof, HVAC, electrical panel, plumbing, and water heater last replaced?
- Is there a deadline driving the sale (1031 exchange, divorce, estate, relocation)? That informs how much negotiation room exists.
- Schools are F-rated, which usually means shorter tenancies and higher turnover. Who's the typical renter profile here, and what's been the actual vacancy rate?
- What's the average days-on-market for RENTAL listings here right now (not sales)? A rising rental-DOM trend means longer vacancies and softer asking-rent achievability than the comps imply.
- What's the recent tenant-quality profile in this submarket — average credit score on applications, eviction rate, late-payment / NSF rate, and stable-employment percentage? A property-management company in the area should have these aggregated.
- How much new for-sale + rental construction is in the pipeline within 1–3 miles? Heavy new supply typically softens prices + rents 12–24 months out; constrained supply supports both.
Investment metrics
- 1% rule
- 2.54% ✓
- Cap rate
- 22.92%
- Cash-on-cash
- 59.37%
- DSCR
- 3.64
- GRM
- 3.3
CMA / ARV
- ARV (on-the-fly)
- $141,696
- Comps found
- 12
Show comp detail 12 sales within ~0.75 mi
| Address | Dist | Beds/Ba | Sqft | Sold | Price | $/sf | Match |
|---|---|---|---|---|---|---|---|
| 12041 Fairway Ave | 0.15mi | 2/2.0 (-1) | 1,152 (0%) | 1mo | $135,000 | $117 | 87 |
| 12075 Walshwood Ave | 0.16mi | 2/2.0 (-1) | 1,104 (-4%) | 0mo | $107,084 | $97 | 80 |
| 8221 Highpoint Blvd | 0.31mi | 2/2.0 (-1) | 1,152 (0%) | 2mo | $85,000 | $74 | 79 |
| 8043 Little Tee Ln | 0.43mi | 2/2.0 (-1) | 1,152 (0%) | 2mo | $112,400 | $98 | 73 |
| 12306 Club House Rd | 0.57mi | 2/2.0 (-1) | 1,152 (0%) | 2mo | $149,900 | $130 | 67 |
| 12160 Sara | 0.30mi | 3/2.0 | 1,296 (+12%) | 1mo | $195,000 | $150 | 64 |
| 12260 Hallmark Ave | 0.66mi | 2/2.0 (-1) | 1,152 (0%) | 1mo | $105,000 | $91 | 64 |
| 8134 Baycrest Dr | 0.30mi | 2/2.0 (-1) | 1,284 (+12%) | 2mo | $158,000 | $123 | 60 |
| 7444 Highpoint Blvd | 0.72mi | 2/2.0 (-1) | 1,104 (-4%) | 1mo | $140,000 | $127 | 54 |
| 7528 Western Circle Dr | 0.62mi | 2/2.0 (-1) | 1,026 (-11%) | 1mo | $105,000 | $102 | 47 |
| 12087 Club House Rd | 0.60mi | 2/2.0 (-1) | 984 (-15%) | 0mo | $125,000 | $127 | 42 |
| 7360 Nielson Ave | 0.75mi | 2/2.0 (-1) | 1,300 (+13%) | 2mo | $179,900 | $138 | 37 |
Match score weights: distance 35% · size 25% · config 20% · recency 20%. Top-matched comps best support the ARV.
Projected returns pro-forma
-3.0% appreciation · 3.0% rent growth · sell at horizon
- IRR
- 58.0%
- Equity multiple
- 3.57×
- Total profit
- $54,019
- Equity at exit
- $11,183
- IRR
- 62.9%
- Equity multiple
- 7.30×
- Total profit
- $132,235
- Equity at exit
- $6,485
Cash invested: $21,000 (down + closing). Projections, not guarantees.
Landlord ↔ Tenant lean methodology
- Overall (STATE)
- 87 Strongly Landlord-Friendly
- State Florida
- 87 Strongly Landlord-Friendly · R+3
- County
- — inherits STATE
- City
- — inherits STATE
ZIP-level market 34613
- Home prices YoY
- -17.2%
- Active inventory
- 691
- Price-to-rent
- 3.3×
Monthly cashflow live
- Estimated rent
- $1,905 high interval (Pro) →
- Mortgage (P&I)
- −$393
- Tax from tax record
- −$41 /mo · $494/yr
- Insurance
- −$31
- HOA
- −$0
- Vacancy / Maint / Mgmt
- −$400
- Net cashflow
- $1,039
Break-even live
UW: 25.0% down · 7.5% · 30yr · 1.5% tax · 5.0% vac · 8.0% maint · 8.0% mgmt
Financing live
Cash to close
- Down payment
- $18,750
- Closing costs
- $2,250
- Reserves months
- —
- Total cash needed
- —
Loan-product check · same deal, 3 products live
Conventional
25% down · 7.5% · 30yr
- Down + closing
- —
- Monthly P&I
- —
- Monthly cashflow
- —
- DSCR
- —
- Eligible?
- —
Personal DTI + credit; lowest rate.
DSCR
20% down · 8.5% · 30yr
- Down + closing
- —
- Monthly P&I
- —
- Monthly cashflow
- —
- DSCR
- —
- Eligible?
- —
No personal income docs; deal must DSCR.
Hard money
10% down · 12.0% · 12mo
- Down + closing
- —
- Monthly P&I
- —
- Monthly cashflow
- —
- DSCR
- —
- Eligible?
- —
Short-term bridge; refi at stabilization.
Rent comps 5 comps
| Address | Beds | Baths | Sqft | Rent | $/sqft | DOM | Units | Dist |
|---|---|---|---|---|---|---|---|---|
| 12103 Fairway Ave Brooksville, FL | 2.0 | 2.0 | 864 | $1,725 | $2.00 | 1d | 1 | 0.02mi |
| 12136 Fairway Ave Brooksville, FL | 2.0 | 2.0 | 920 | $1,650 | $1.79 | 24d | 1 | 0.07mi |
| 7405 Western Circle Dr Brooksville, FL | 2.0 | 2.0 | 1442 | $1,500 | $1.04 | 24d | 1 | 0.79mi |
| 7402 Eastern Circle Dr Brooksville, FL | 2.0 | 1.0 | 720 | $1,200 | $1.67 | 24d | 1 | 0.87mi |
| 13020 Sun Rd Brooksville, FL | 2.0 | 2.0 | 1424 | $1,700 | $1.19 | 24d | 1 | 1.35mi |
Listing history 5 events
-
2026-05-31status $75,000 Pending 25 DOM
-
2026-05-31days on market $75,000 Active 25 DOM
-
2026-05-06$75,000 Active
-
1986-05-01soldstatus $27,000
-
1981-07-01soldstatus $27,800
ⓘ Source: listings_history table (triggers on properties + properties_extension) + one-shot
backfill from property_details.listing_events for pre-trigger history.
Tax reassessment forecast FL · Resets to sale price
- Current annual tax
- $494 · $41/mo
- Projected year-2 tax
- $622 · $52/mo
- Expected delta
- +$129/yr (+$11/mo · 26.1%)
ⓘ Screening estimate from a state-policy table — verify with the county assessor before closing.
Climate risk First Street
- Flood 1/10 Low FEMA zone X (unshaded) · 0% chance over 30 yrs
- Wildfire 3/10 Moderate
- Heat 10/10 Extreme 7 d/yr ≥109°F today · 23 d/yr by 30 yrs out
- Wind 10/10 Extreme 99% chance of damaging wind over 30 yrs
- Air quality 2/10 Low 2 unhealthy d/yr today · 2 by 30 yrs out
Nearby sold comps map
Loading sold comps map…
Walkable amenities ~0.75 mi
Loading nearby amenities…
Taxation est. · year 1
- Rental income
- $22,857
- − Mortgage interest
- −$4,201
- − Property taxes
- −$494
- − Insurance
- −$375
- − Repairs & maintenance
- −$1,829
- − Management
- −$1,829
- − Depreciation
- −$2,182
- Taxable income
- $11,948
- Est. tax owed @ 24.0%
- −$2,867
- After-tax cash flow
- $9,601/yr
For passive investors: Depreciation is non-cash, so a rental often shows a tax loss while cash-flowing — sheltering income. Rental losses are passive: they offset passive income freely, and up to $25,000/yr can offset ordinary (W-2) income if you actively participate and your MAGI is under $100k (phasing out to $0 by $150k); unused losses carry forward. On sale, claimed depreciation is recaptured at up to 25%, and gains may owe capital-gains tax (a 1031 exchange can defer both). Figures are a year-1 estimate at your 24.0% rate — not tax advice; consult a CPA.
Schools (NCES district)
- District
- Hernando
- NCES district ID
- 1200810
- Math proficiency
- 50% ▼ -8.00%
- Reading proficiency
- 50% ▼ -4.00%
- Median HH income
- $41,985
- Composite
- 42.03/100
- National rank
- #3329
- State rank
- #38 of 73 in FL
Livability — High Point
- Score
- 64/100
- State rank
- #677
- US rank
- #14099
Category grades
Schools grade is shown separately in the Schools card above.
Census & demographics
- Census place
- High Point, FL
- County
- Hernando County · 169,677 people
- Metro
- Tampa-St. Petersburg-Clearwater, FL
- Population (ZIP)
- 19,337
- Household income
- $58,596
- Rent vs Own
- Severe rent burden
- 307.0
Population outlook (Hernando County) Hauer SSP2
- Today (2025)
- 189,218 people
- By 2030
- 194,367 · +2.7%
- By 2040
- 203,398 · +7.5%
- By 2050
- 209,589 · +10.8%
- By 2075
- 218,452 · +15.4%
- By 2100
- 205,923 · +8.8%
Race, ethnicity, and origin ACS 2023
- Neighborhood character
- Predominantly White (88%)
- Race & ethnicity
- White 88% Hispanic / Latino 6% Two or more races 4% Black 2% Asian 1%
- Hispanic origin (detail)
- Mexican 1% Puerto Rican 2% Cuban 1%
- Common ancestry
- Romanian 4% Lithuanian 3% Slovak 2%
- Foreign-born
- 8% · Canada, Vietnam
- Languages at home
- 92% English-only · Spanish 3% French/Haitian/Cajun 1% Russian/Polish/Slavic 1%
Political lean MEDSL · Hernando
- 2024 margin
- Solid R (+37.0) · D 31.1% · R 68.2%
- 2008→2024 swing
- -33.5pp toward R · 2008: -3.6pp · 2024: -37.0pp
- All cycles
- 2024: R+37.0 2020: R+30.2 2016: R+29.0 2012: R+8.5 2008: R+3.6
Not yet ingested
- Civics
- —
Market trends
- HPI YoY
- ▼ -57.51%
- Current HPI
- 276.2229
- Rent YoY
- —
- Metro
- Tampa-St. Petersburg-Clearwater, FL
- State GDP YoY
- ▲ 3.28%
- F500 in state
- 36
Industry mix (Fortune 500 HQ in FL)
| Industry | F500 HQs | Revenue |
|---|---|---|
| Industrial Technology | 2 | $29B |
|
||
| Insurance | 2 | $17B |
|
||
| Retail | 1 | $60B |
|
||
| Technology Distribution | 1 | $58B |
|
||
| Homebuilding | 1 | $35B |
|
||
| Technology Manufacturing | 1 | $35B |
|
||
Price history
+169.8% since first listed3 events — show timeline
- 2026-05-06 Listed $75,000 HCAR
- 1986-05-01 Sold (Public Records) $27,000 Public Records
- 1981-07-01 Sold (Public Records) $27,800 Public Records
Property tax history
+6.9%/yrLatest (2025): $494 · +1.8% YoY. Source: county tax records.
Cash-flow waterfall
monthlySold comps — $/sqft
last 12 mo · ≤1 miLoading sold comps…